OCI Intelligence
コンソールの OCI Intelligence は、Oracle Cloud Infrastructure のコストを把握し、OCI への投資価値を最大化するのに役立ちます。ダッシュボードはコストパターンを分析し、データトレンドを追跡し、リソース利用状況を特定し、主要なコスト要因を可視化することで、パフォーマンスと支出の最適化を支援します。
必要な権限
- Cloud Analytics User
OCI Intelligence ダッシュボード
OCI Intelligence ダッシュボードは、OCI の支出のさまざまな側面を強調表示するレポートウィジェットで構成されています。DoiT アカウント内で OCI ワークロードが検出されると、自動的にデータが入力されます。
OCI Intelligence ダッシュボードにアクセスするには、上部ナビゲーションのメガメニューから Dashboards > OCI Intelligence を選択してください。
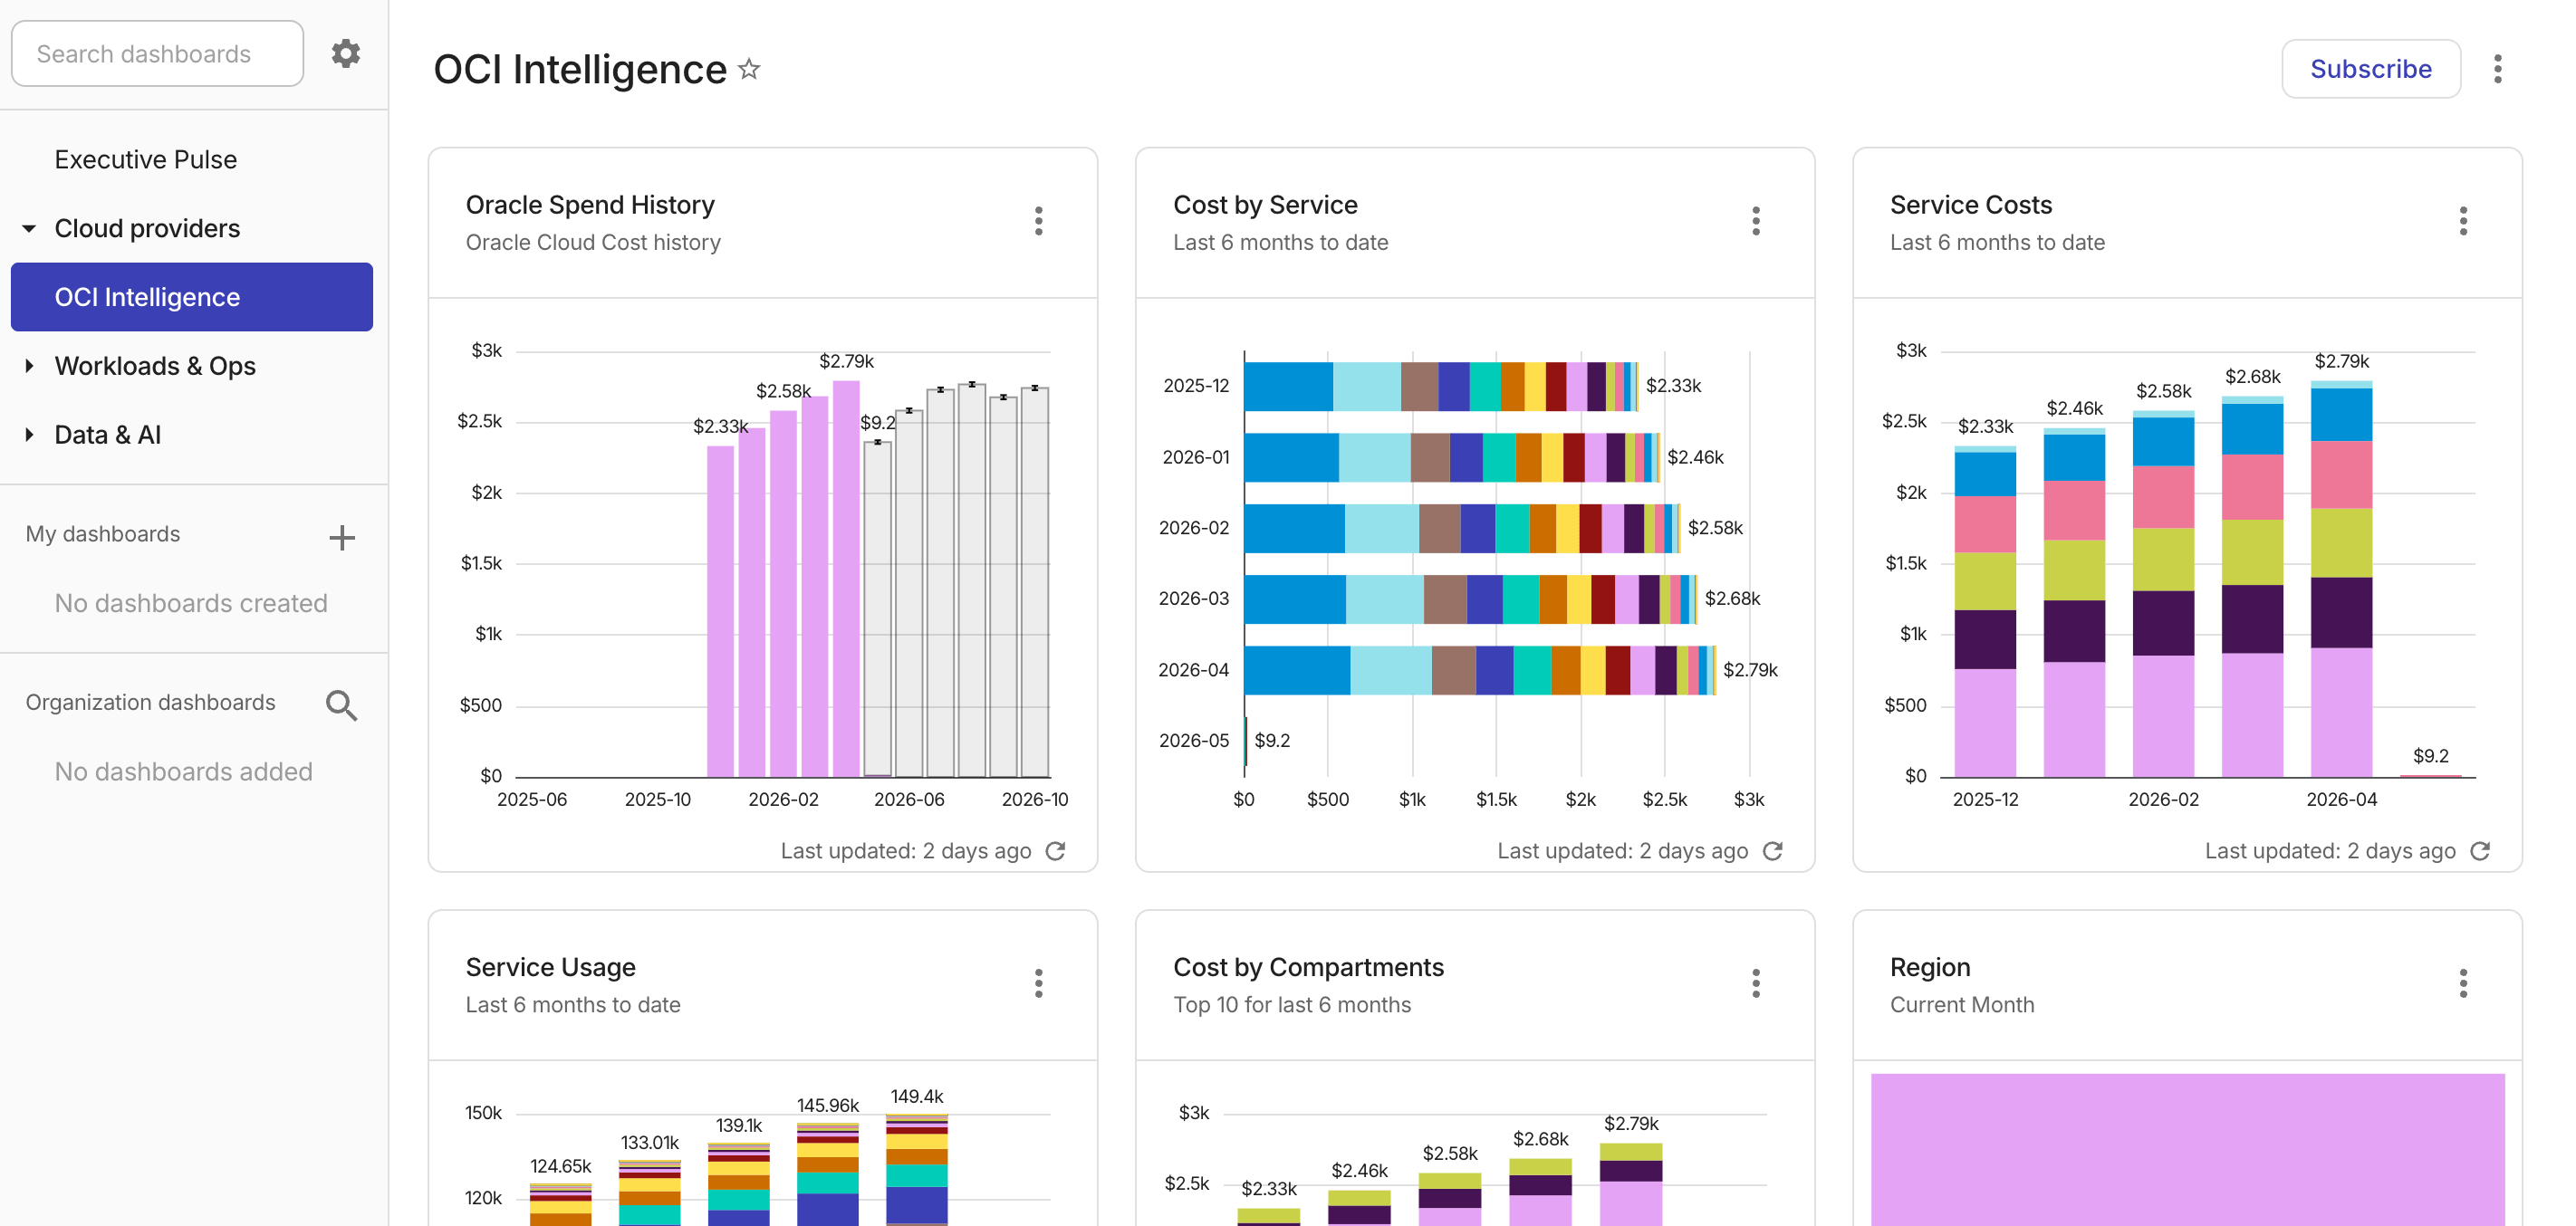
ダッシュボード上の各ウィジェットは、それぞれ独立して更新されます。詳細については、Refresh report data を参照してください。
レポート設定を確認するには Open full report を実行するか、customize the preset report を行って独自のレポートを作成できます。
DoiT と OCI の用語の対応関係については、Work with OCI data を参照してください。
Oracle Spend History
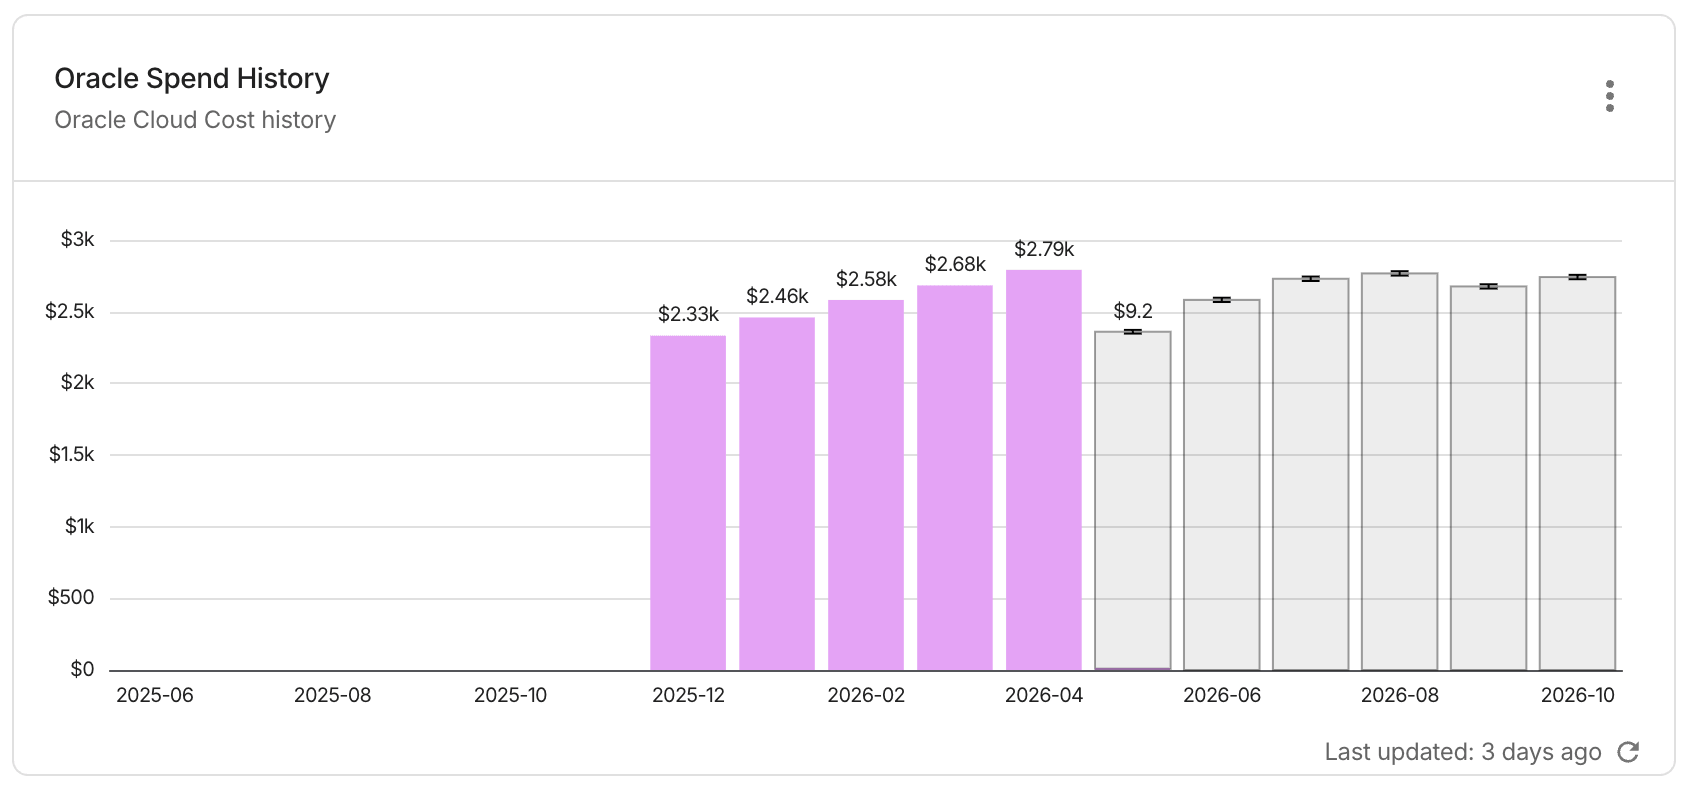
レポート設定:
- Metrics: Cost
- Time Range: Last 12 months(今月を含む)
- Time Interval: Month
- Filter results: Provider が
Oracle Cloud - Forecast settings:
- Historical data time range: Last 12 months
- Forecast horizon: Next 6 months
- Granularity: Forecast totals only
Cost by Service
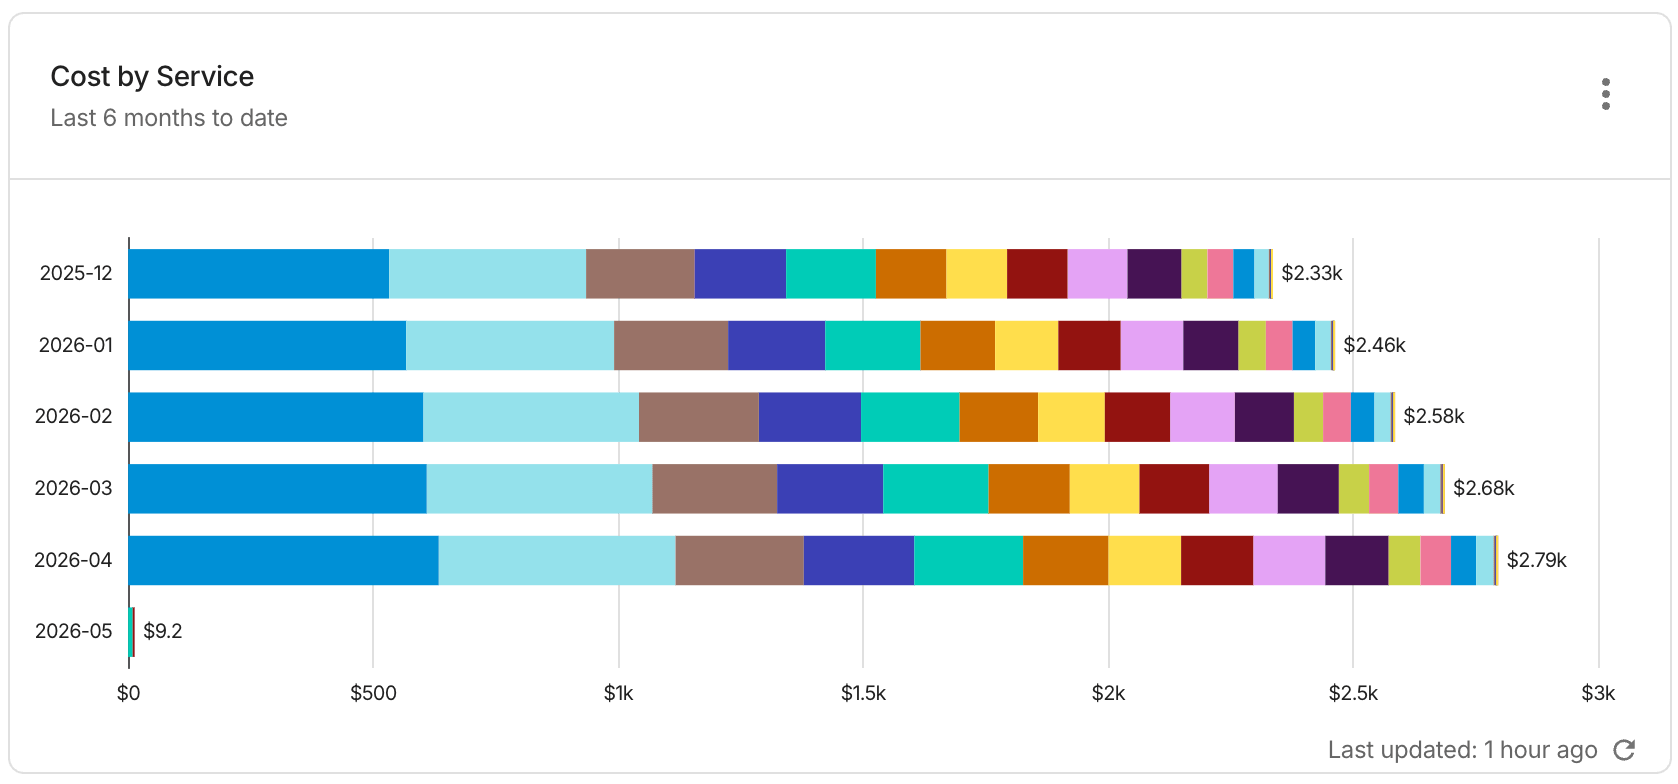
レポート設定:
- Metrics: Cost
- Time Range: Last 6 months(今月を含む)
- Time Interval: Month
- Filter results: Provider が
Oracle Cloud - Group by: Service
Service Costs
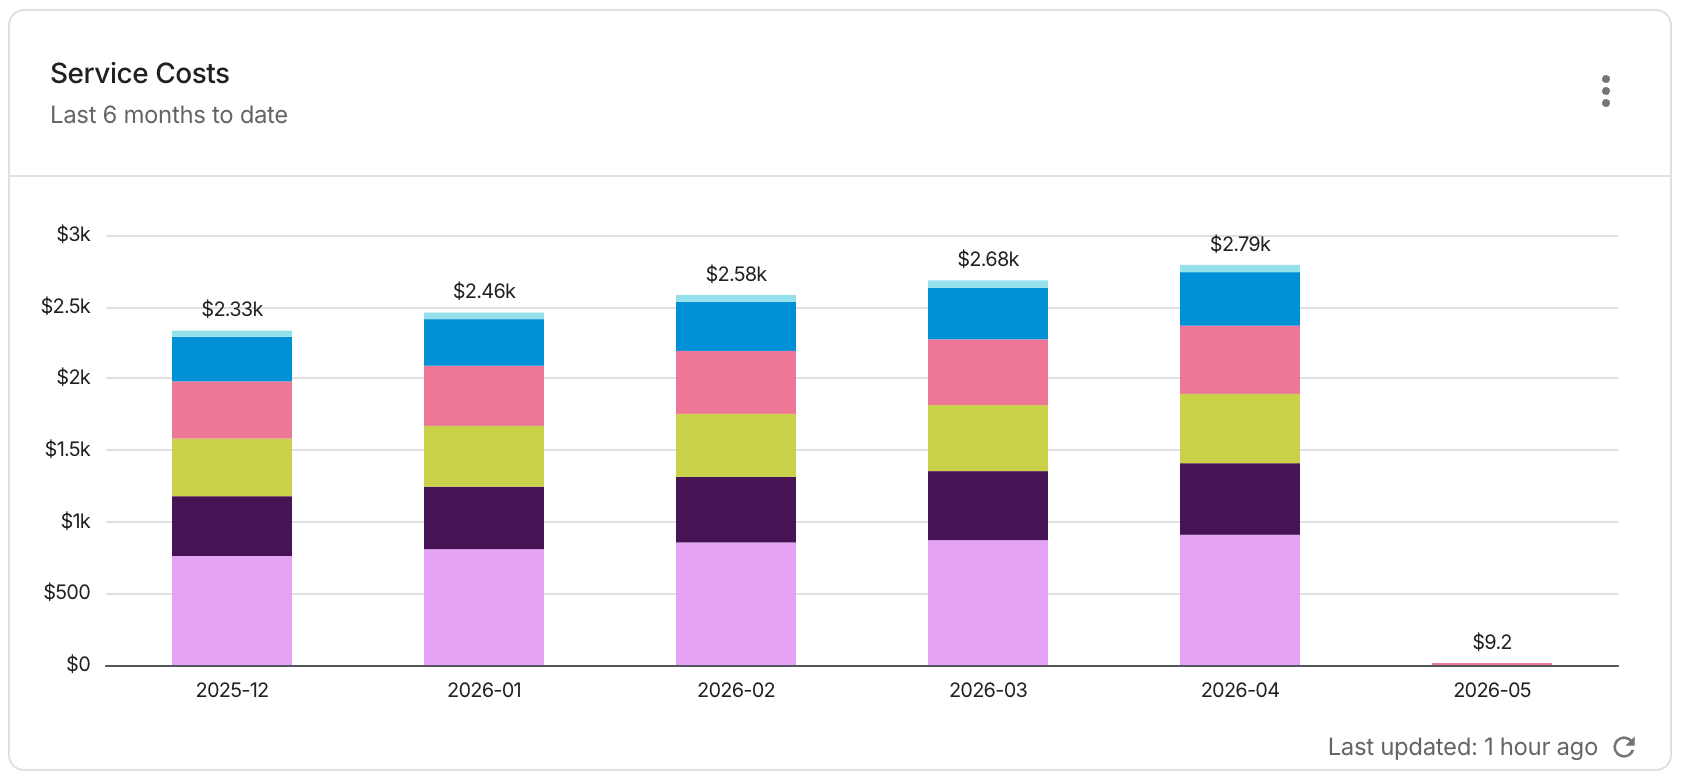
レポート設定:
- Metrics: Cost
- Time Range: Last 6 months(今月を含む)
- Time Interval: Month
- Filter results: Provider が
Oracle Cloud - Group by: Service ID
Service Usage
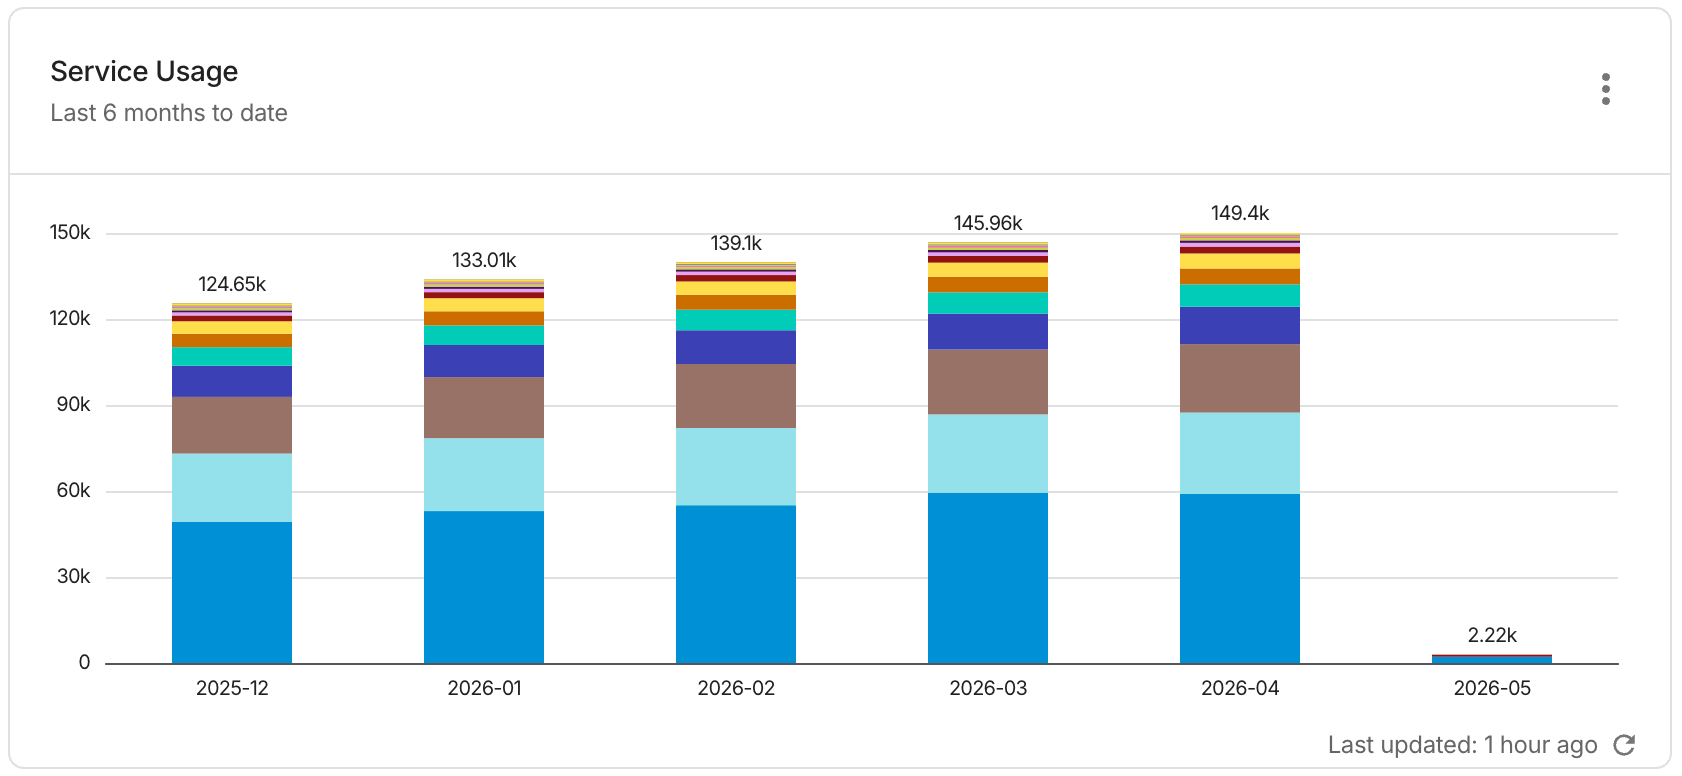
レポート設定:
- Metrics: Usage(
UsageQuantityも参照) - Time Range: Last 6 months(今月を含む)
- Time Interval: Month
- Filter results: Provider が
Oracle Cloud - Group by: Service
Cost by Compartments
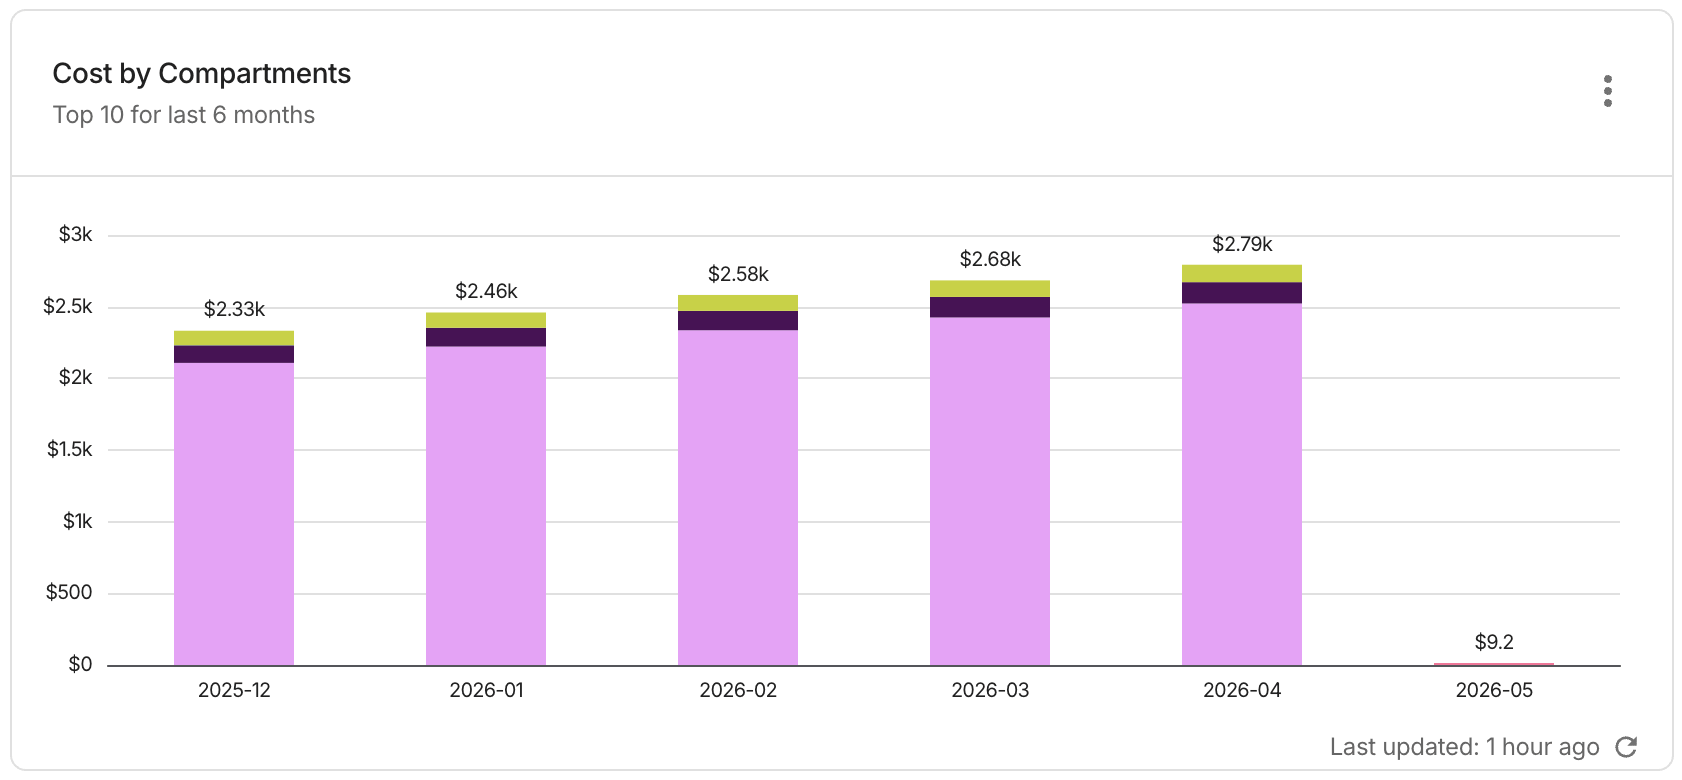
レポート設定:
- Metrics: Cost
- Time Range: Last 6 months(今月を含む)
- Time Interval: Month
- Filter results: Provider が
Oracle Cloud - Group by: Project/Account ID
Region

レポート設定:
- Metrics: Cost
- Time Range: Current month to date
- Filter results: Provider が
Oracle Cloud - Group by: Region