レポートを表示する
メインの Reports 画面でレポート名を選択するか、ダッシュボード上のレポートウィジェットを表示しているときに Open full report を選択すると、レポートを開くことができます。
このページでは、開いたレポートを表示するときによく行う操作について説明します。
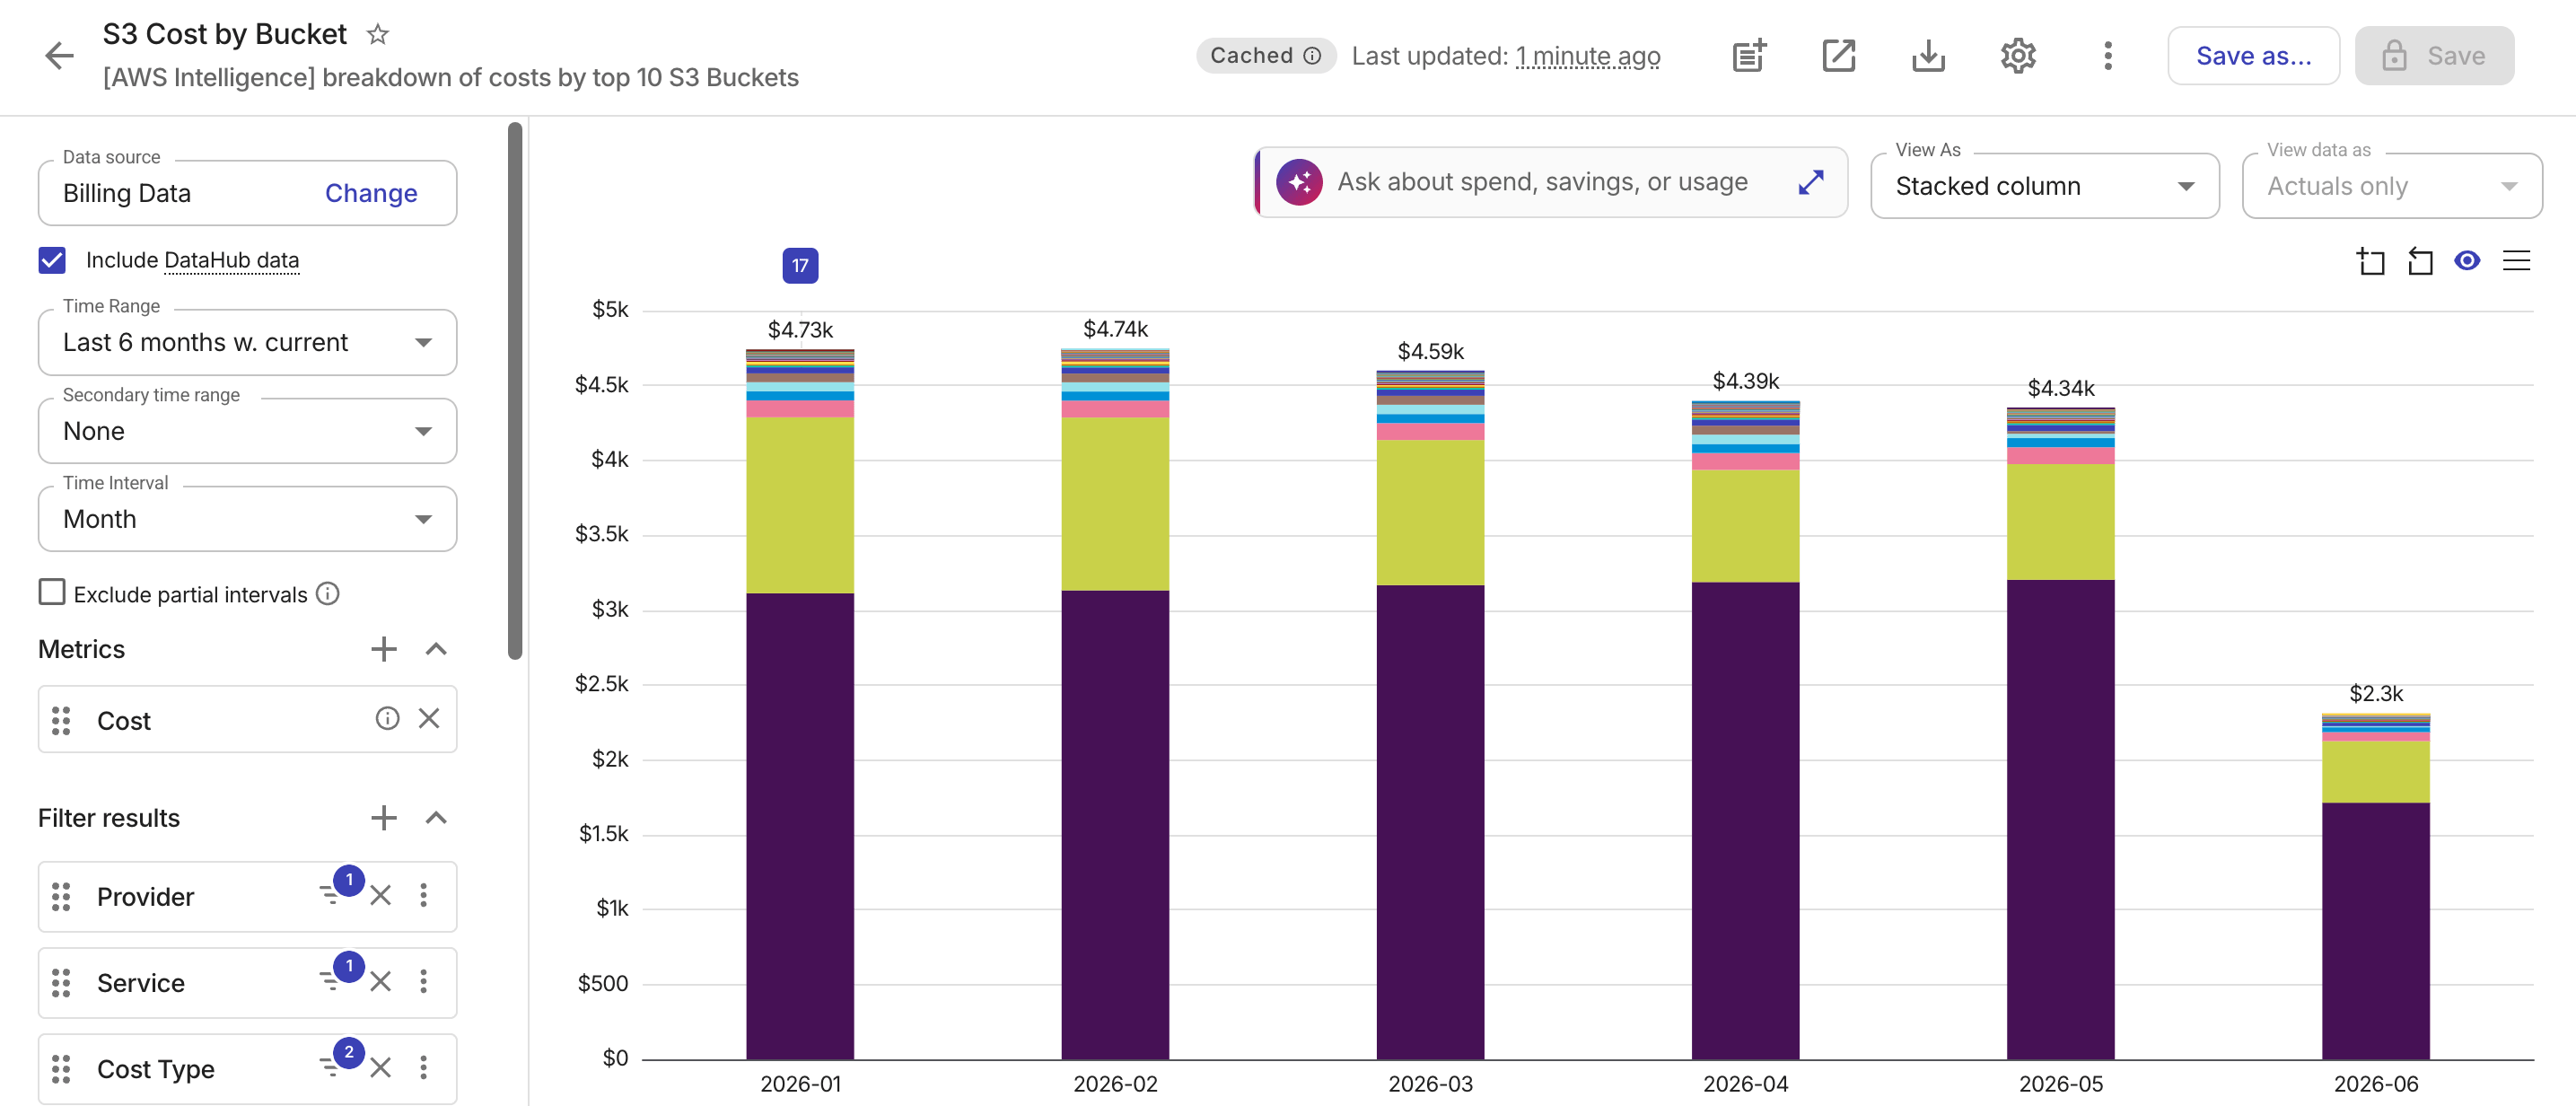
レポートタイトルバーのケバブメニュー(⋮)を選択し、Report configuration を選択すると、レポートの詳細を表示できます。
テーブル内を検索する
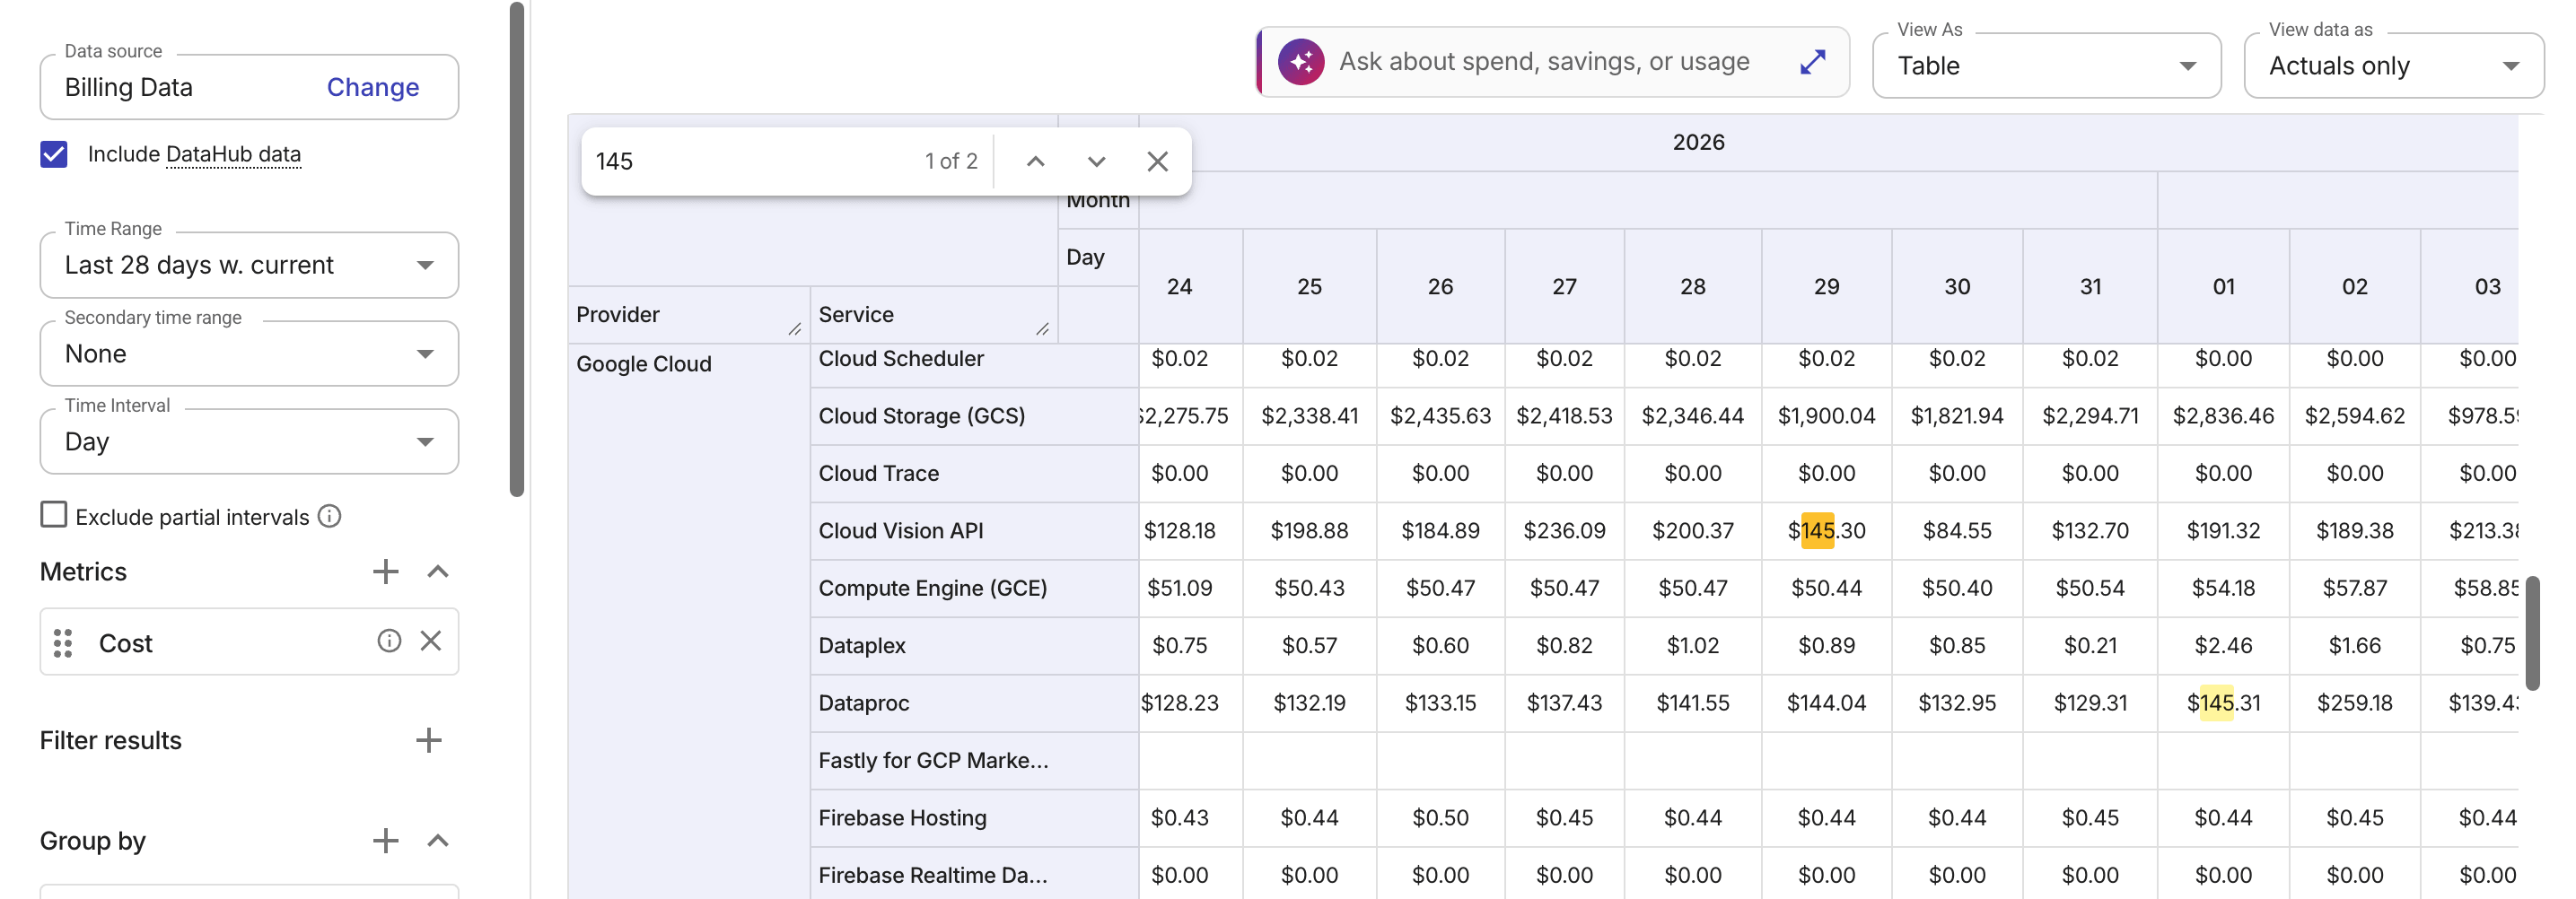
最適なパフォーマンスを確保するため、テーブルレポート(Table と Heatmap)は、画面に現在表示されている行とセルのみをレンダリングします。標準的なブラウザの検索では未レンダリングの行を検出できないため、ボリュームの多い分析レポートで特定の値を見つけるには手動でスクロールする必要があり、現実的ではない場合があります。
コンソールでは、標準の Ctrl+F および Cmd+F ショートカットを拡張し、カスタムのグローバル検索を提供します。これにより、行が画面外で非表示になっている場合でも、テーブル全体を対象に検索できます。
-
検索は、ディメンションラベル列とメトリック値列の両方を走査します。
-
検索は大文字と小文字を区別せず、セル内の任意の部分文字列に一致します。
-
検索は、生データではなく、画面に表示されているフォーマット済みの値に対して実行されます。
シリーズの合計
レポートの表示形式として折れ線・棒グラフ(bar and column charts と trend and time-series charts)を使用している場合、チャート領域右上のメニューアイコン(
)を選択し、Show totals panel を選択すると、チャートの横にシリーズの合計パネルを表示できます。これにより、チャートビューから離れることなく、個々の寄与度を比較できます。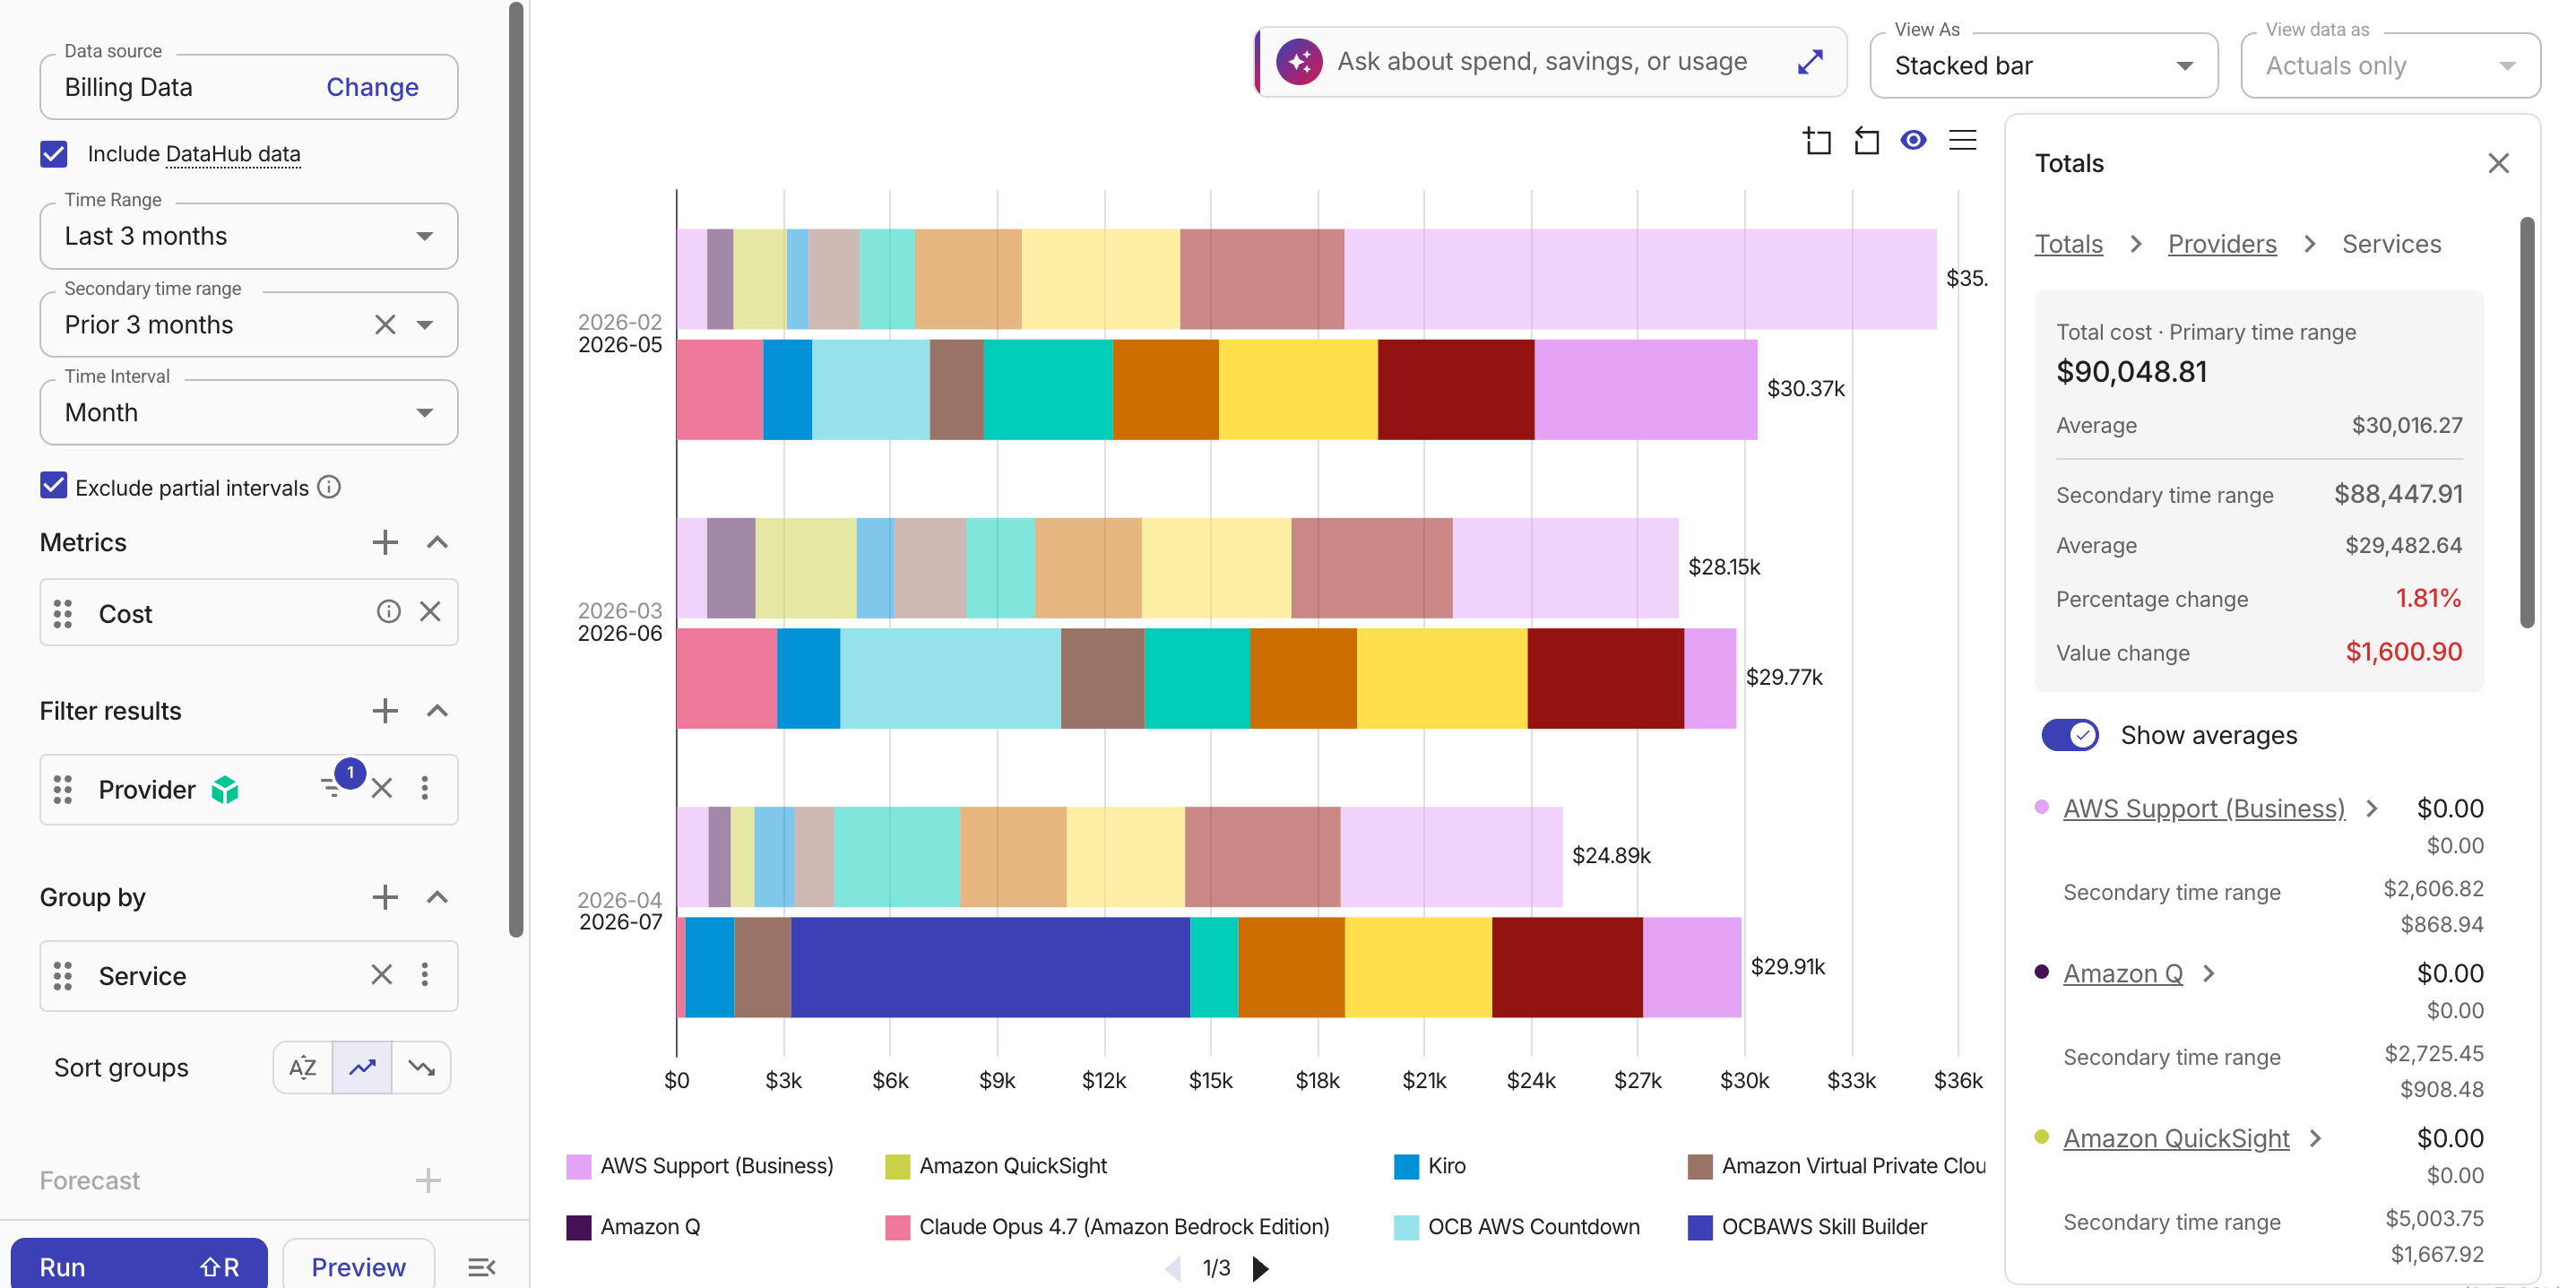
パネルには、表示されているすべてのシリーズ値の合計が表示されます。
-
各シリーズは、その色のインジケーターと合計値とともに一覧表示されます。レポートでグループ化されたディメンションを使用している場合、シリーズはサブトータルを表示する折りたたみ可能なグループに整理されます。
-
レポートで比較時間範囲を使用している場合、各メトリックについて、プライマリ時間範囲とセカンダリー時間範囲の合計、および 2 つの範囲間の変化パーセンテージと値の変更が表示されます。
-
レポートに複数のメトリクスが含まれている場合、各メトリックは個別の折りたたみ可能なセクションとして表示されます。
-
パネル内の Show averages トグルを使用して、各シリーズについて、チャートの各期間あたりの平均値を表示できます。平均値は、表示範囲に 2 期間以上が含まれている場合に利用でき、ズーム操作に応じて自動的に更新されます。
-
データの一部にズームインすると、パネルは表示範囲のみを反映するように合計値を再計算します。
-
レポートがダッシュボードウィジェットとして表示されている場合や、エクスポート中は、合計パネルは使用できません。
パネルを非表示にするには、チャートのメニューアイコンを再度選択し、Hide totals panel を選択してください。
選択した範囲全体のスタック全体の統計や、積み上げ縦棒グラフで 2 つの期間を比較する場合は、Report statistics を使用してください。
レポートチャートをドリルダウンする
レポートが以下のすべての条件を満たす場合、レポートから直接ドリルダウンして、請求ディメンション(Provider > Service > SKU)に沿った固定パスに従いながら、詳細レベルを段階的に深めてコストデータを調査できます。
-
レポートが Billing Data データソースを使用している。
-
レポートがデータを表示する形式として折れ線・棒グラフ(bar and column charts と trend and time-series charts)を使用している。
-
レポートが、ドリルダウン階層内のディメンションでデータをグループ化している。
-
レポートにメトリックが 1 つだけ設定されており、セカンダリー時間範囲が設定されていない。
デフォルトの集計ビューである Totals から開始し、次のいずれかの方法でドリルダウンできます。
-
棒・縦棒・折れ線のポイント・エリアセグメントを選択して、その値にドリルダウンします。
-
チャート要素を右クリックし、Drill down by
dimensionを選択します。 -
合計パネルを開き、Drill down by provider を選択するか、下位レベルで個々のシリーズ値を選択します。
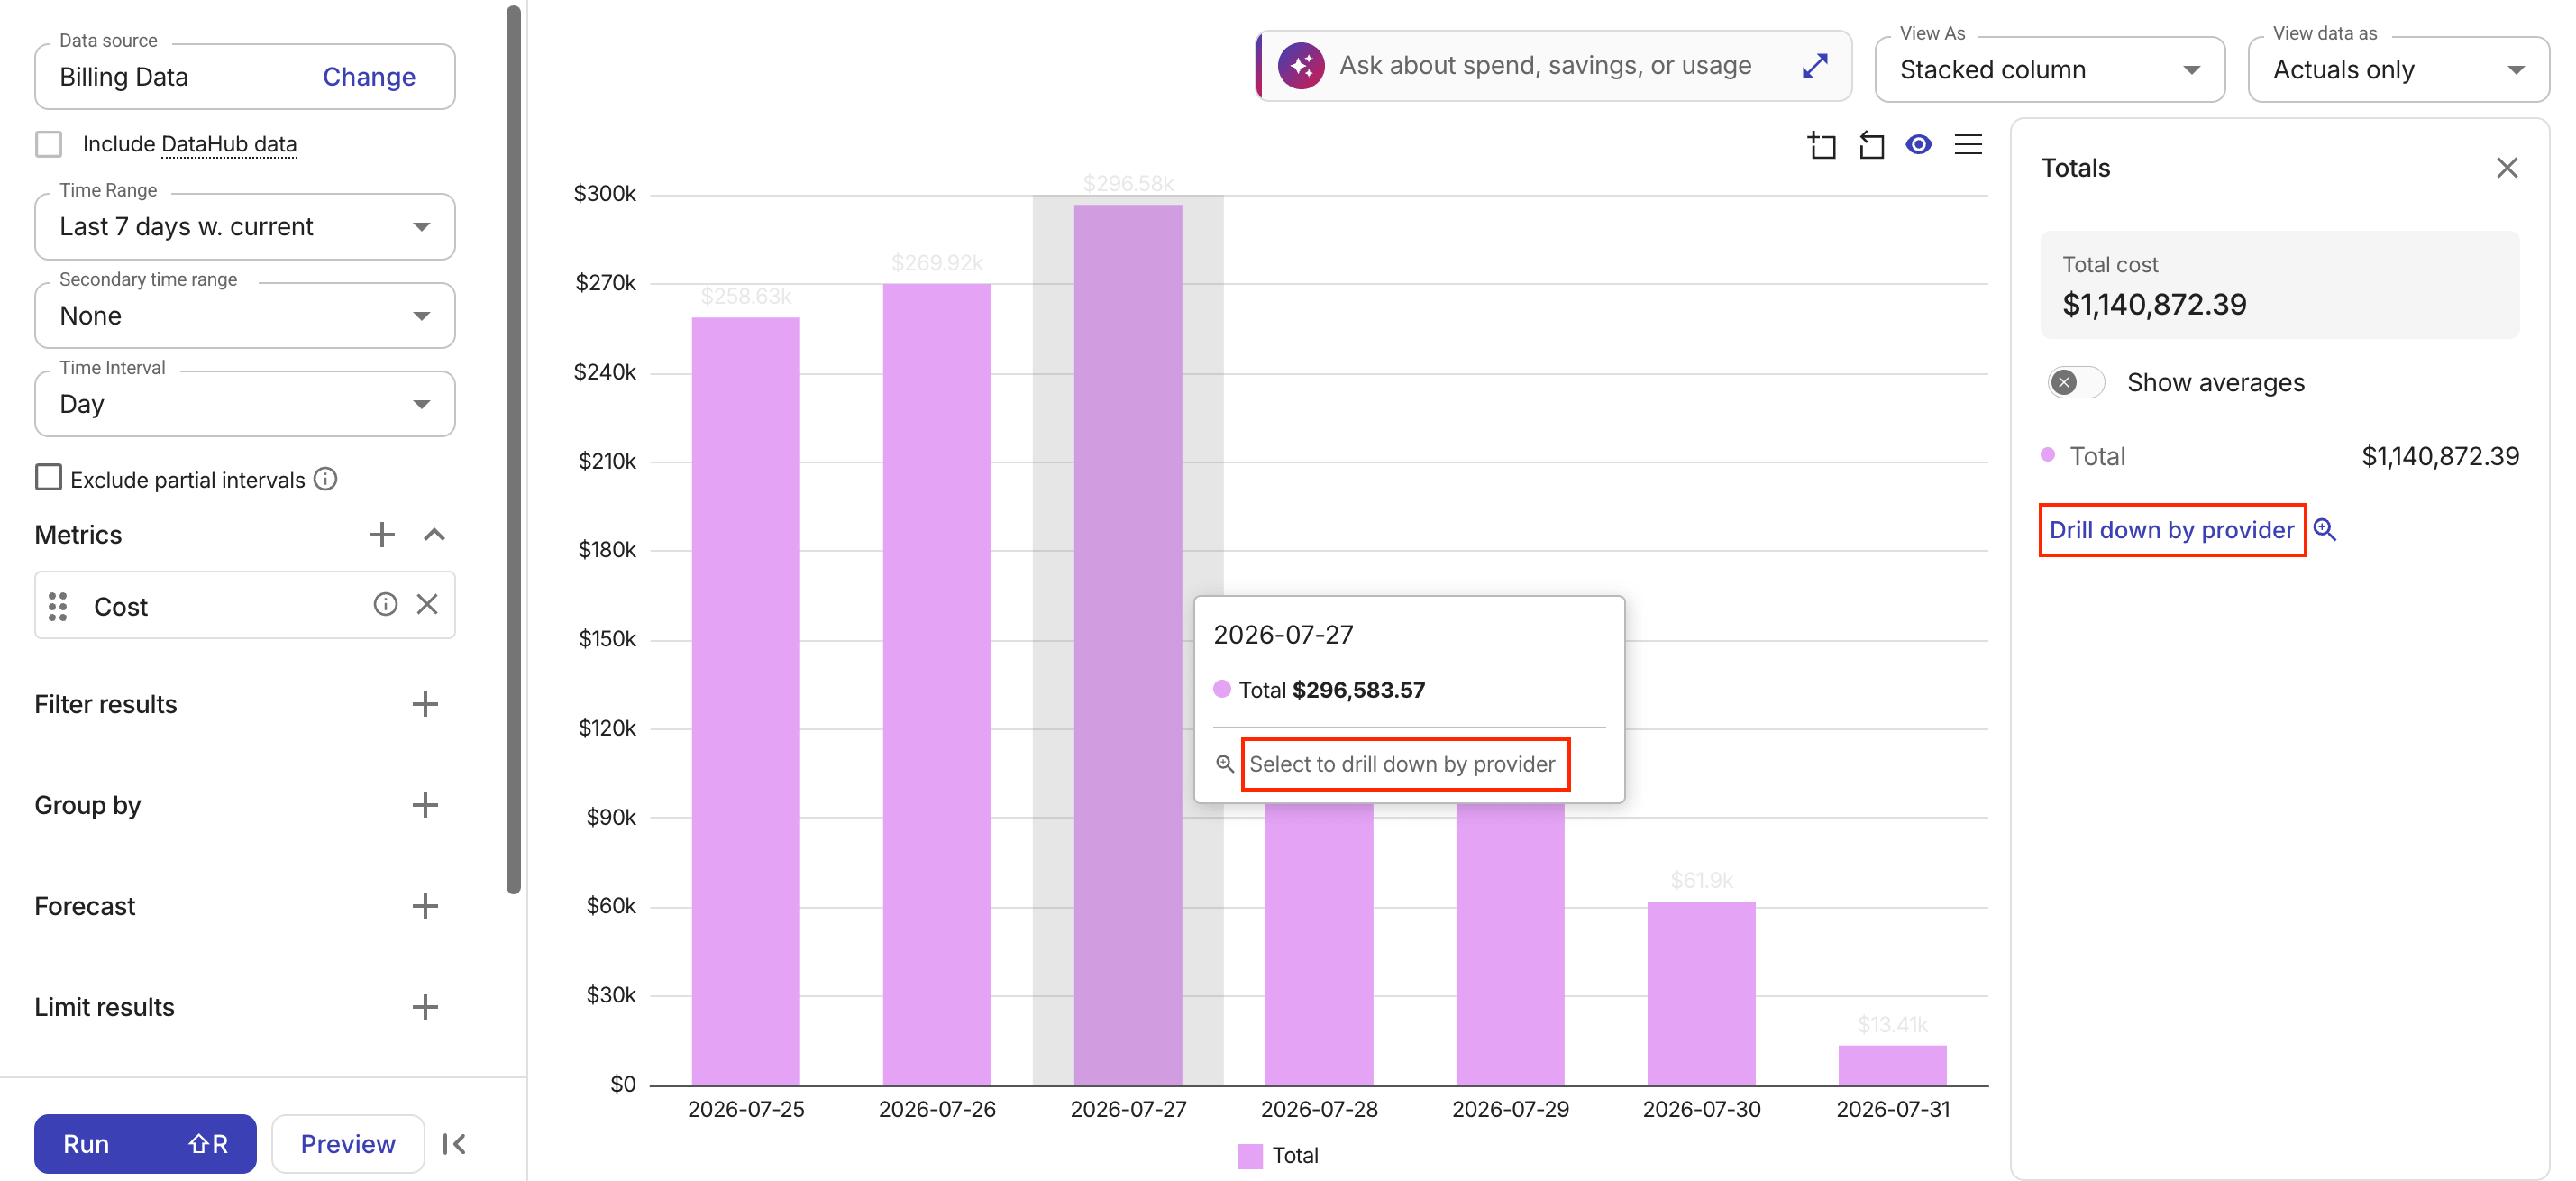
各レベルでは、選択内容に基づいてレポートがその値にフィルタされ、階層内の次のディメンションでコストが再グループ化されます。
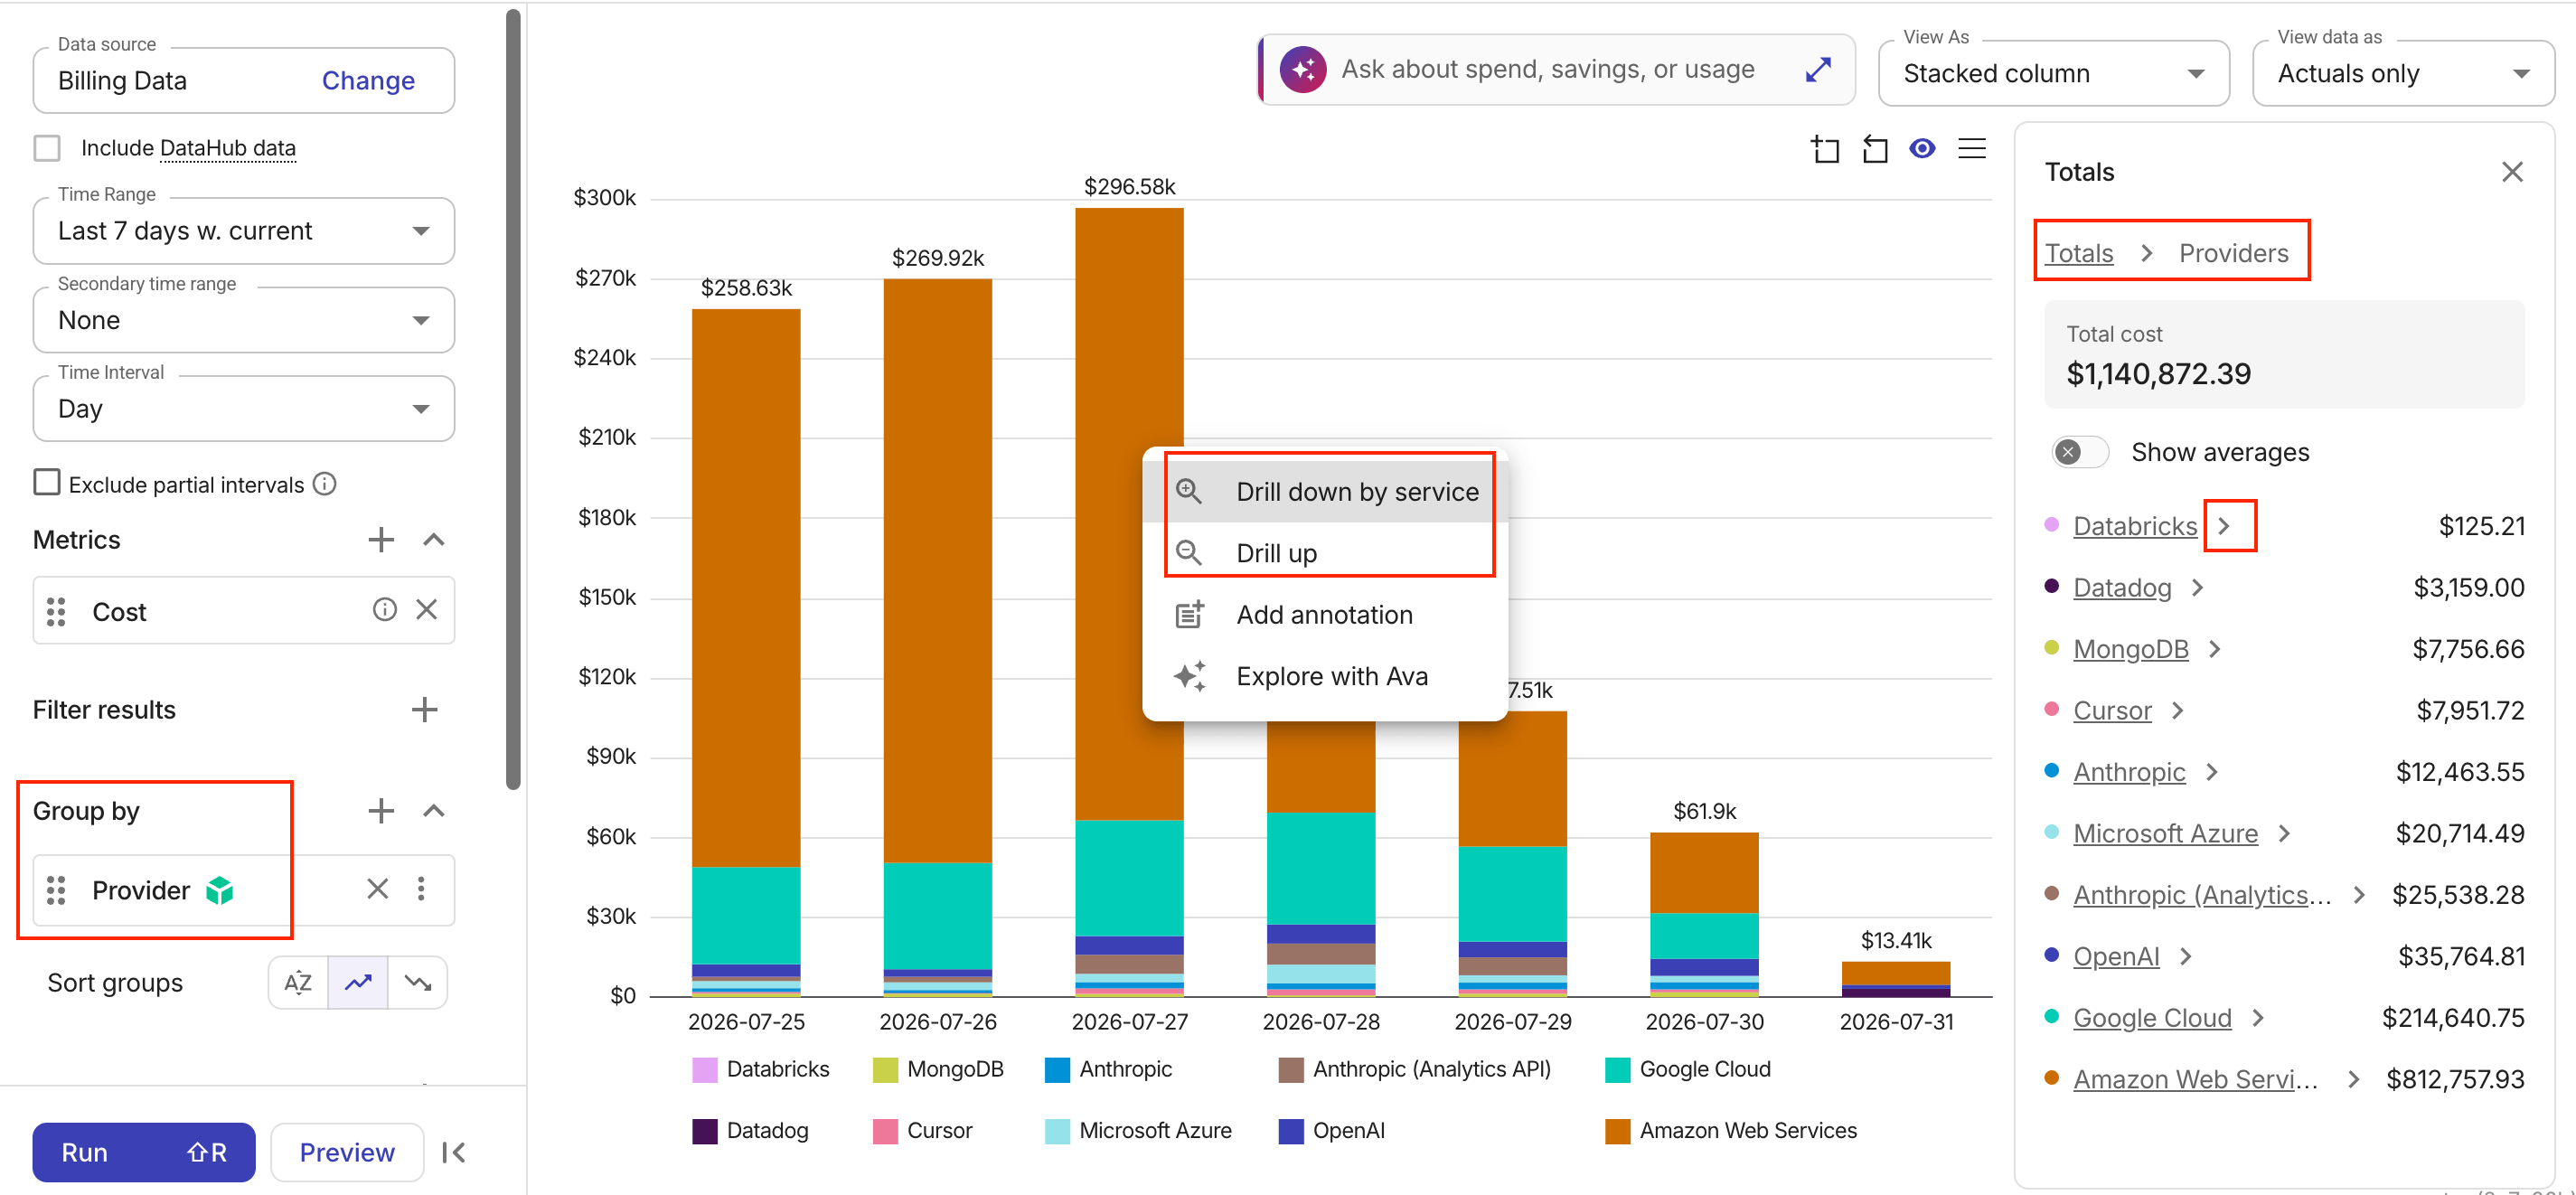
前のレベルに戻るには、合計パネルのパンくずリストから目的のレベルを選択して直接移動するか、チャートを右クリックして Drill up を選択し、1 レベル戻ります。
ダッシュボード上のレポートウィジェットでも同じドリルダウンがサポートされており、パンくずリストはウィジェット上に表示されます。詳しくは、Drill down into report widgets を参照してください。
コンパクトモード
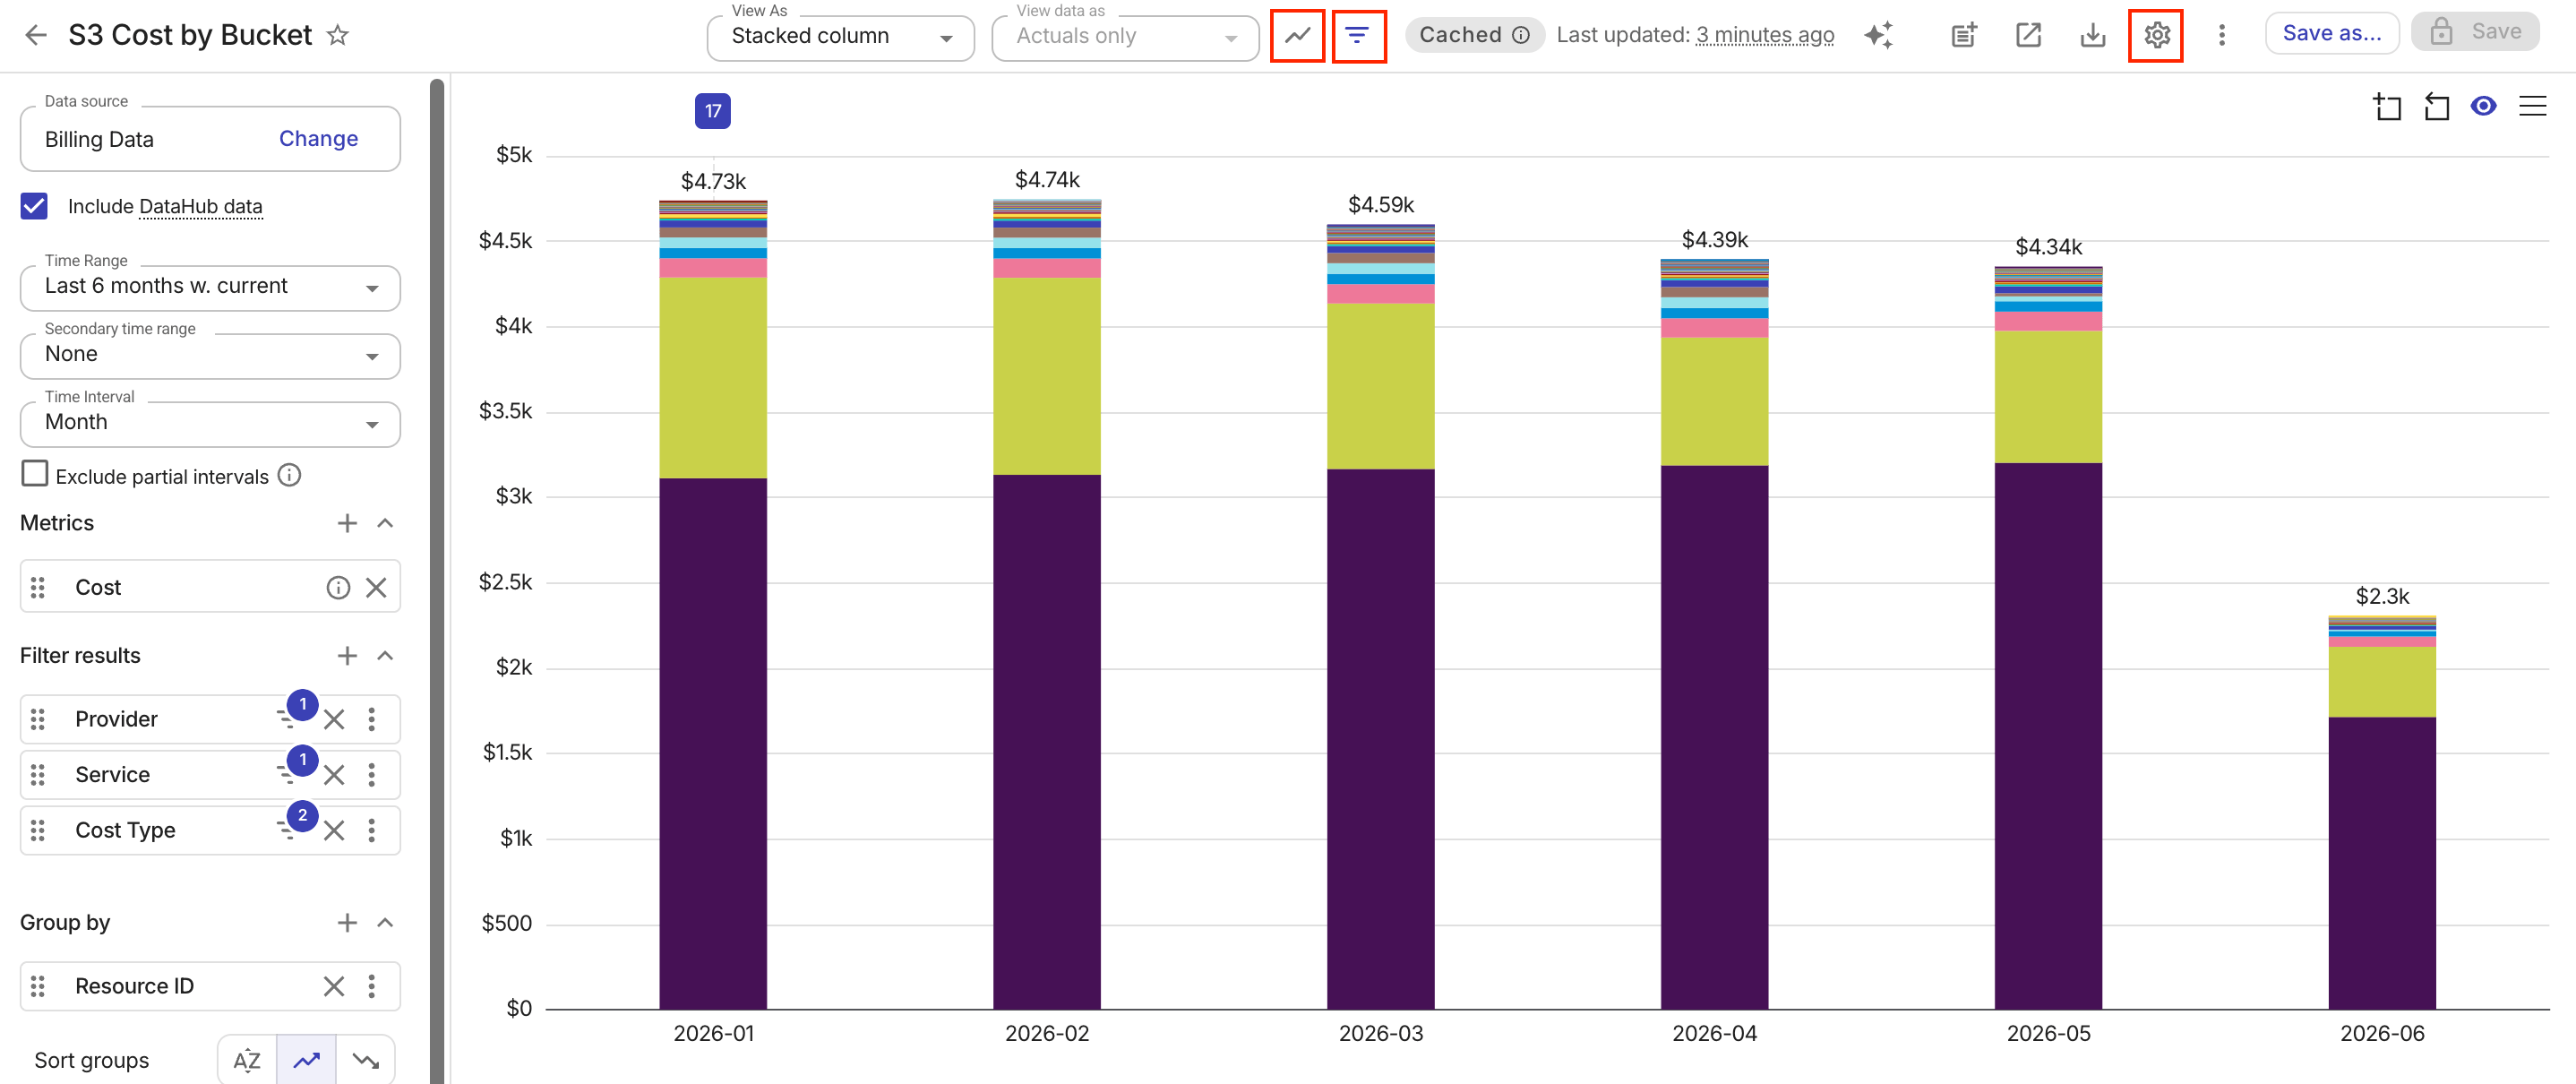
Compact UI が有効な場合、レポートはより小さいタイポグラフィ、狭いスペーシング、および幅の狭いサイドパネルを使用し、チャートとテーブルのためのスペースを最大化します。
コンパクトモードでも、すべてのレポート設定オプションは利用可能ですが、一部は別の場所に移動します。
-
Forecast と Limit results は、ツールバー内のアイコンボタンとして表示されます。
-
Advanced options は、Report Settings(歯車)ダイアログ内に移動します。