マルチメトリクスレポート
同じレポート内で複数のメトリクスを使用することで、複数のレポートを切り替えることなく、データをコンテキストとともに把握できます。
制限事項
-
1 つのレポートに追加できるメトリクスは最大 4 つで、基本メトリクス・カスタムメトリクス・拡張メトリクスを任意の組み合わせで利用できます。
-
マルチメトリクスレポートでは、次のオプションは利用不可です。
-
表示形式:Heatmap・ヒートマップ(行)・ヒートマップ(列)・ツリーマップ・Sankey チャート
レポート例
以下は、マルチメトリクスレポートの代表的な利用例です。
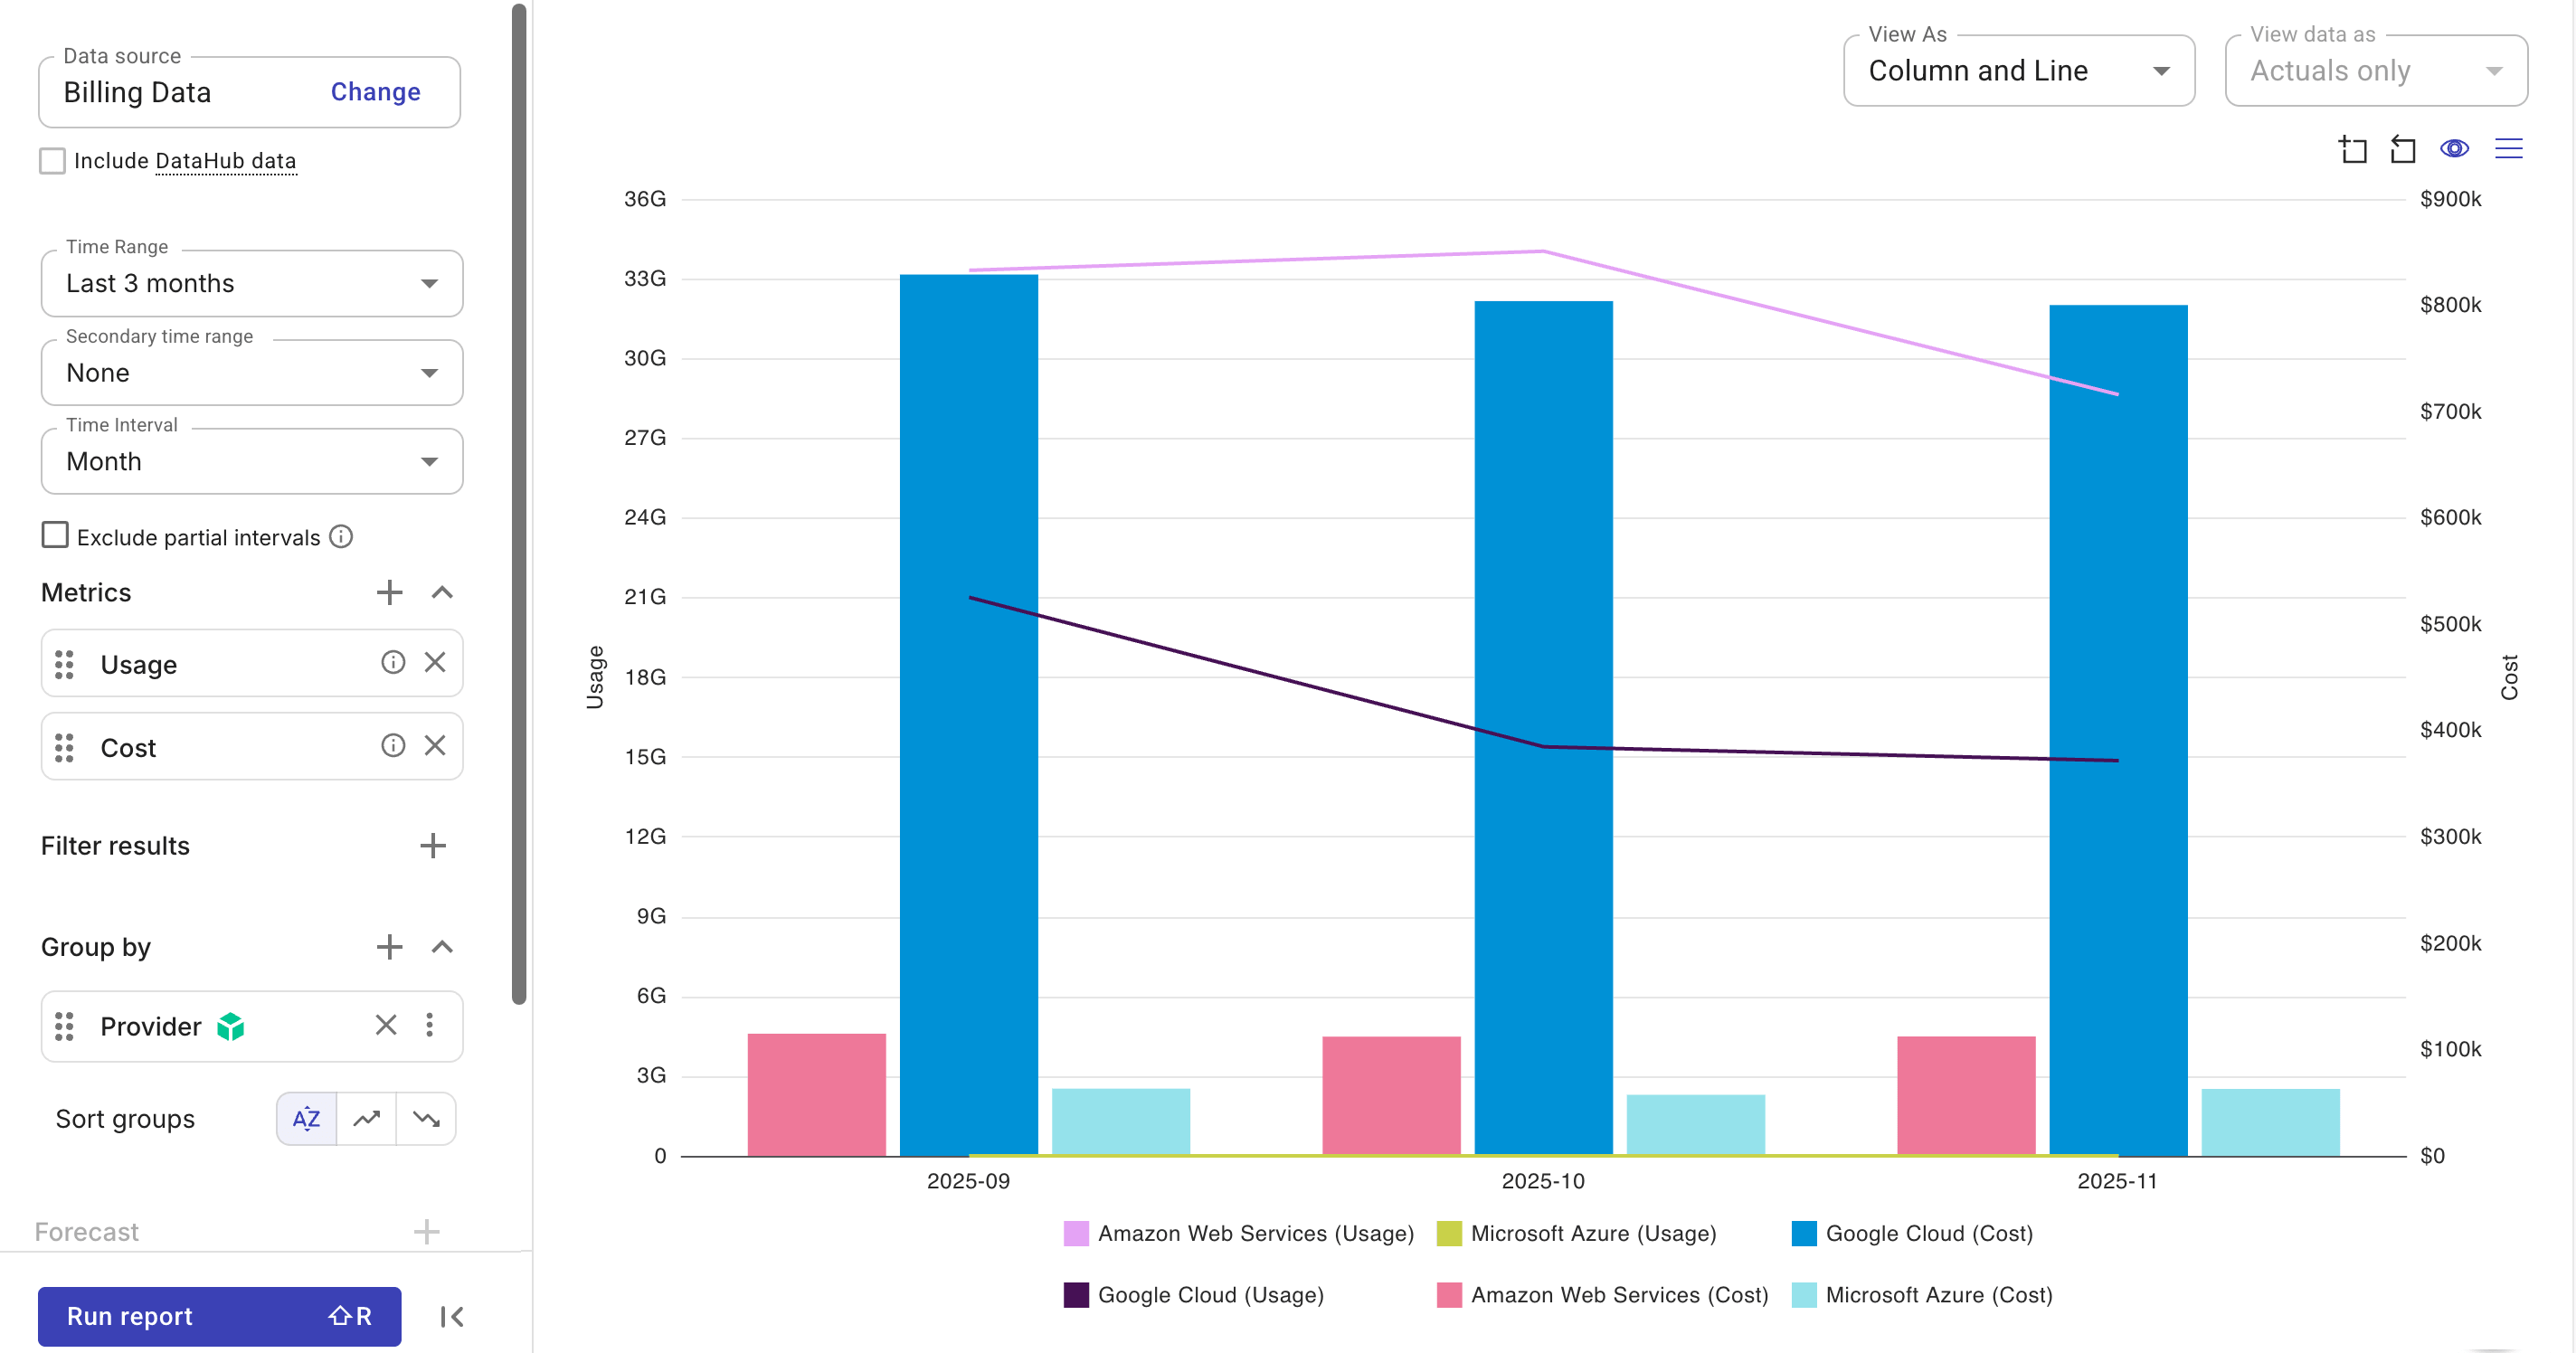
Usage と Cost
この例では 2 つの基本メトリクス Usage と Cost を使用し、消費量がどのように金銭的なインパクトに結びつくかを把握できるようにしています。
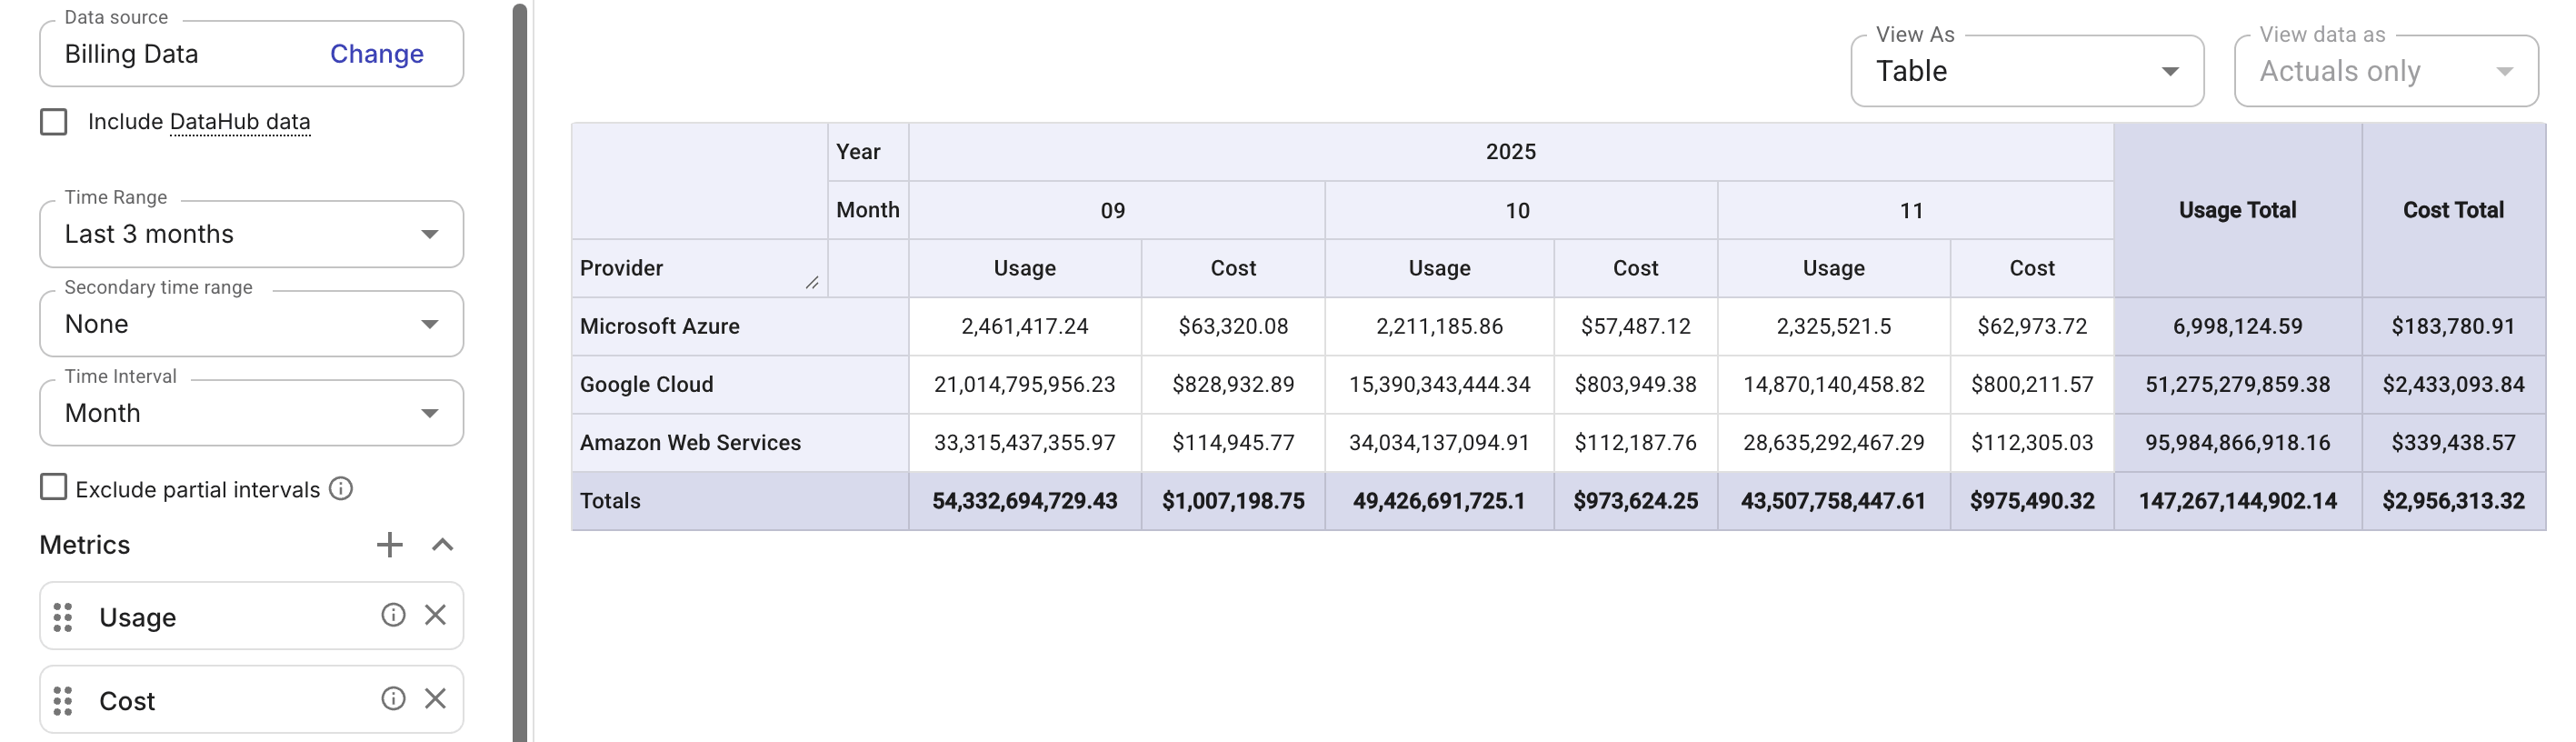
また、メトリクス間の関係やトレンドをより直感的に可視化するために、カラムとライン 表示に切り替えることもできます。
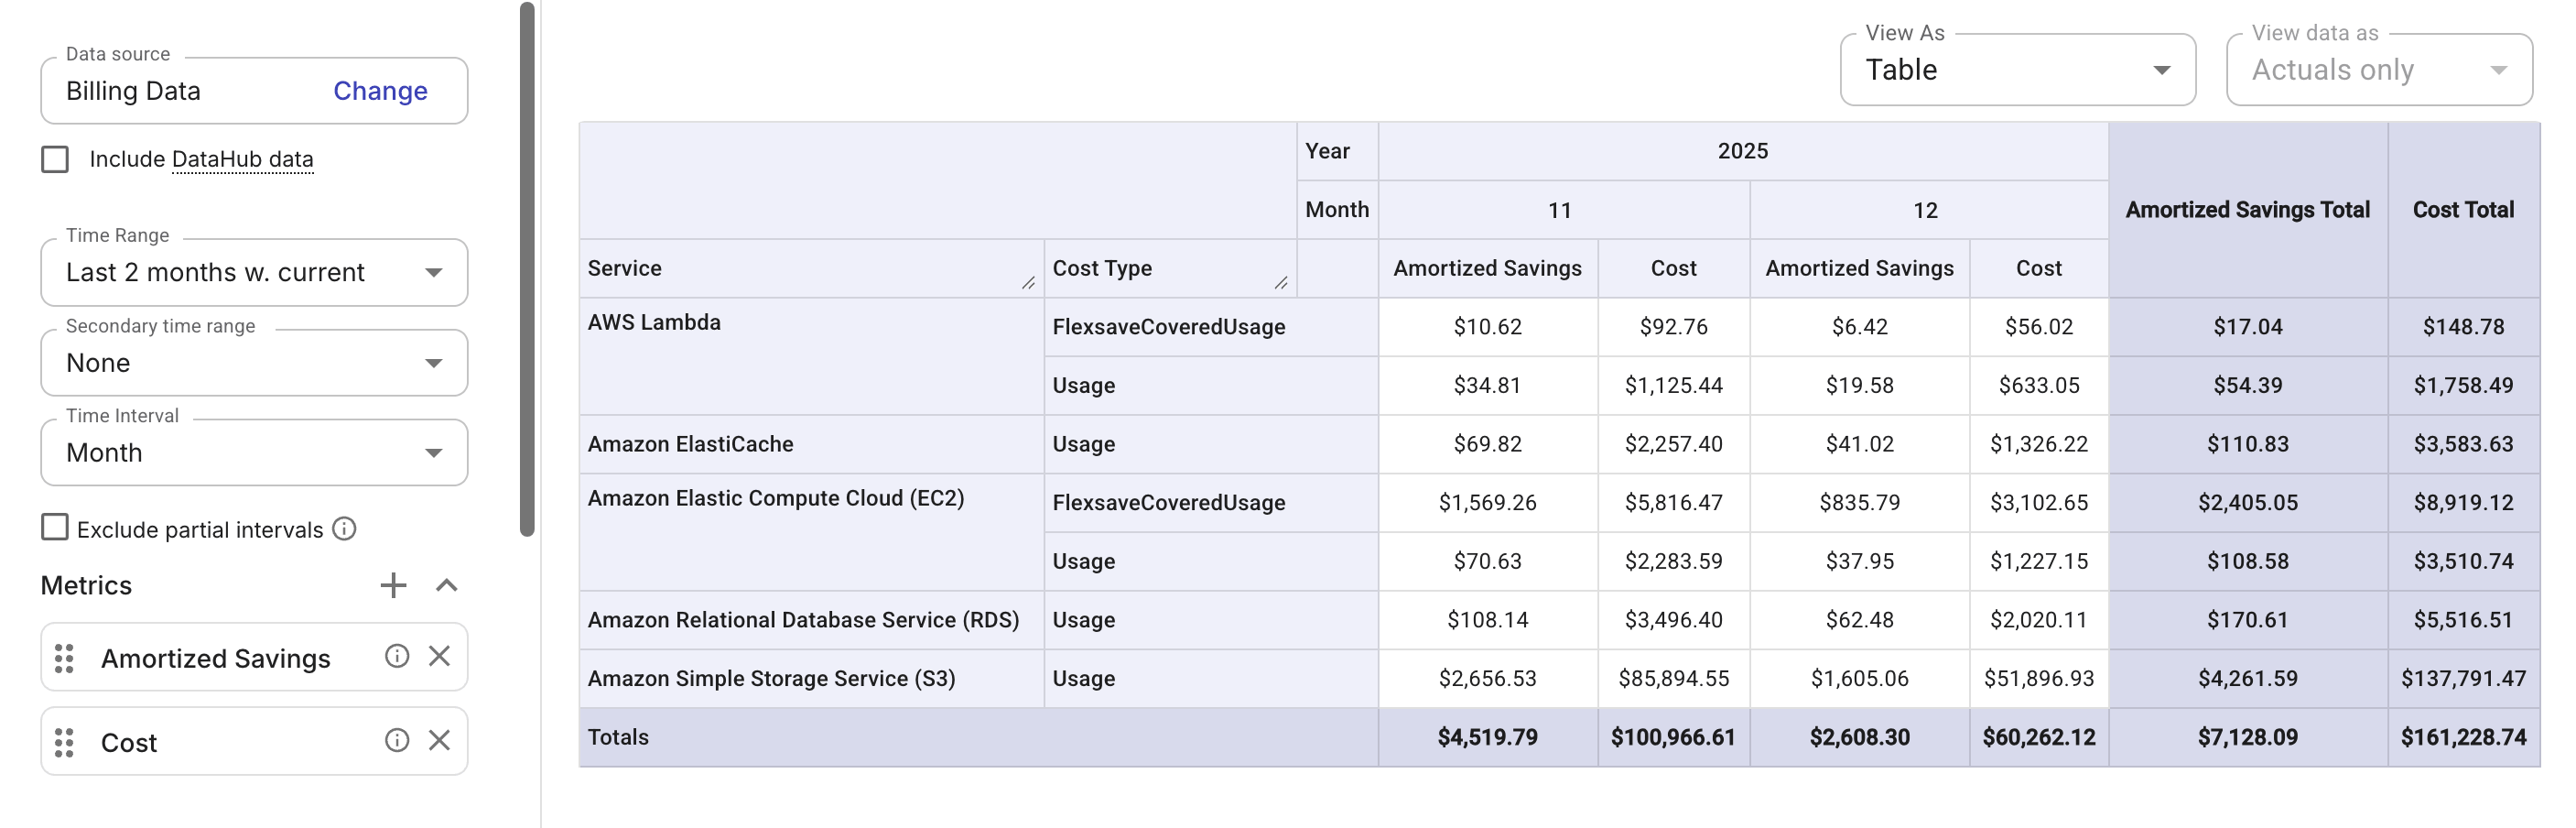
Amortized savings と Cost
この例では、拡張メトリクス Amortized savings と基本メトリクス Cost を使用し、AWS の償却データを請求データのコストと並べて表示します。
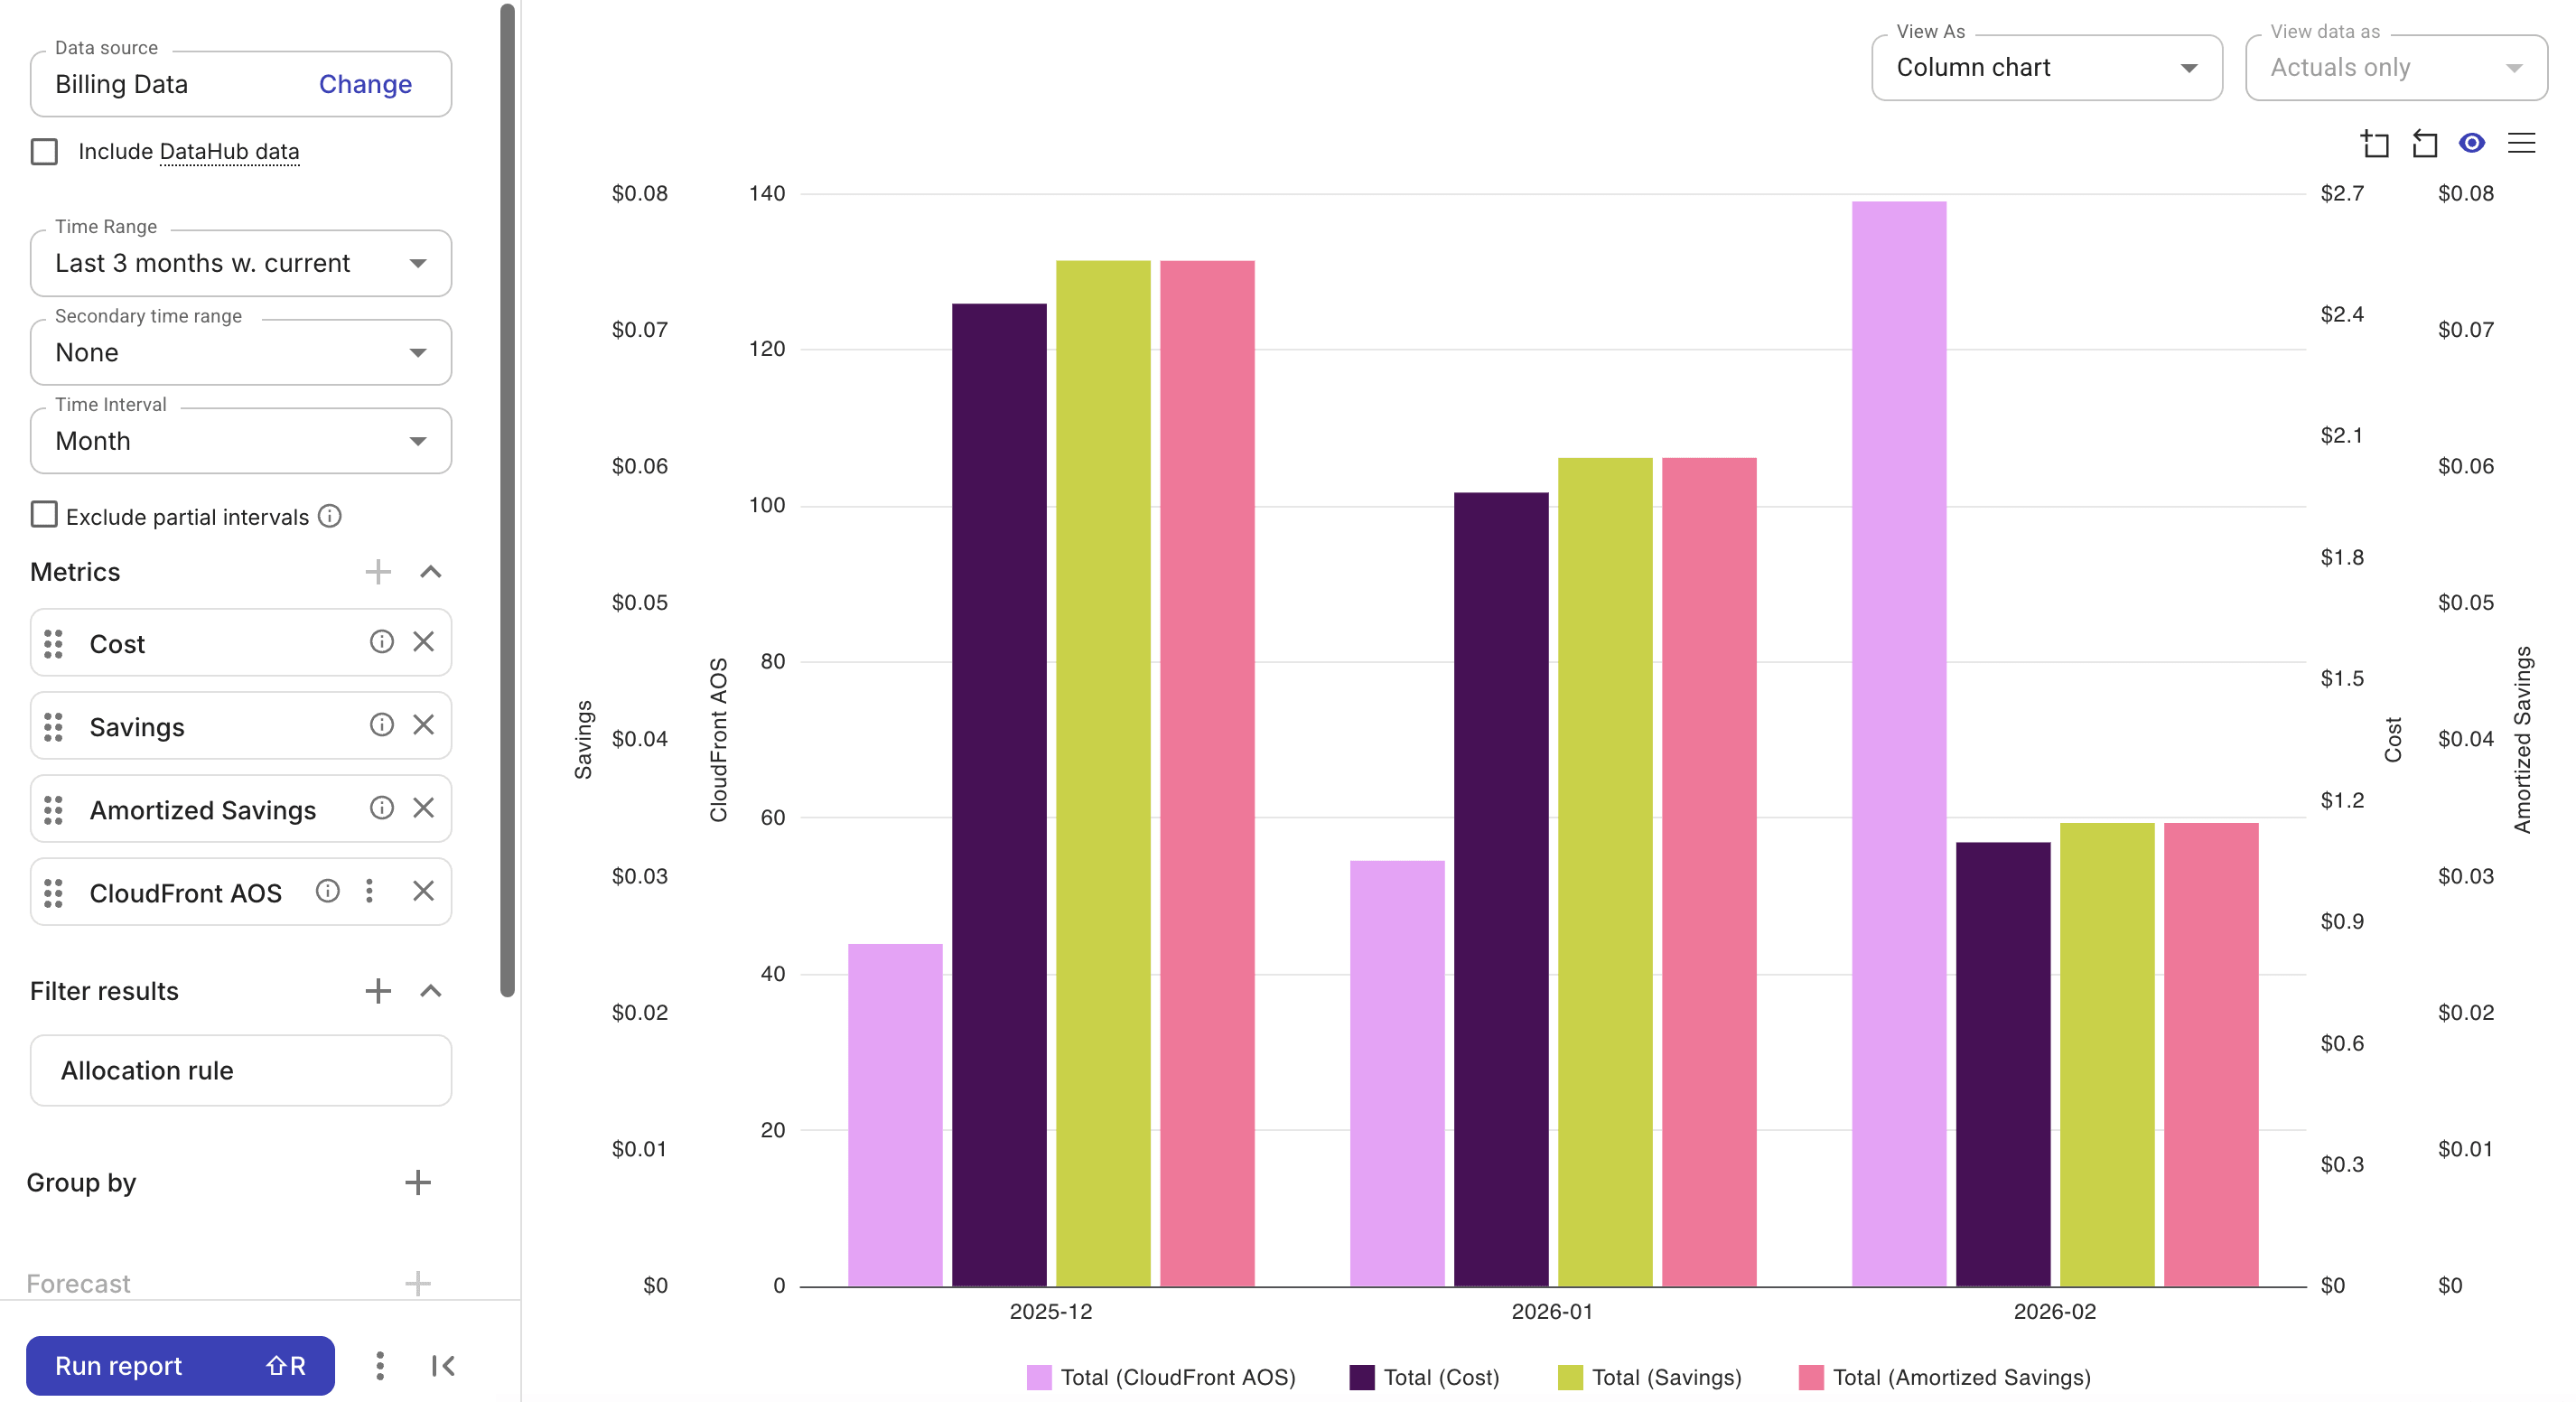
カスタムメトリクス
この例では、3 種類のメトリクスを組み合わせています。1 つのカスタムメトリクス(CloudFront AOS)、2 つの基本メトリクス(Cost、Savings)、そして 1 つの拡張メトリクス(Amortized savings)です。
カスタムメトリクスを定義するアロケーションルールは、そのメトリクスがレポートに追加されたタイミングで自動的にレポートに適用され(カスタムメトリクスが削除された場合のみ削除されます)、複数のカスタムメトリクスを含むレポートでは、各カスタムメトリクスに必要なアロケーションルールの和集合でフィルタされます。