レポート表示のカスタマイズ
DoiT Cloud Analytics(クラウド分析)では、カラーテーマ、フォントサイズ、��数値の書式設定など、レポート表示のカスタマイズをサポートしています。
表示設定
表示設定では、基になるデータを変更することなく、Cloud Analytics レポートの見た目を制御できます。カラーテーマを適用したり、チャートラベルのフォントサイズを調整したり、数値の書式設定方法を選択したりできます。
表示設定はユーザー単位で保存されます。お客様の設定が他のユーザーに影響することはありません。
必要な権限
- Cloud Analytics User
レポート表示設定を変更する
特定のレポートの表示設定を変更するには、次の手順に従ってください。
-
DoiT コンソール にサインインし、上部ナビゲーションのメガメニューから Reporting and analytics > Reports を選択します。
-
既存のレポートを開くか、新しいレポートを作成します。
-
レポートのアクシ�ョンバーで、Display Settings アイコン (
) を選択します。 -
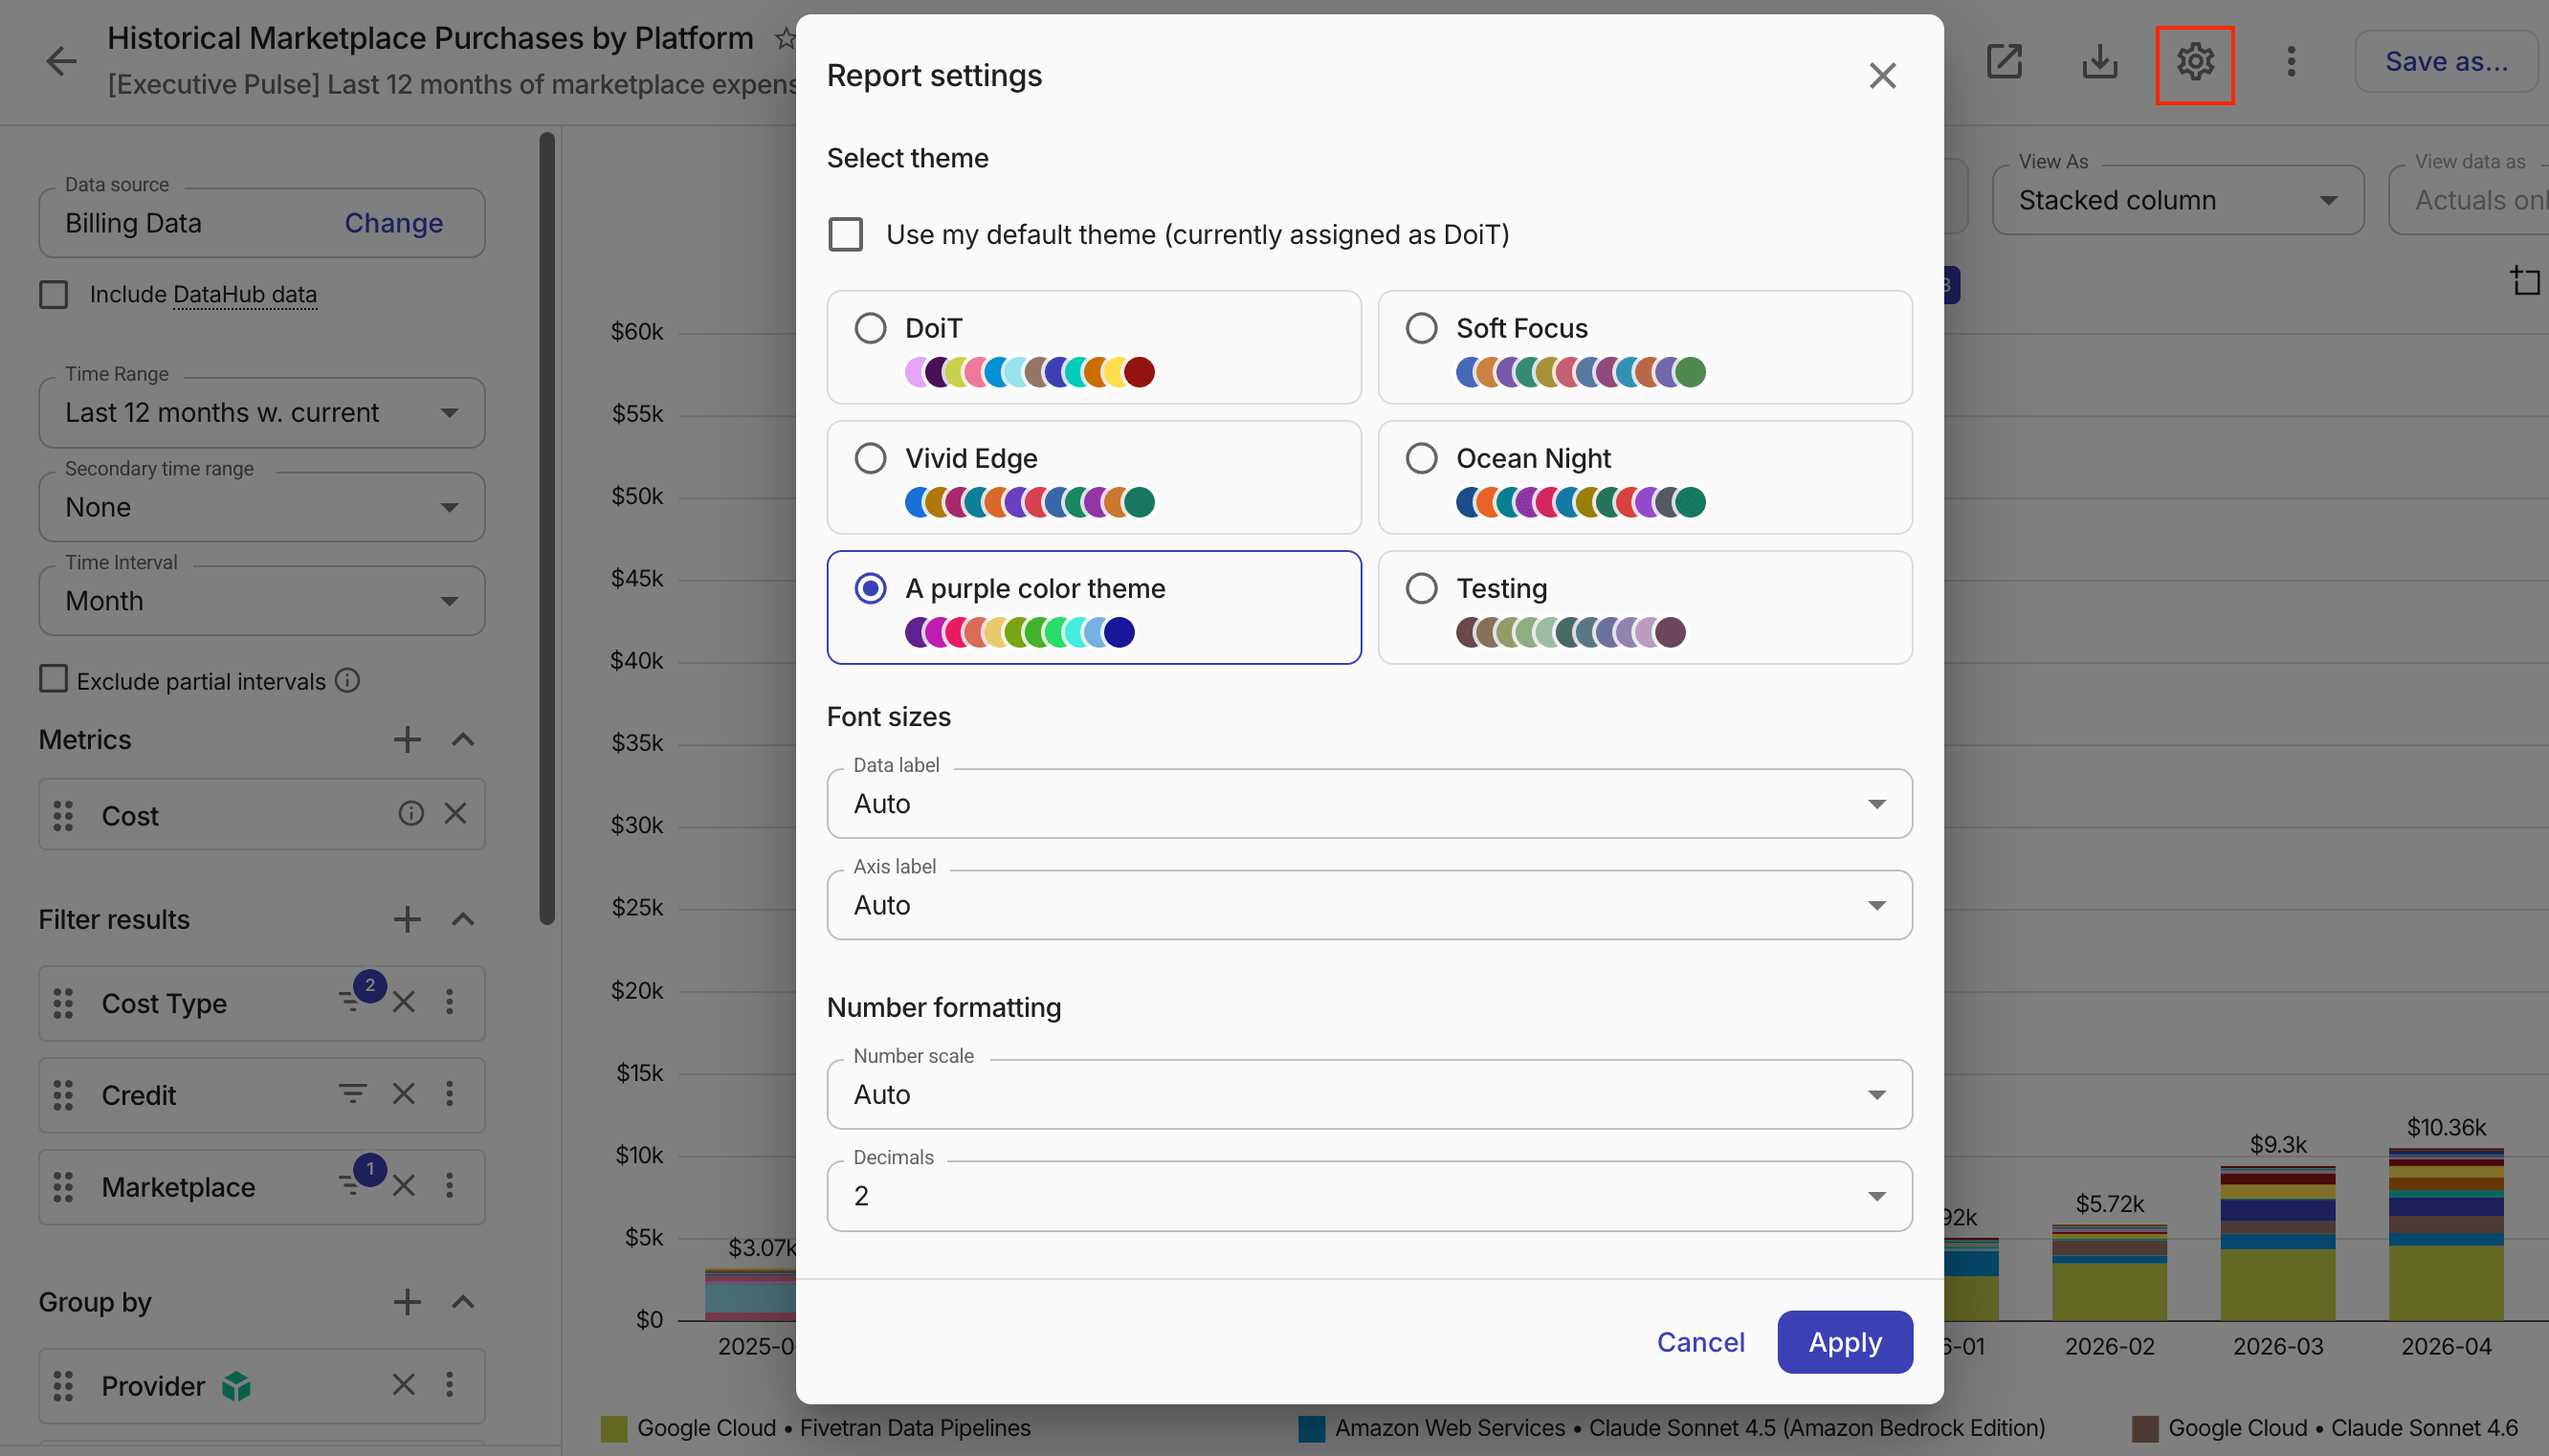
カラーテーマ、フォントサイズ、数値の書式設定を確認・調整します(Compact mode の場合は、Advanced options も Report settings ダイアログに表示されます)。
-
Select theme: チャート系列(棒、線、面、その他の視覚要素)のカラーテーマです。あらかじめ用意されたプリセットまたはカスタムテーマを選択できます。
-
プリセットテーマ: 各プリセットには、DoiT コンソールのテーマに基づいて自動的に適用される、ライトモードとダークモード用のパレットが用意されています。
- DoiT: 標準の DoiT カラーパレット。
- Soft Focus: 落ち着いた低コントラストのトーン。
- Vivid Edge: 高彩度で力強い色。
- Ocean Night: 深いブルーと暖色系のアクセントカラー。
-
カスタムテーマ: 組織内のお客様または他のユーザーによって作成されたカラーテーマです。詳細は「カスタムテーマを作成する」を参照してください。
-
-
Font sizes: データラベルおよび軸ラベルのフォントサイズです。
Auto(default): DoiT コンソールがチャートの複雑さとビューポートに基づきフォントサイズを自動的に決定します。Small、Medium、Large: 固定フォントサイズです。
-
Number formatting: テーブルおよびチャートラベルでのメトリクス値の表示方法です。
-
Number scale: 大きな数値の省略方法です。
Auto (default): データに最適なスケールを自動的に選択します。Thousands (K): 大きな数値を千単位に省略します(例: 45.2K)。Millions (M): 大きな数値を百万単位に省略します。Billions (B): 大きな数値を十億単位に省略します。Raw: 省略せずに完全な数値を表示します。
-
Decimals: メトリクス値に表示する小数点以下の桁数です。指定可能な値:
0~8。デフォルトは2です。
-
-
-
Apply を選択して新しい設定を適用します。
レポート設定
レポートレベルの設定に加えて、システムレベルでレポート設定を管理することもできます。
必要な権限
- Cloud Analytics Admin
既定のテーマを設定する
すべての新しいレポートとダッシュボードウィジェットに適用される既定のテーマを設定するには、次の手順に従ってください。
-
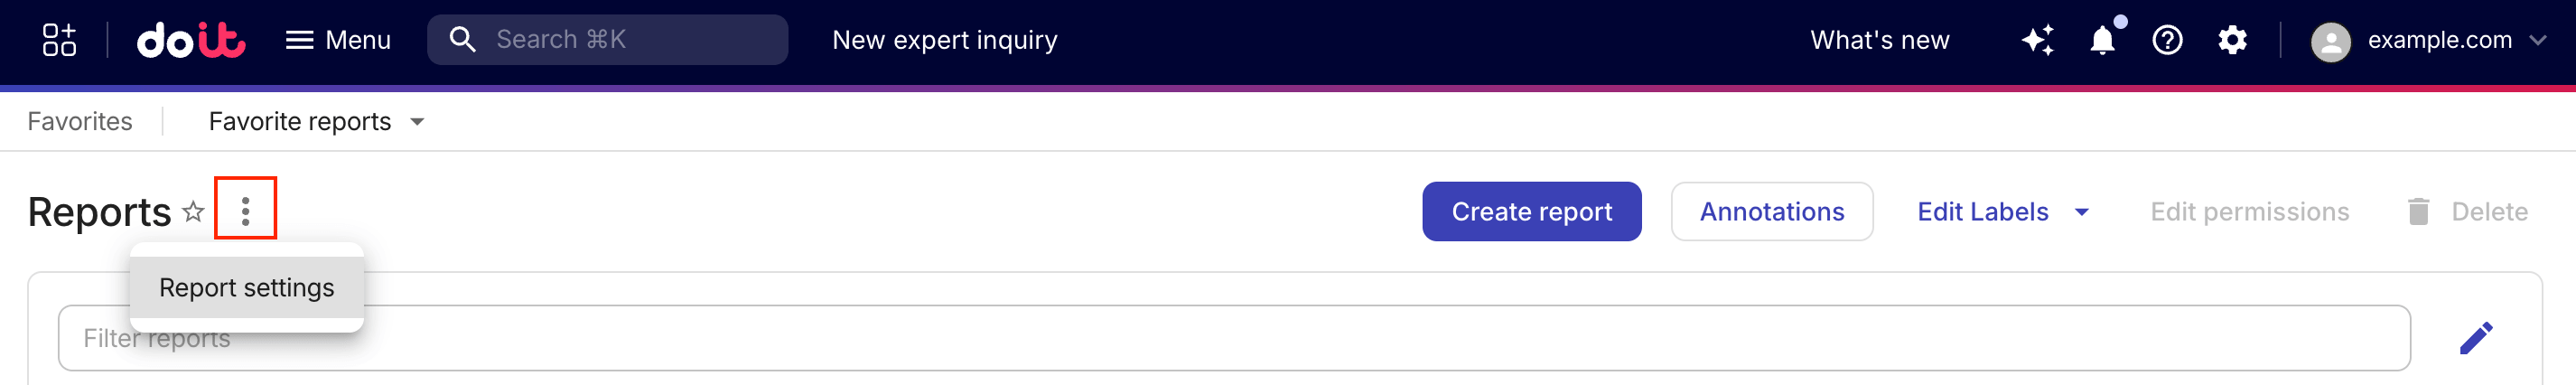
メインの Reports 画面で、ページヘッダー横のケバブメニュー(⋮)を選択し、Report settings を選択します。
-
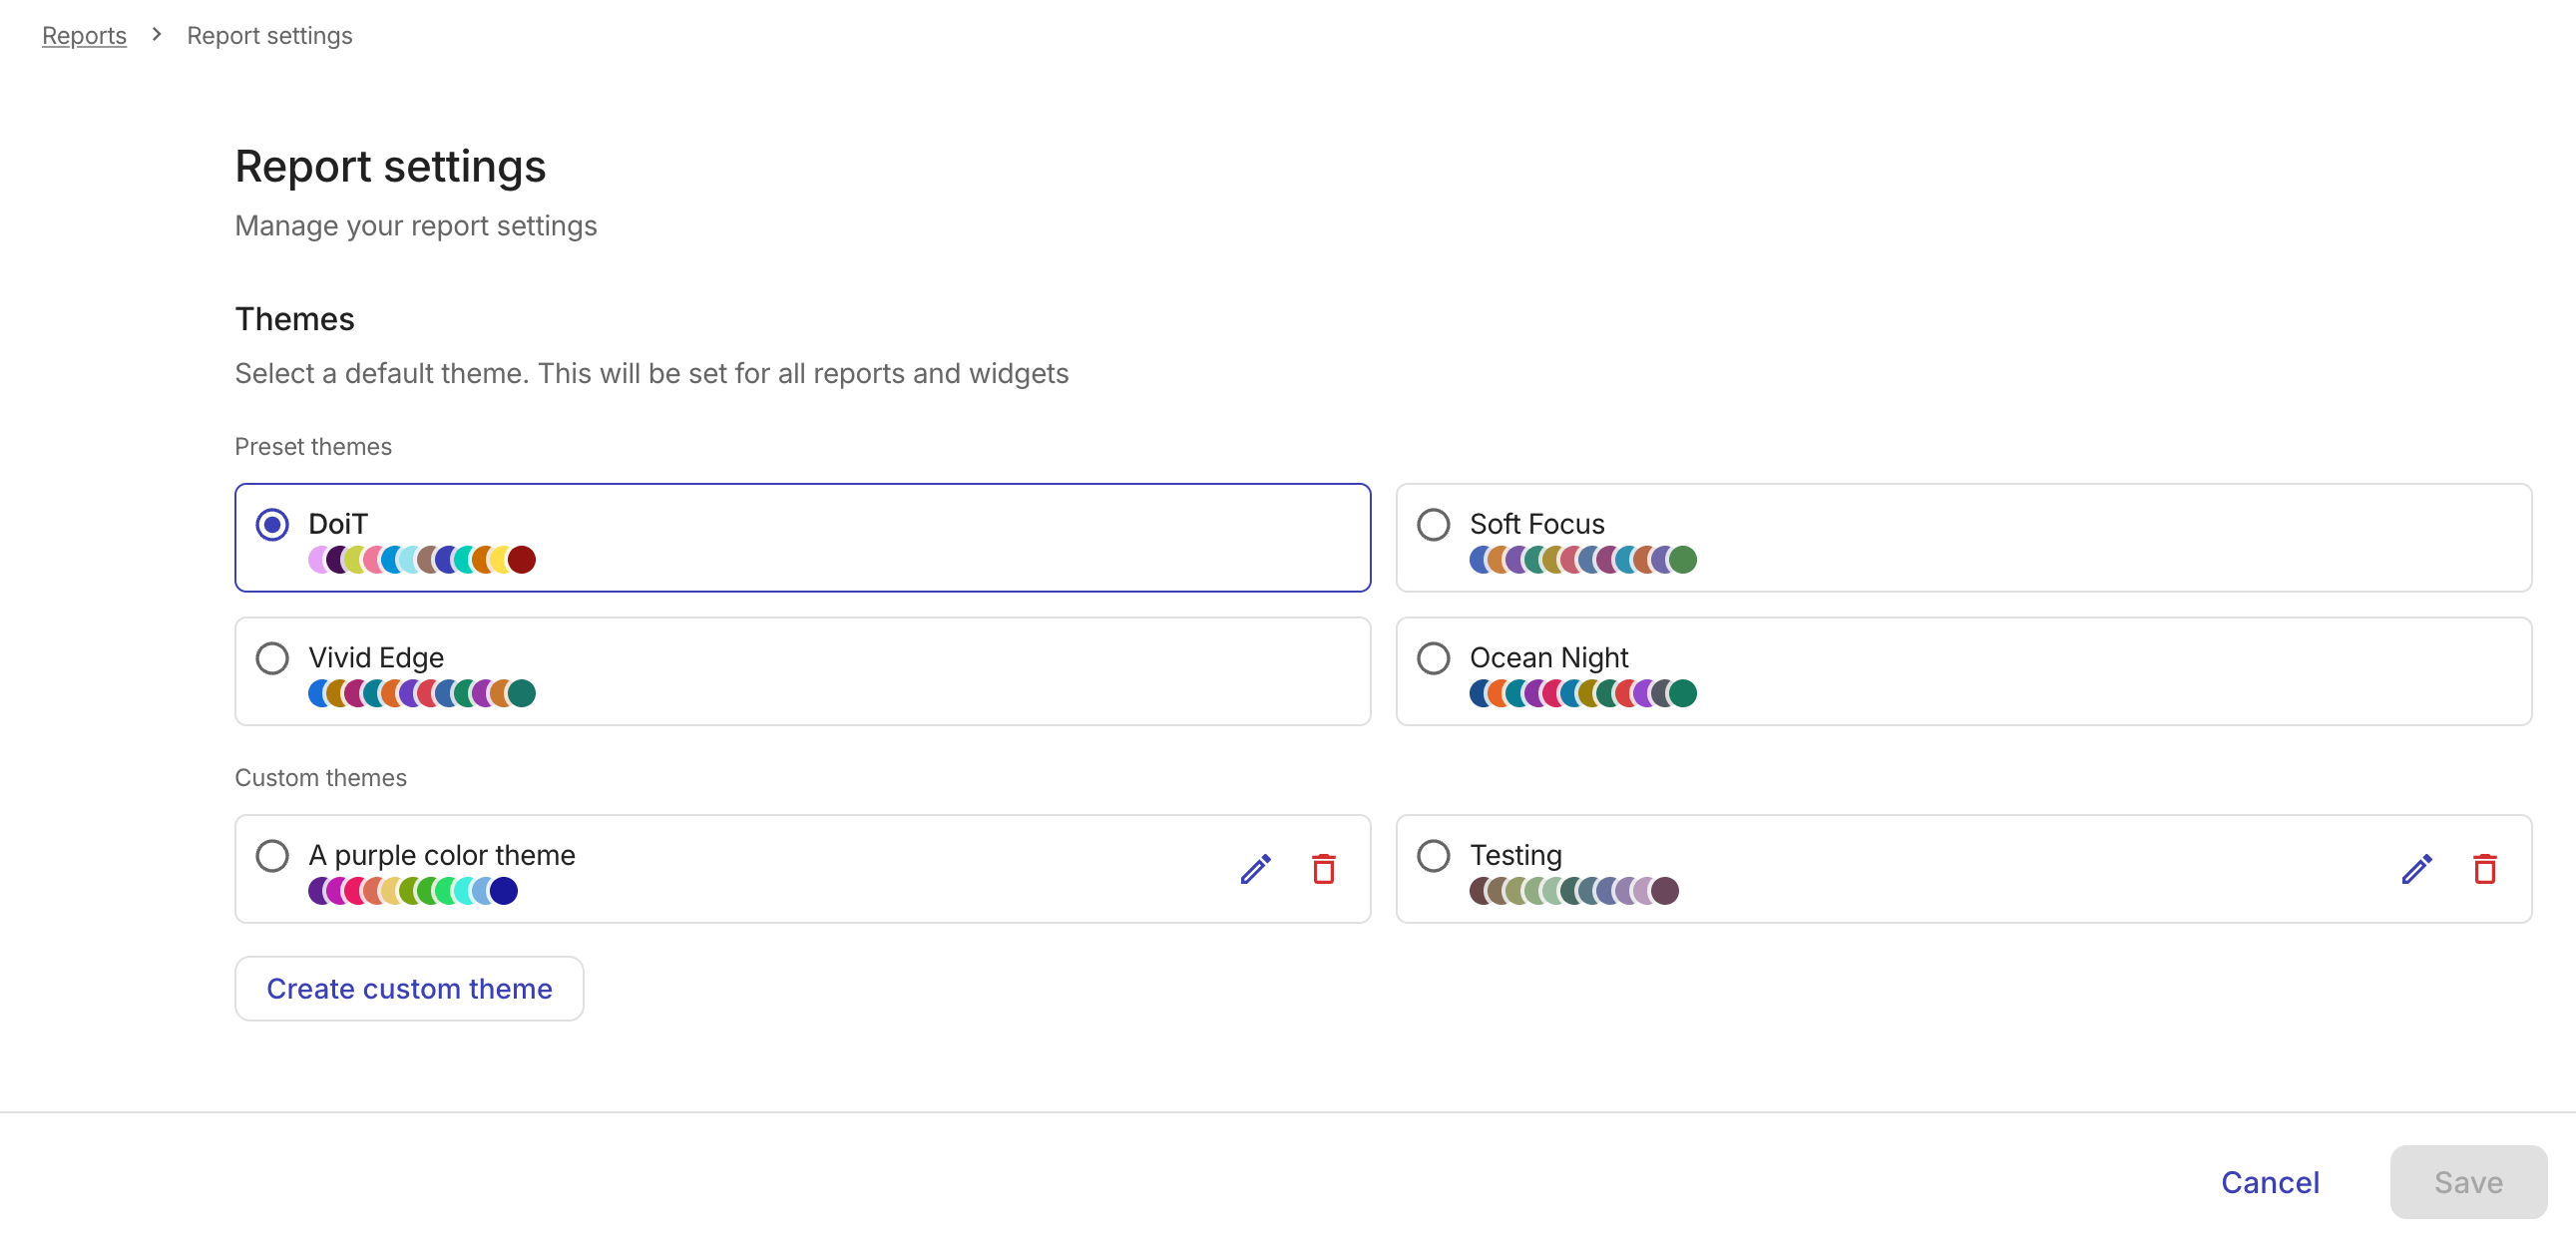
テーマを選択します。
-
Save を選択して設定を更新します。
既定のテーマはユーザー単位で保存されます。お客様の設定が他のユーザーに影響することはありません。
カスタムテーマを作成する
カスタムテーマは組織レベルで保存され、組織内の他のユーザーにも表示されます。
カスタムテーマを作成するには、次の手順に従ってください。
-
メインの Reports 画面で、ページヘッダー横のケバブメニュー(⋮)を選択し、Report settings を選択します。
-
Create custom theme を選択します。
-
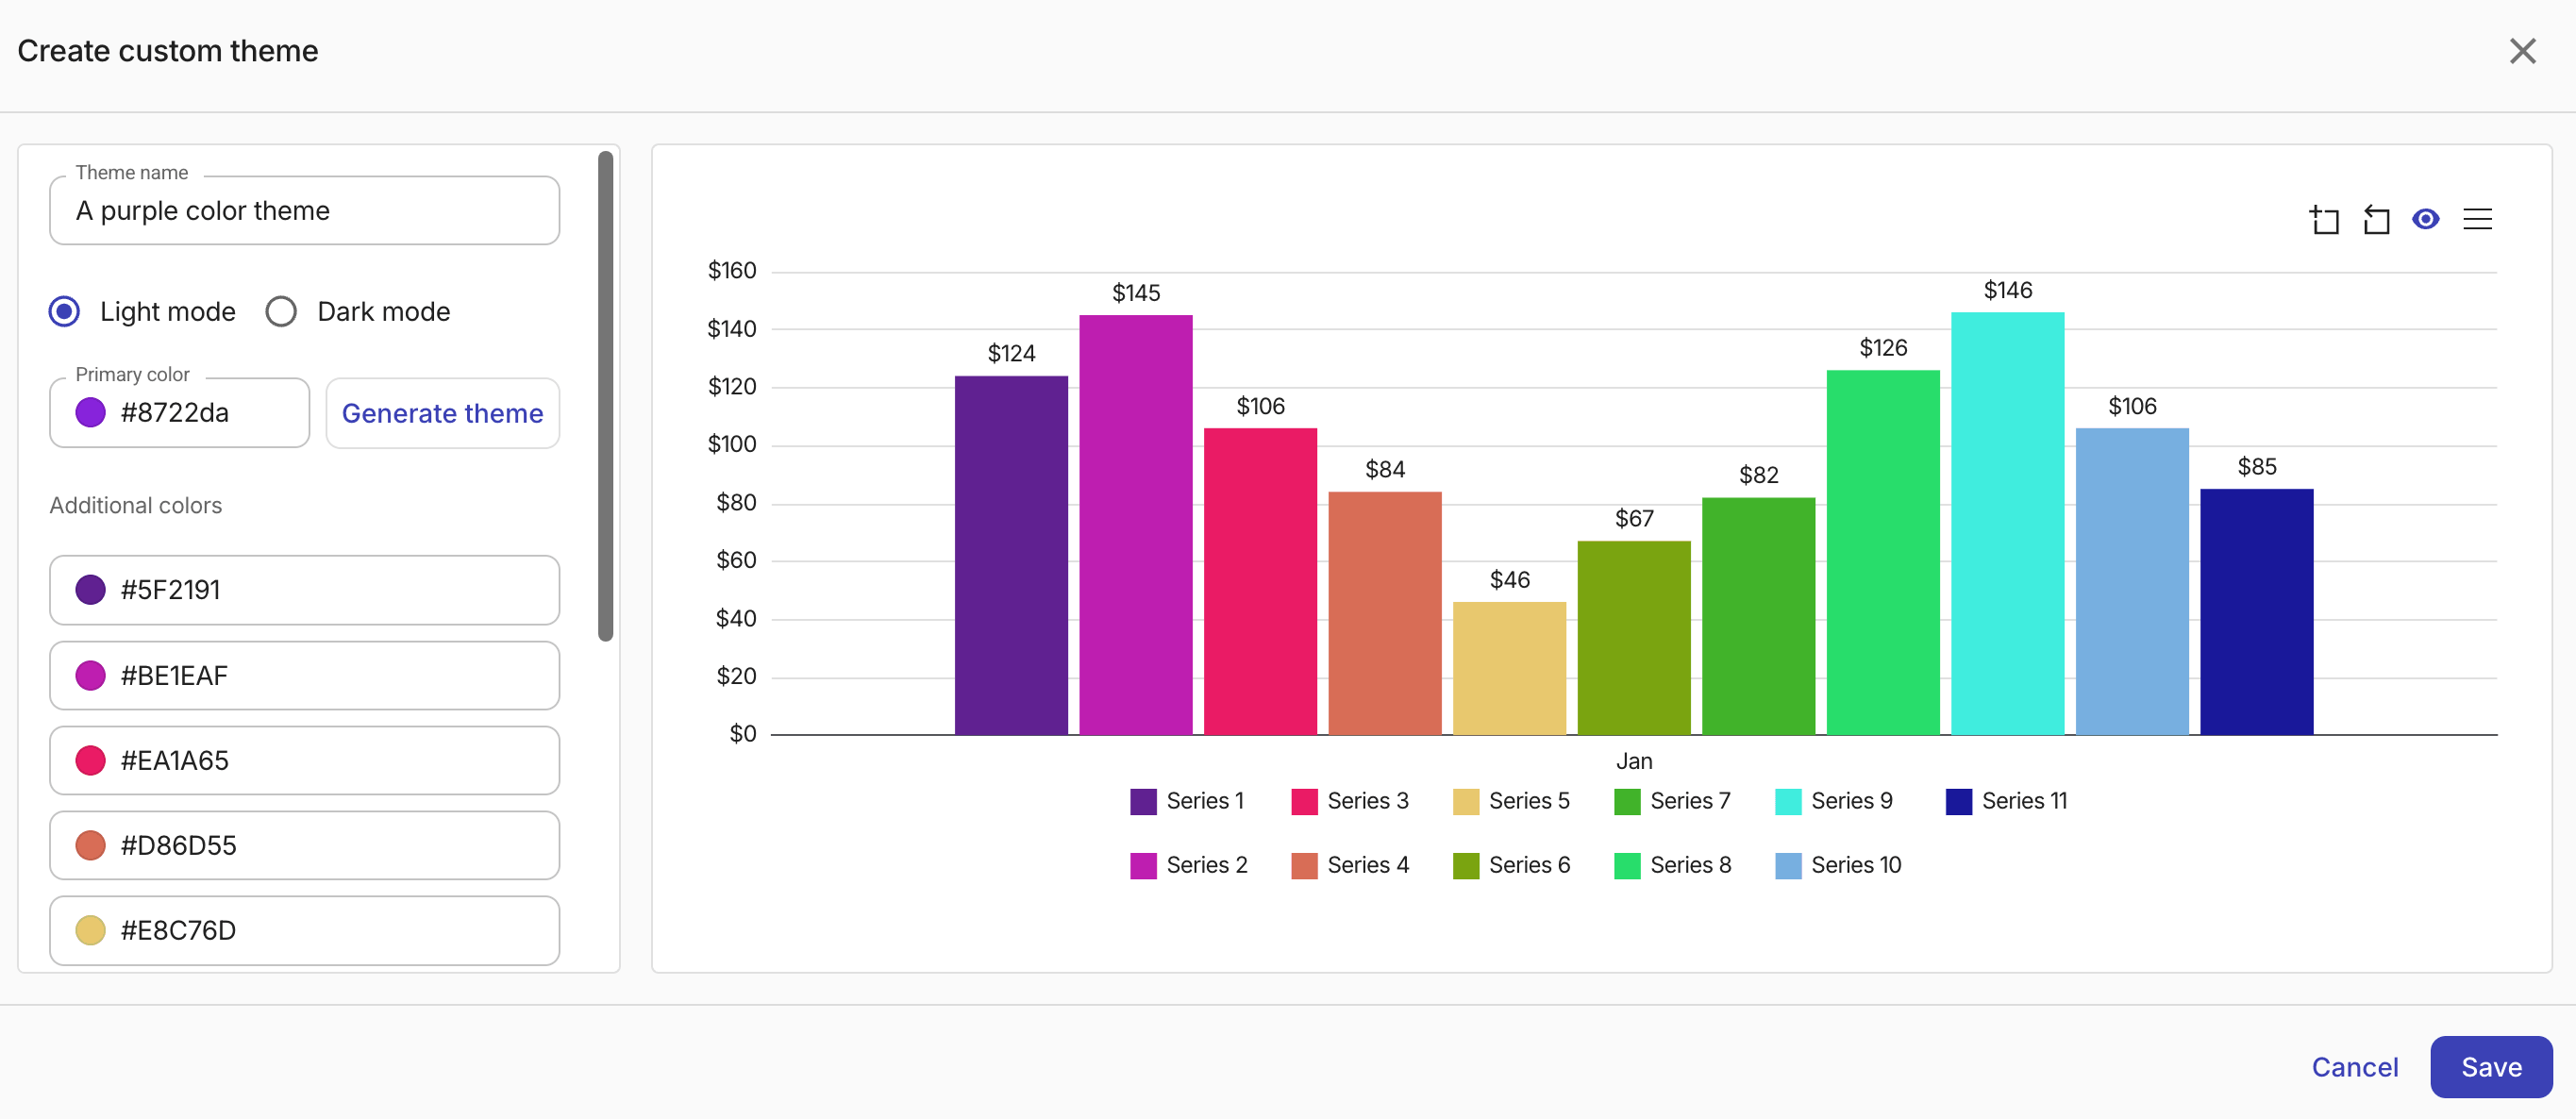
テーマを設定します。
-
テーマ名を入力します。
-
プライマリカラーを選択します。16 進数値を直接入力するか、カラーピッカーを使用できます。
-
Generate theme を選択して、プライマリカラーに基づくライトモード用とダークモード用のパレットのペアを作成します。
-
ライブチャートプレビューでパレットを確認し、必要に応じて各カラースウォッチを手動で調整します。
-
Save を選択してテーマを作成します。
-
カスタムテーマを編集または削除する
カスタムテーマを��編集または削除するには、Report settings ページに移動し、テーマカード上の該当するアイコンを選択します。