Dashboard reports
You can add reports to dashboards created by you or organization dashboards that allow editing.
Required permission
-
Your DoiT account must have the Cloud Analytics User permission.
-
You can add only those reports to which you have access (see access reports).
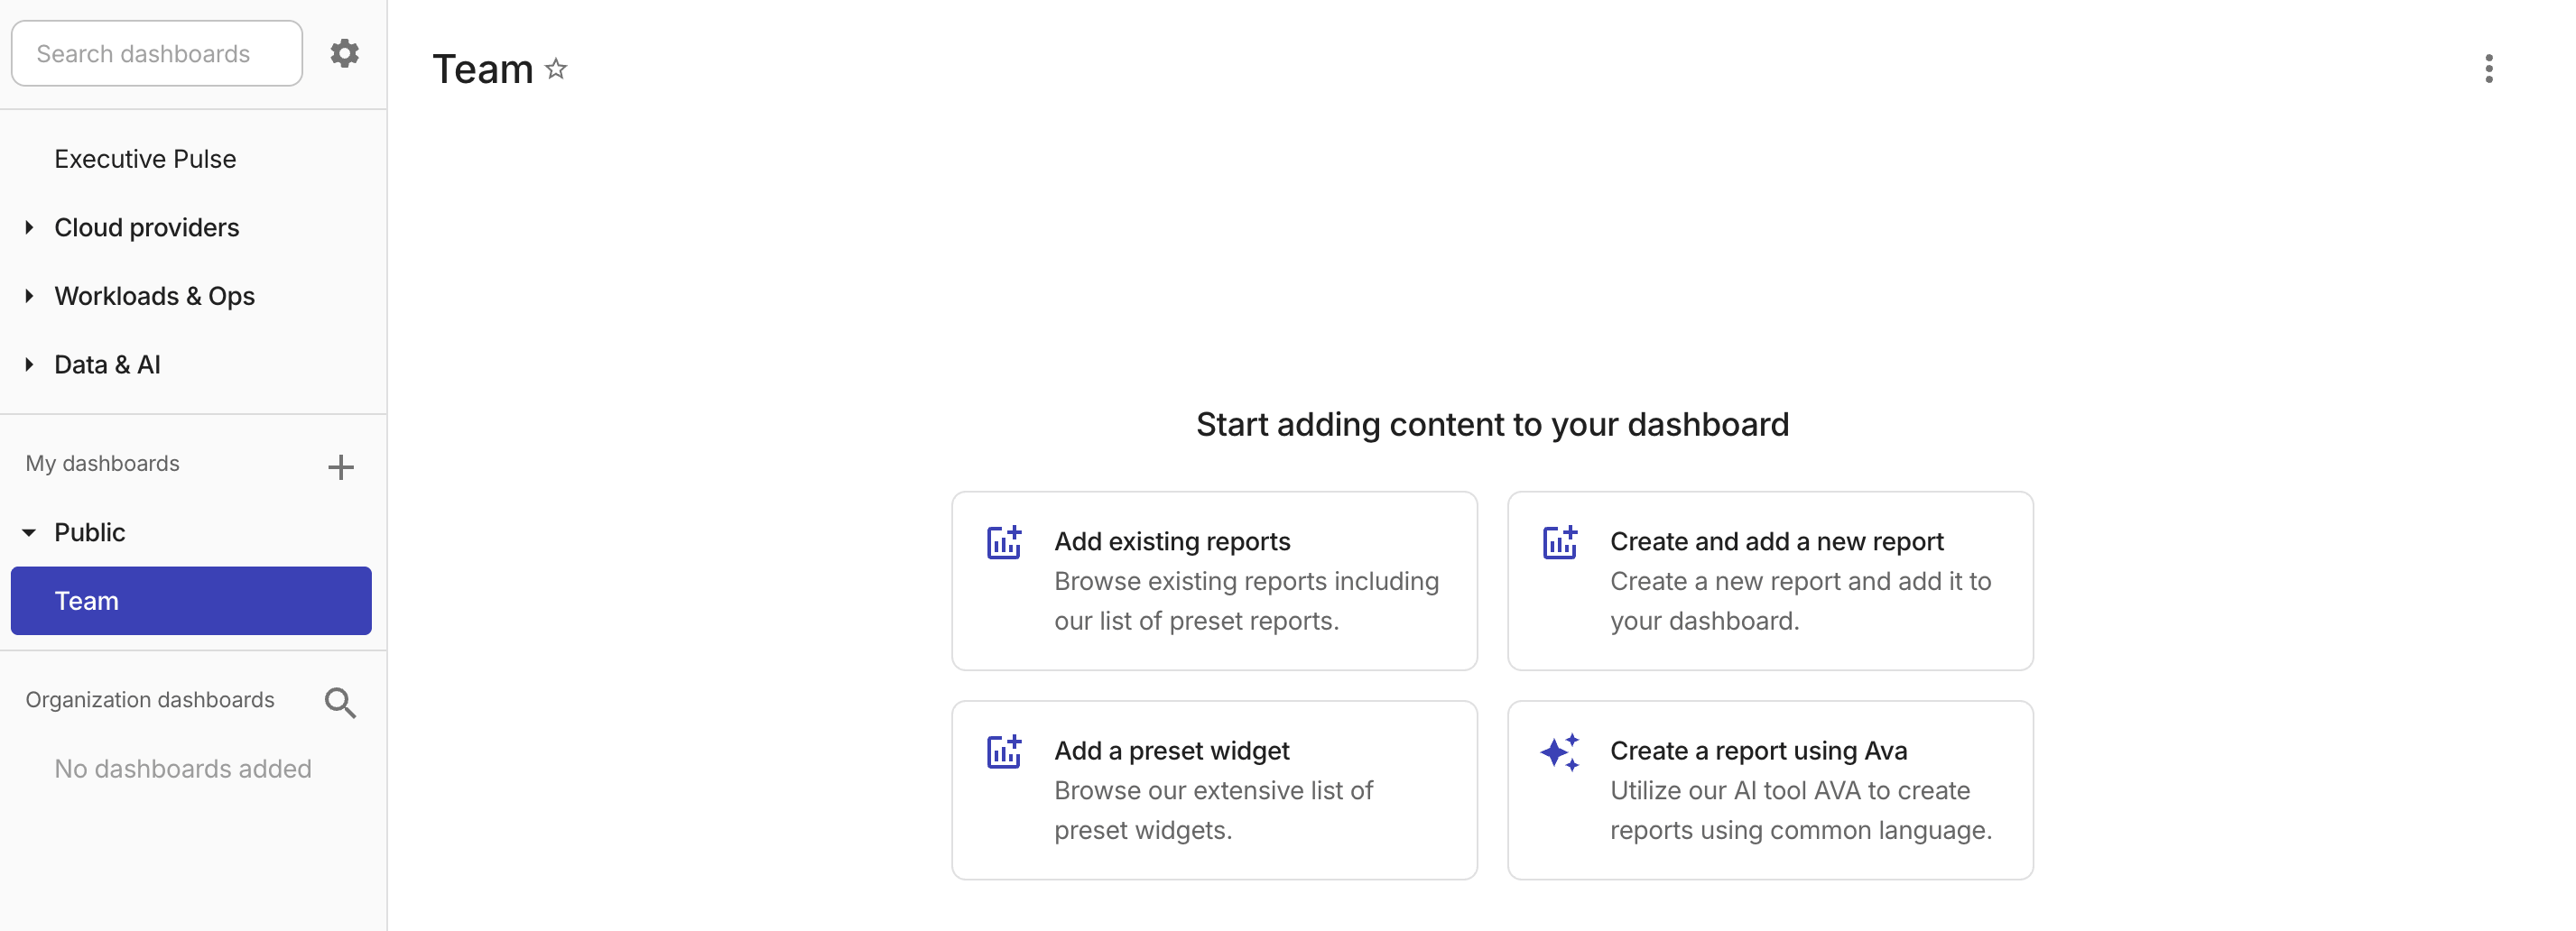
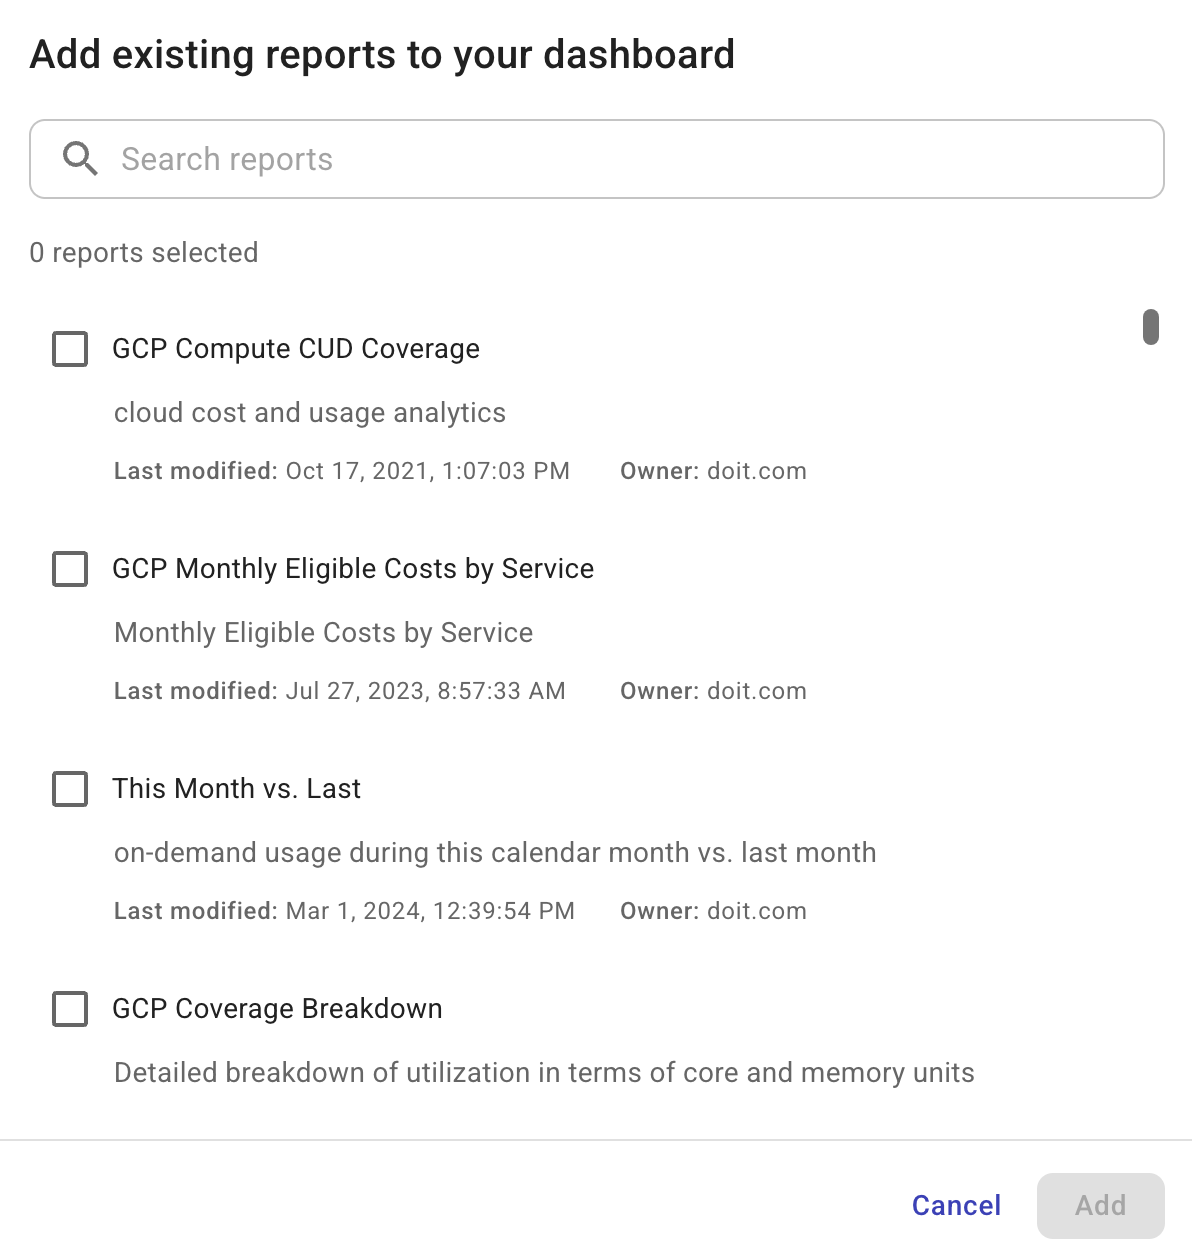
Add existing reports
To add existing reports to a dashboard:
-
Go to the dashboard of interest.
-
Select Add existing reports.
-
Select one or more reports from the list.
-
Select Add.
Create and add a new report
You can also create a new report from a dashboard. This way, the new report will be added to the dashboard automatically.
-
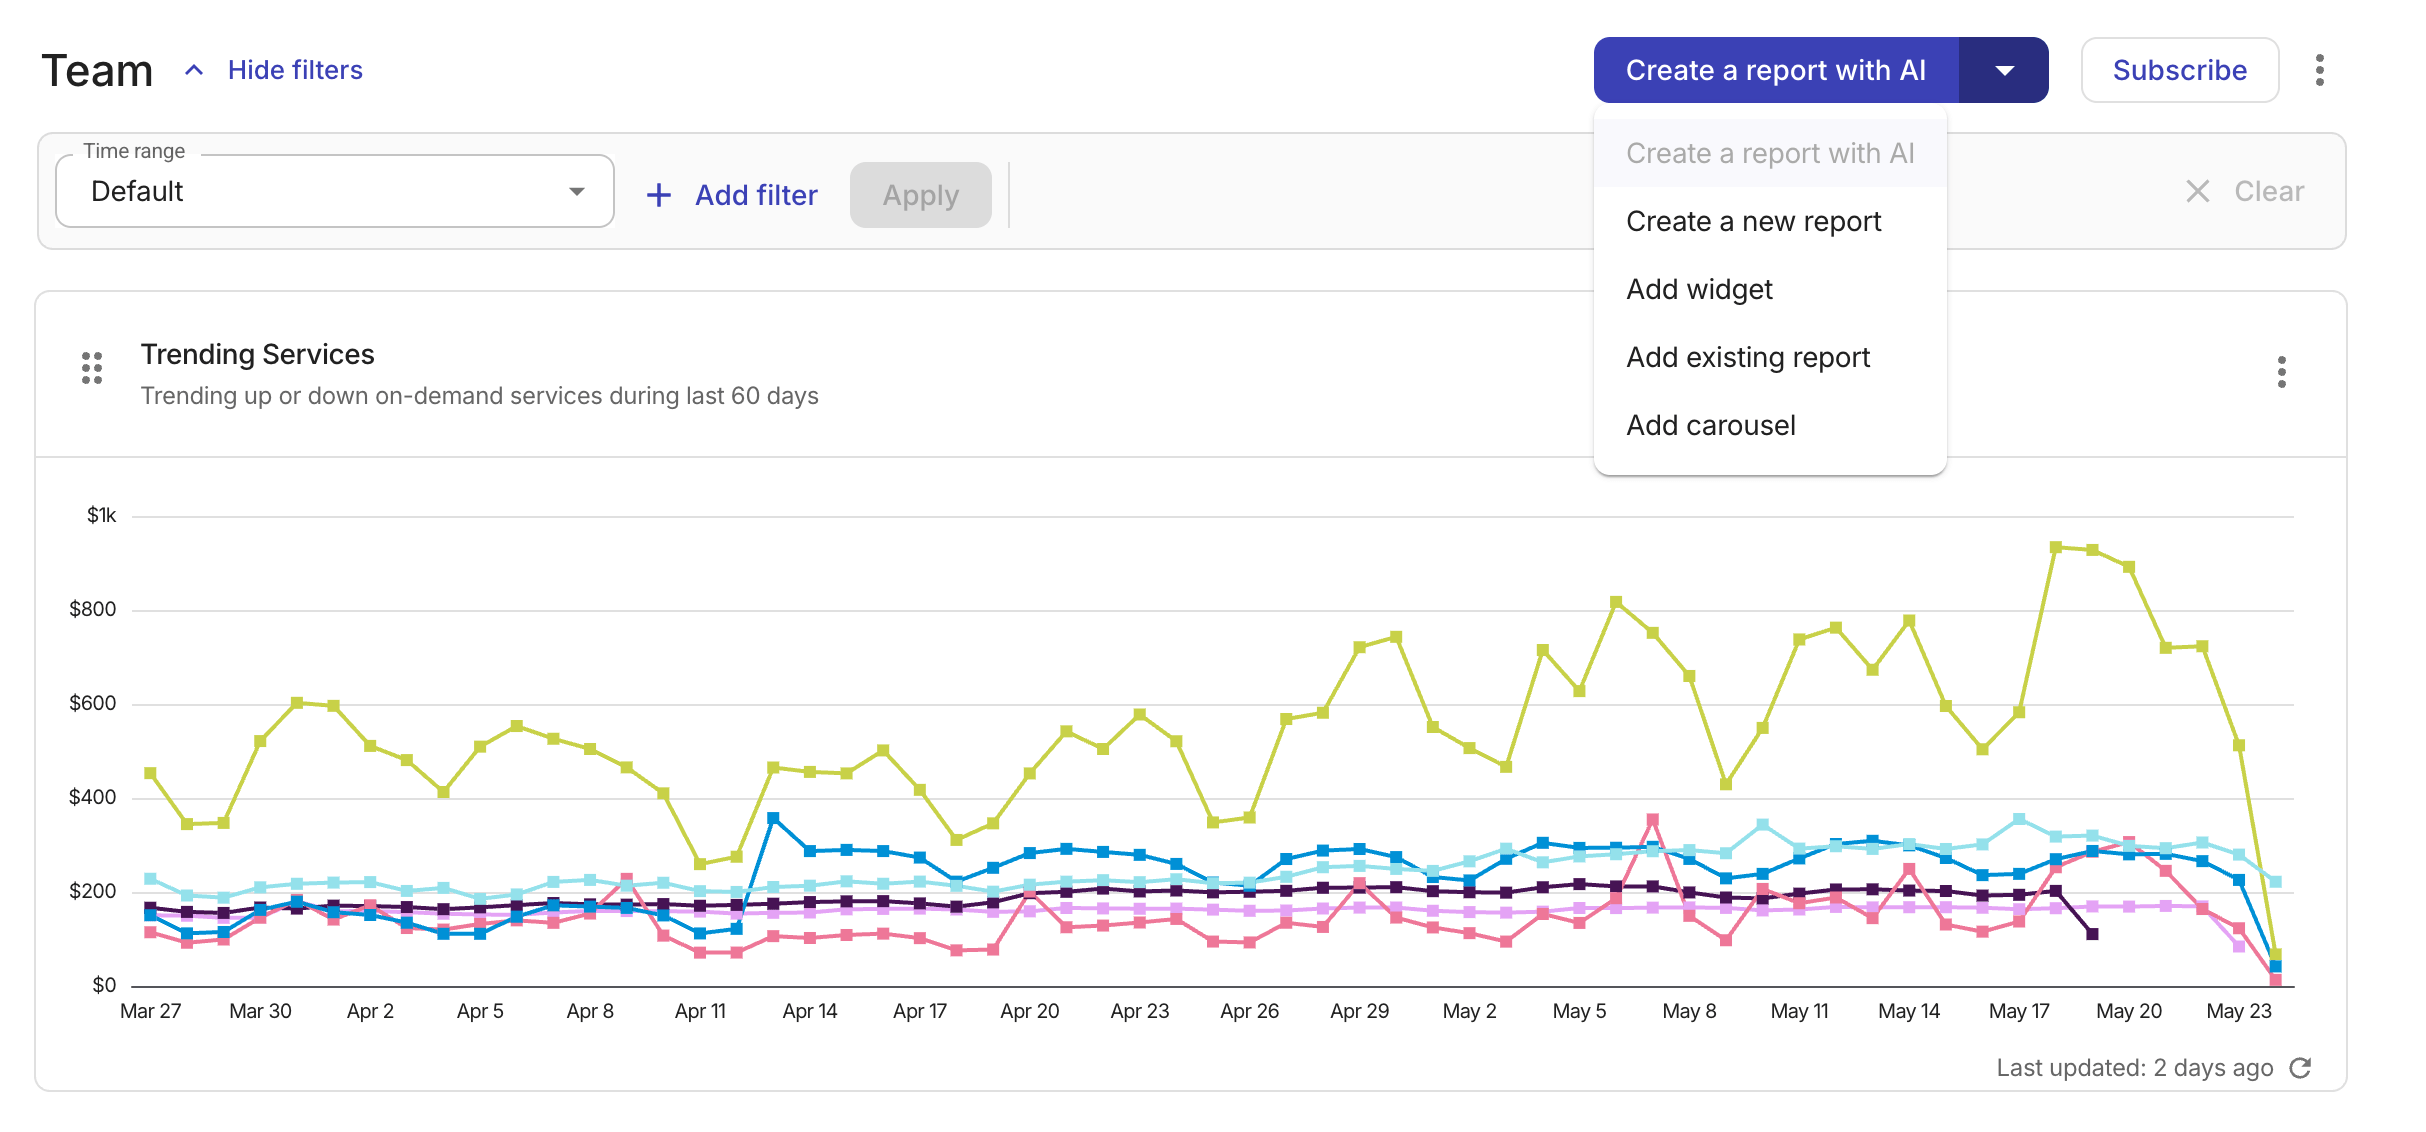
To create a report from scratch, select Create a new report or Create and add a new report. It will take you to the report creation page.
-
If your DoiT plan includes Ava, you can select Create a report with AI to generate a report by chatting with Ava, our AI assistant. Once the report is generated, you can open it in Cloud Analytics for further adjustments. Make sure to save the report so it appears on the dashboard.
Dashboard time range and filters
Set time range and filters
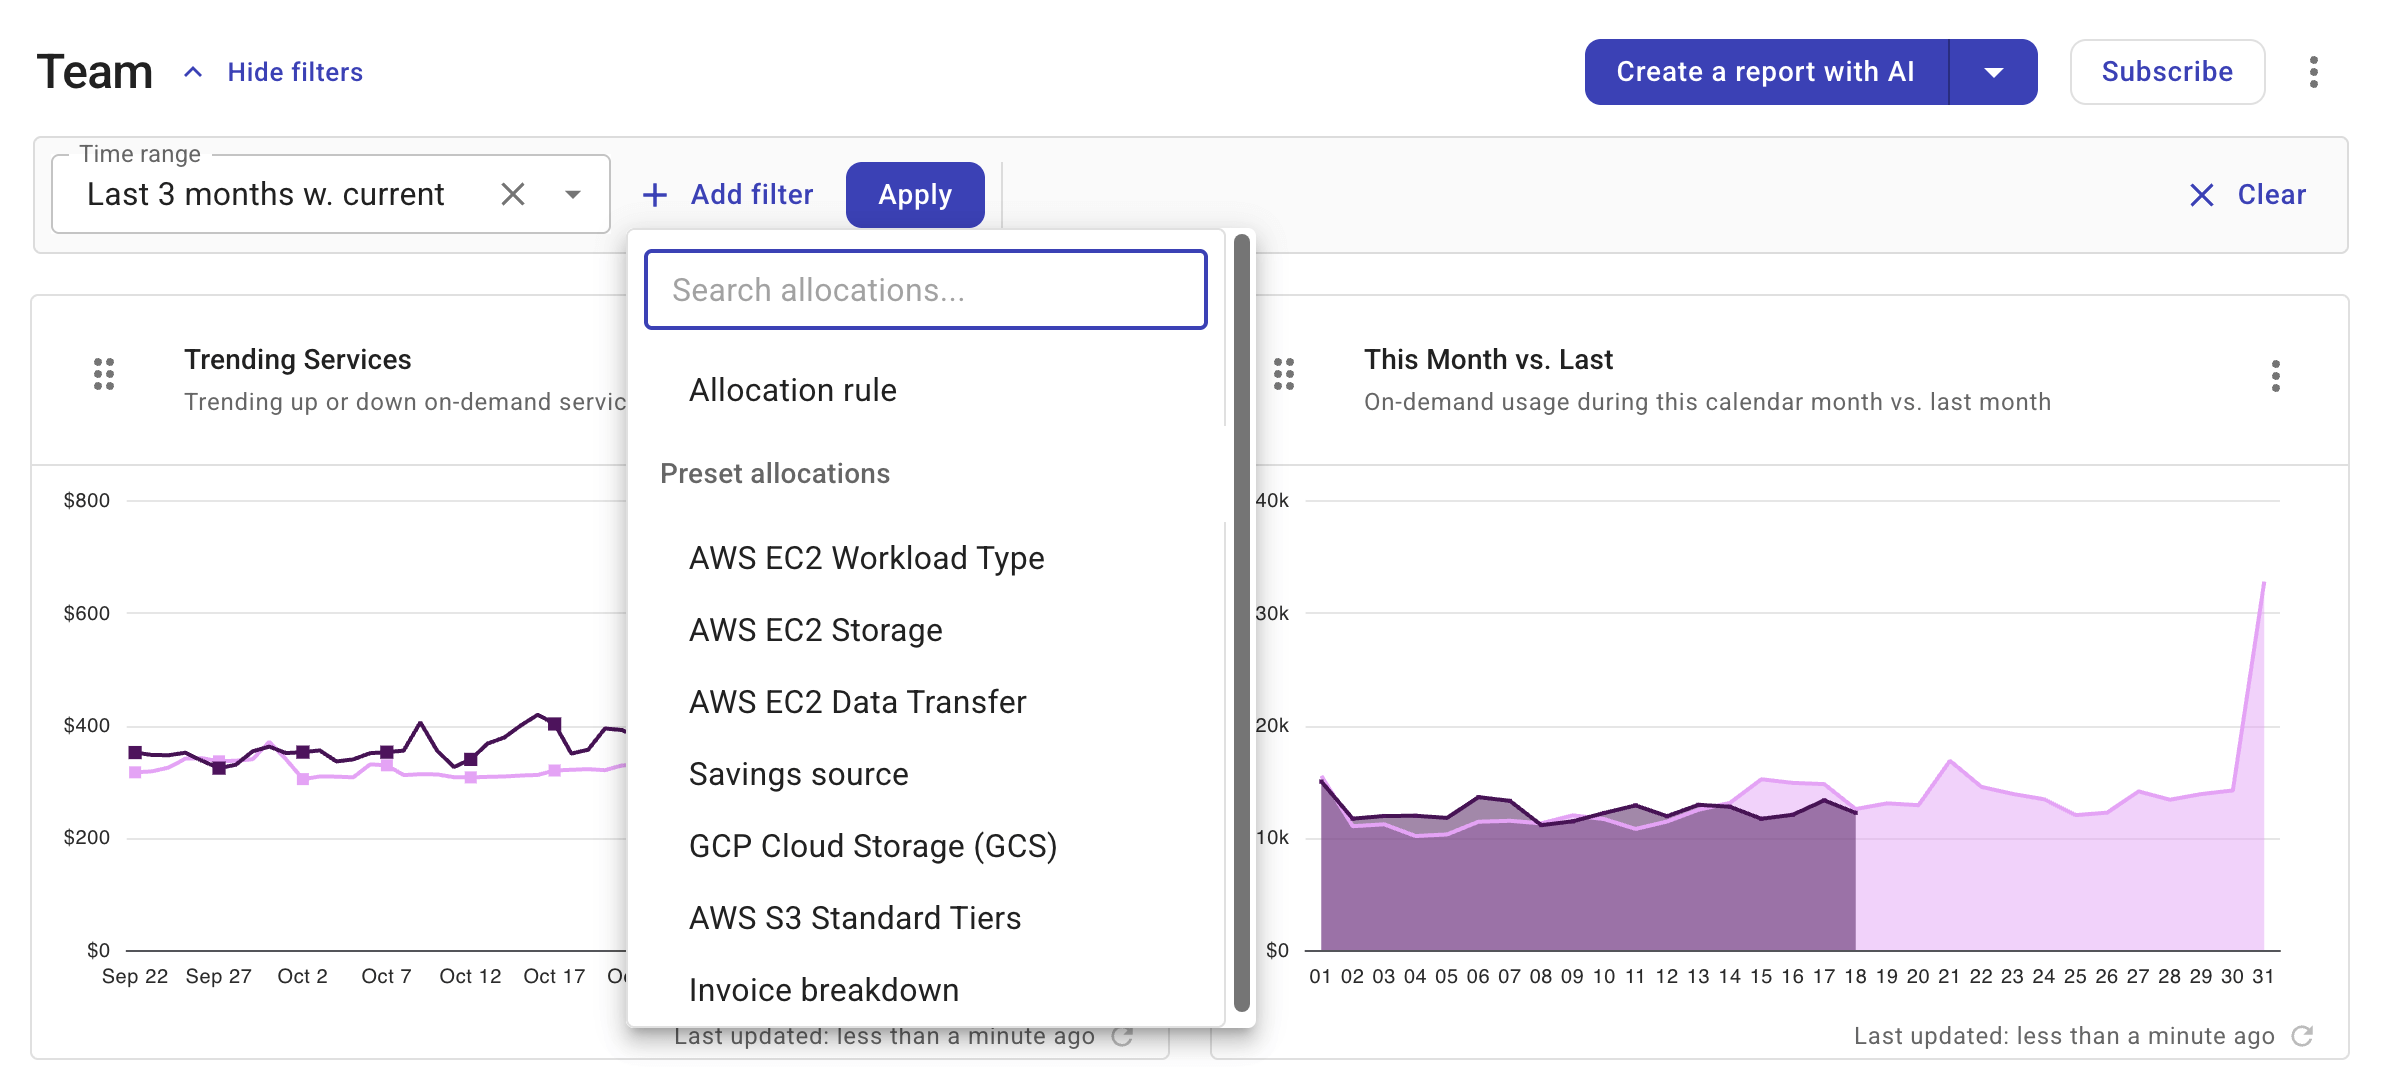
For a custom dashboard with multiple reports, you can set a single Time range at the dashboard level to get a consistent timeframe across all reports and Add filter to narrow down the displayed data, without having to adjust each report individually.
-
Time range
-
The dashboard time range options are the same as those available at the report level. You can choose a predefined time range or specify a custom one. (Once you choose a time range, the time interval is set automatically and cannot be adjusted.)
-
Setting the time range to
Defaultrestores each report to its default setting. -
The dashboard time range applies only within the dashboard. It doesn't affect the time range of a report if you open the report in Cloud Analytics.
-
-
Add filter
-
Dashboard filters allow only allocations, including allocation rules.
-
You can add up to three filters to a dashboard.
-
-
Apply: Changes to the dashboard time range and filters take effect only after you select Apply.
-
Clear: This option restores the dashboard's time range to
Defaultand removes all the applied filters.
How time range and filters work
Dashboard time range and filters are auxiliary resources and managed separately from other dashboard settings:
-
In the dashboard URL, time range and filter settings appear as an additional segment after the dashboard name. For example:
- Original:
https://console.doit.com/customers/{CUSTOMER_ID}/dashboards/{DASHBOARD_NAME} - With custom time range or filters:
https://console.doit.com/customers/{CUSTOMER_ID}/dashboards/{DASHBOARD_NAME}/{FILTER_SET_ID}
- Original:
-
When duplicating a dashboard, the copy doesn't inherit the time range and filters of the original one.
-
For an organization dashboard, if the owner updates the time range or filters, other users are presented with two options the next time they open the dashboard.
-
Save shared filters: Apply the time range and filters of the dashboard owner.
-
Discard changes: Retain the local settings.

-
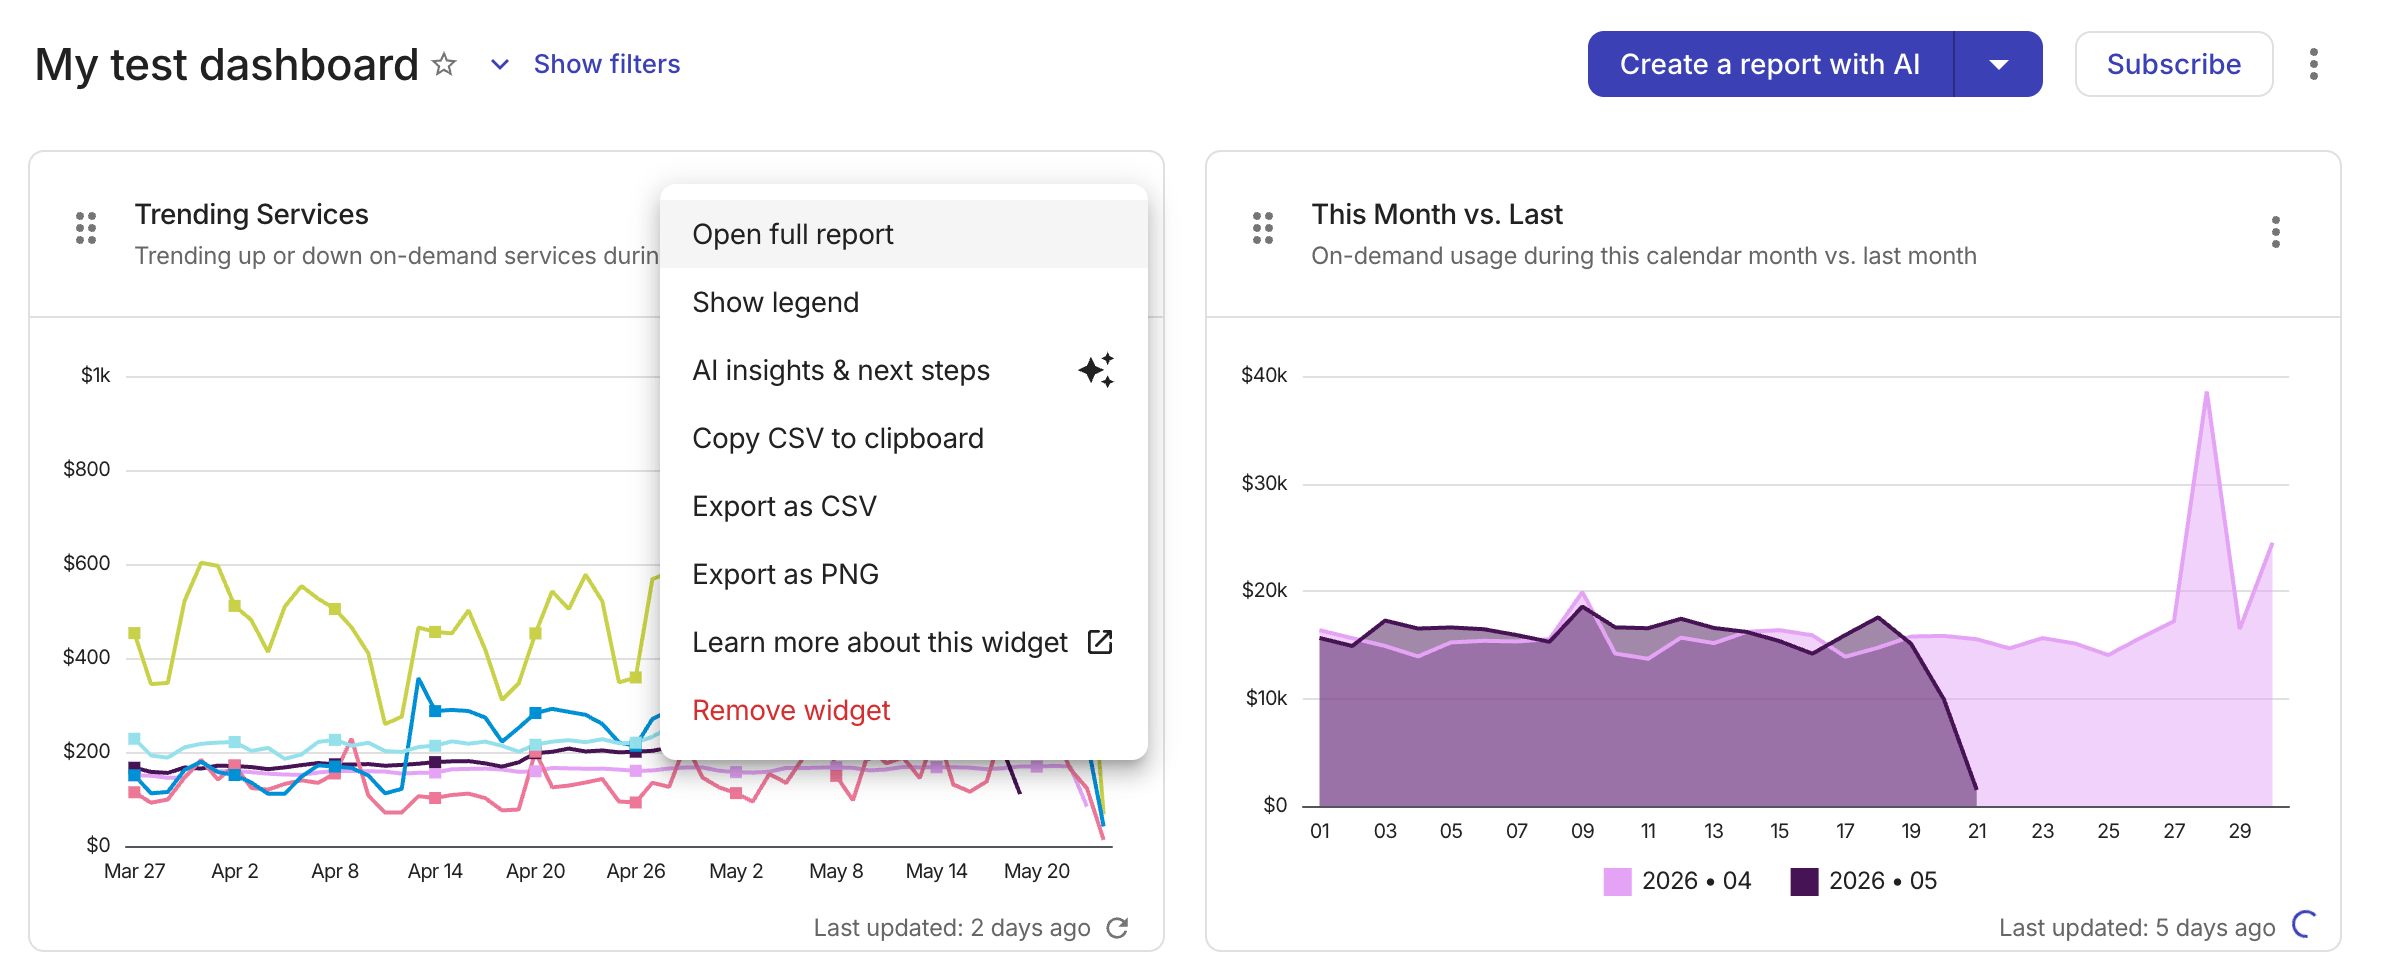
Report widget options
Report widget options are accessible from the kebab menu (⋮) in the upper-right corner of a widget:
-
Open full report: Opens the report in Cloud Analytics.
-
Show/Hide legend: Shows or hides report legends.
-
AI insights & next steps: Provides insights based on the report. Available if your DoiT plan includes Ava.
-
Copy CSV to clipboard, Export as CSV/PNG: See Export reports.
-
Remove widget: Removes the widget from the dashboard. Available only on custom dashboards that you created or have permission to edit.
Report legends
Report widgets on a dashboard can display legends that map colors to data series, making it easier to identify series at a glance. Legends are hidden by default.
-
To toggle the legend for a single report, select the kebab menu (⋮) in the upper-right corner of the widget and choose Show legend or Hide legend.
-
To show or hide legends for all reports on the same dashboard at once, use the Dashboard management options. You can still adjust individual widgets afterward.
Legend preference is saved per user, per widget, and per dashboard.
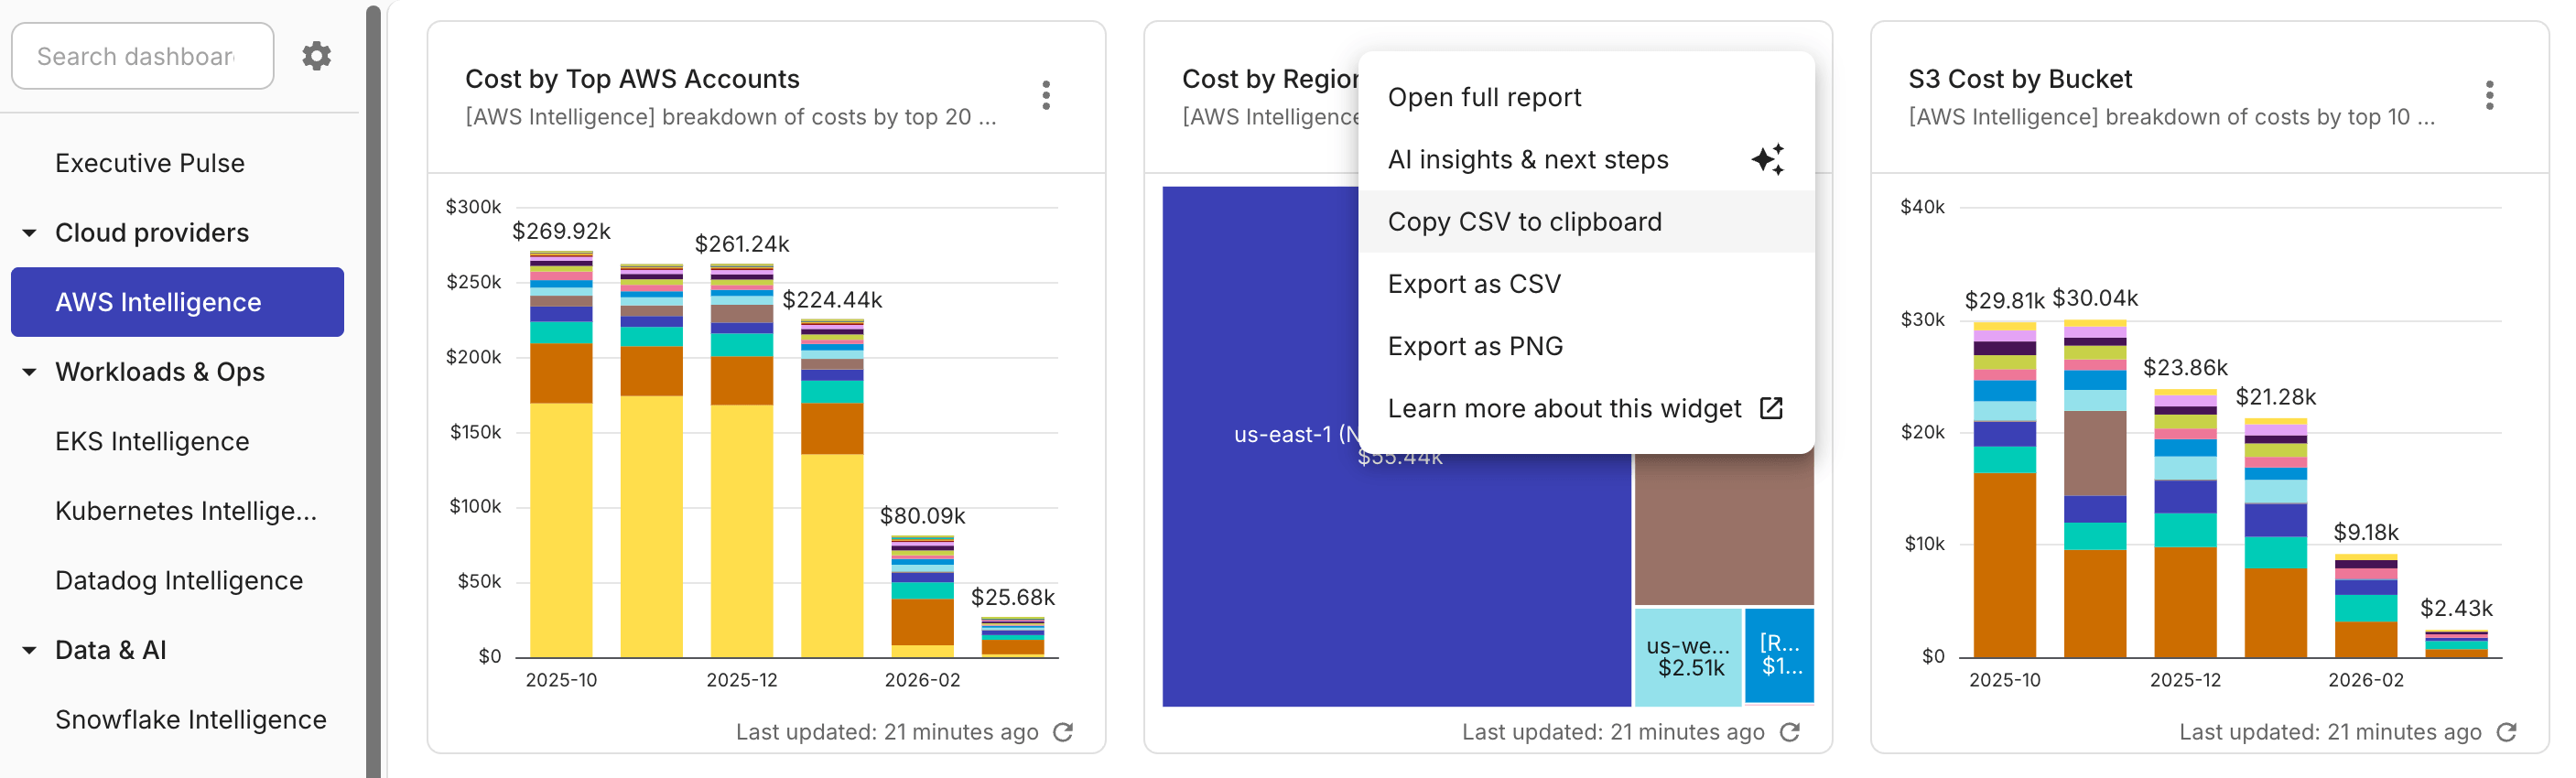
Export reports
If a report has been rendered successfully on a dashboard, you can export it by selecting the kebab menu (⋮) in the upper-right corner and choosing a desired format:
-
Copy CSV to clipboard: Exports the pivoted data you see in the DoiT console to the clipboard.
-
Export as CSV: Exports the pivoted data you see in the DoiT console to CSV.
-
Export as PNG: Exports the chart you see in the DoiT console to a PNG file.