Introduction
Dashboards in the DoiT console are an essential tool for effective FinOps practices. They serve as a central hub to help you manage and optimize cloud infrastructure expenses.
Categories of dashboards
Dashboards are grouped into three categories:
-
Preset dashboards: These are system dashboards.
-
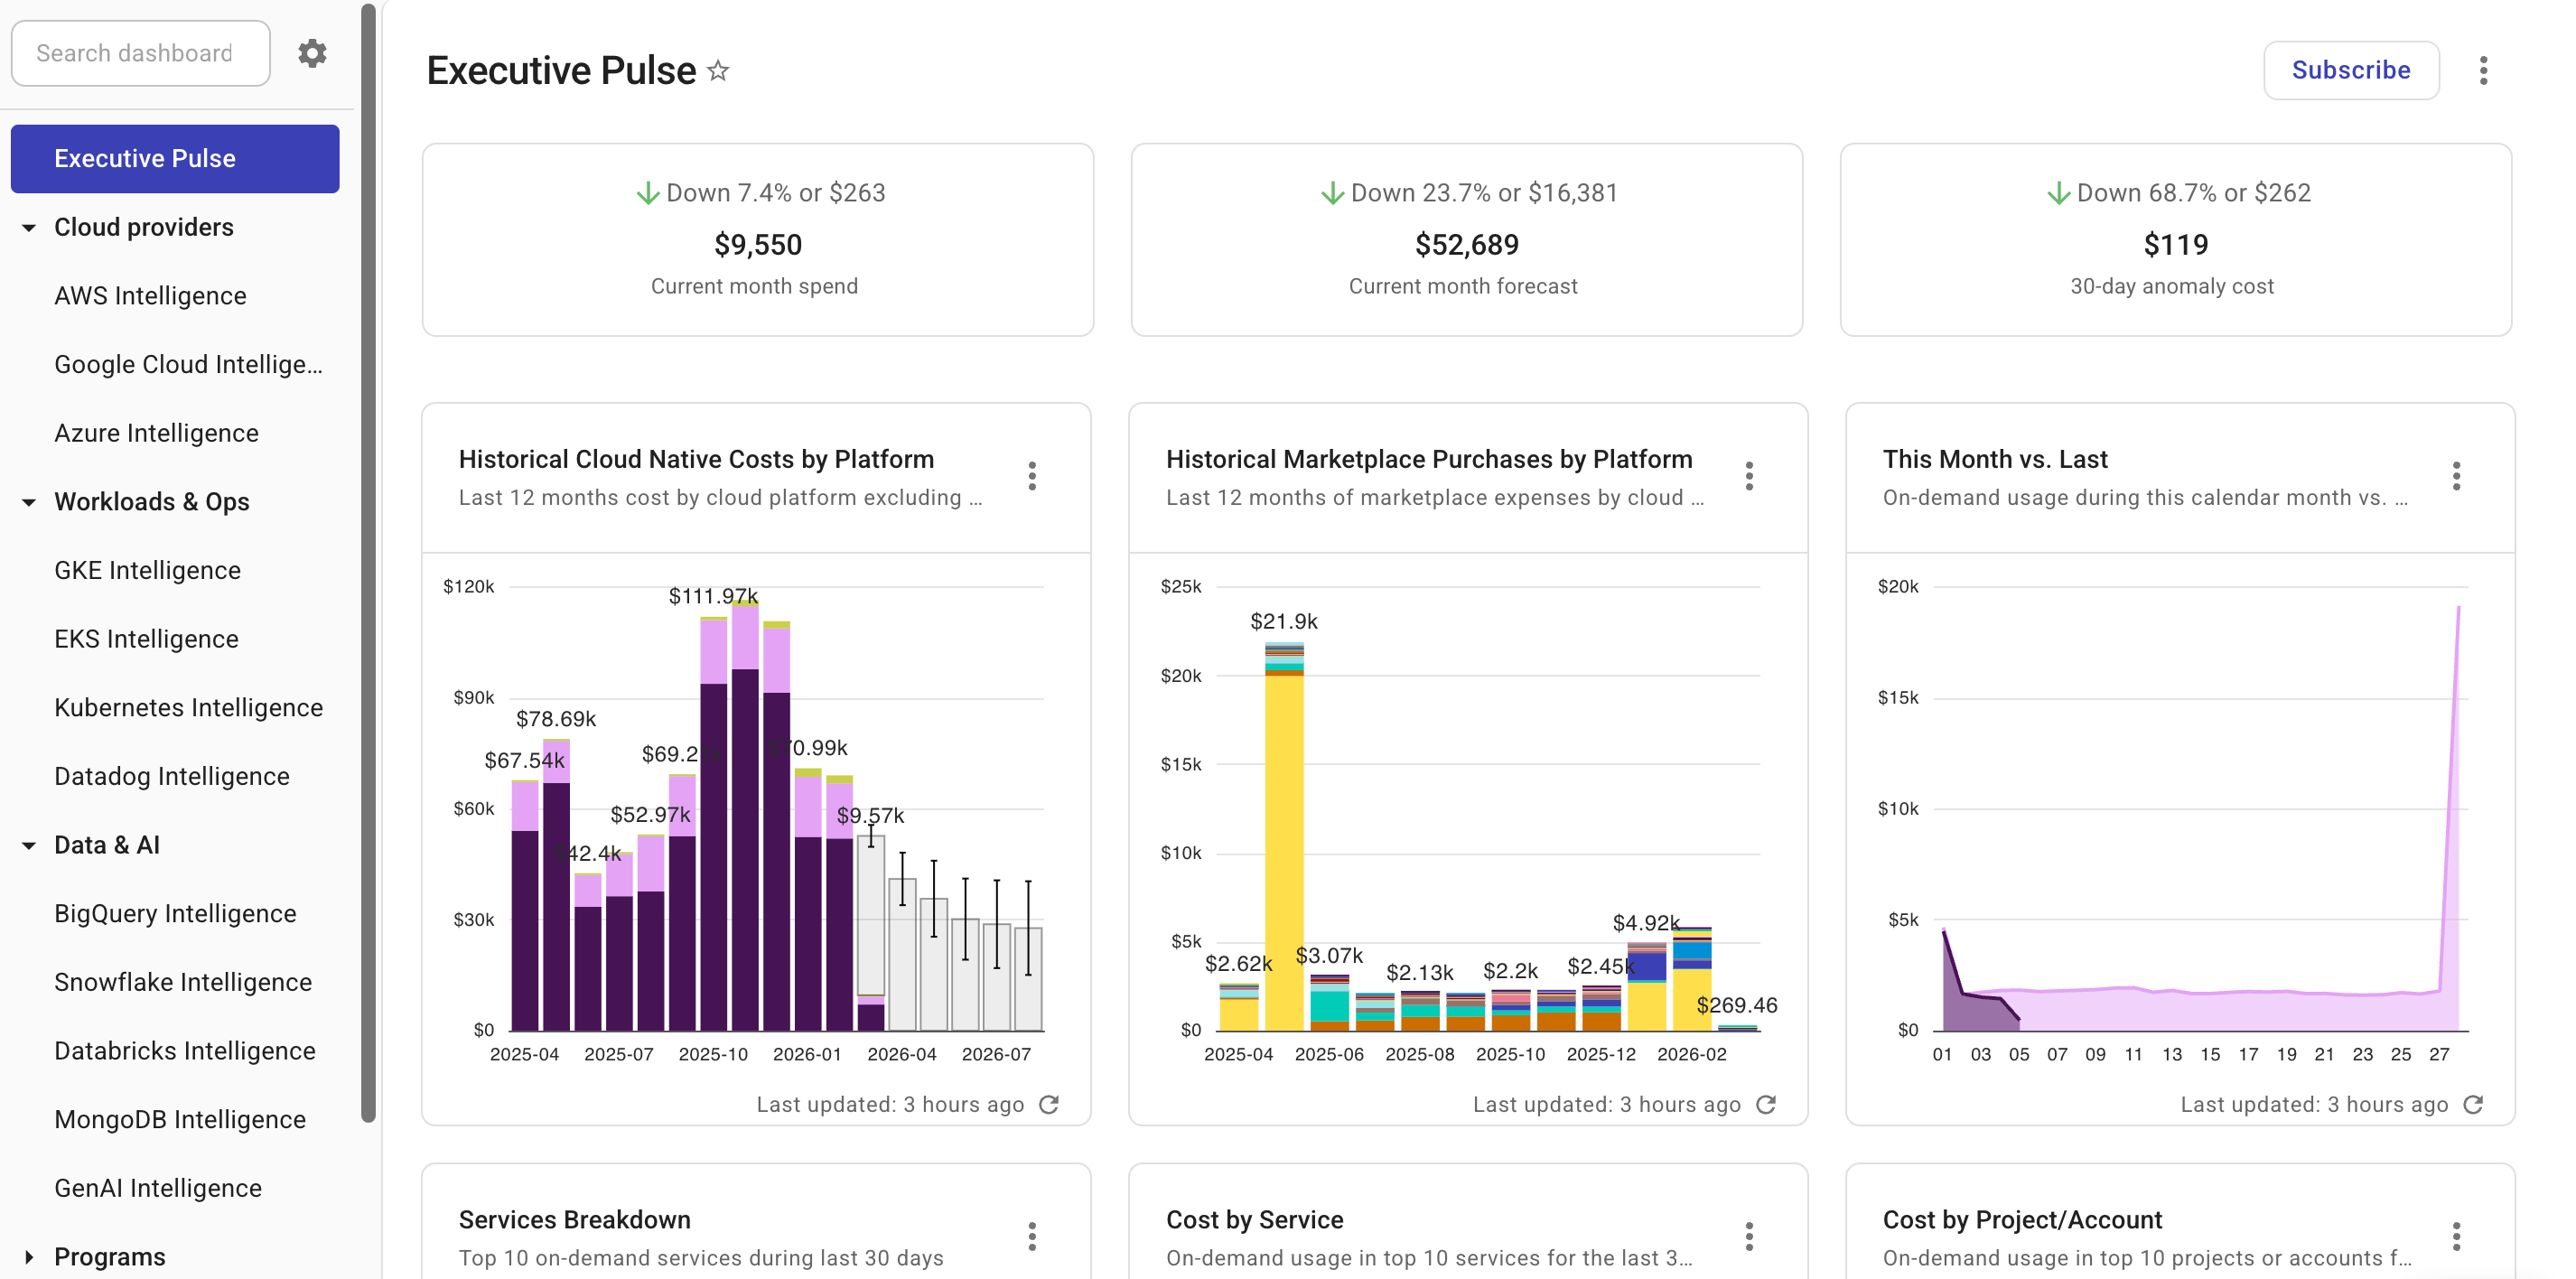
Executive pulse: Offers a comprehensive overview of your cloud expenditure across service providers.
-
Workload-specific dashboards: Help you gain deeper insights into your usage of cloud services.
-
Dashboards tied to cloud providers: AWS Intelligence, Google Cloud Intelligence, BigQuery Intelligence, GKE Intelligence, Azure Intelligence, EKS Intelligence, and AWS MAP Intelligence.
-
Dashboards for third-party solutions: Databricks Intelligence, Datadog Intelligence, GenAI Intelligence, Snowflake Intelligence, and more.
-
-
-
My dashboards: Custom dashboards created by you.
-
Organization dashboards: Custom dashboards created by other members in your organization with Public visibility. See Organization dashboards.

Dashboard access control
Preset dashboards and public dashboards are, by default, accessible to your whole company.
To enforce granular access controls, you need the Users Manager permission to set up the Organizations feature, which allows you to:
-
Specify which dashboards are visible to members of a specific Organization.
-
Specify whether members of a specific Organization can create custom dashboards.