Create reports
You can create a new report from scratch, with or without help from Ava, our AI assistant, or based on an existing one.
Required permission
- Cloud Analytics User
Create a report from scratch
To create a new report from scratch:
-
Sign in to the DoiT console, select Reporting and analytics from the top navigation mega menu, and then select Reports.
-
Select Create report.
Tip- If you have set a default view, the new report will start with the prefilled configuration.
- Some configuration options have different locations in Compact mode.
You can start configuring the report directly or use the Cloud Analytics copilot. The following section illustrates what to expect if you choose to work with the copilot.
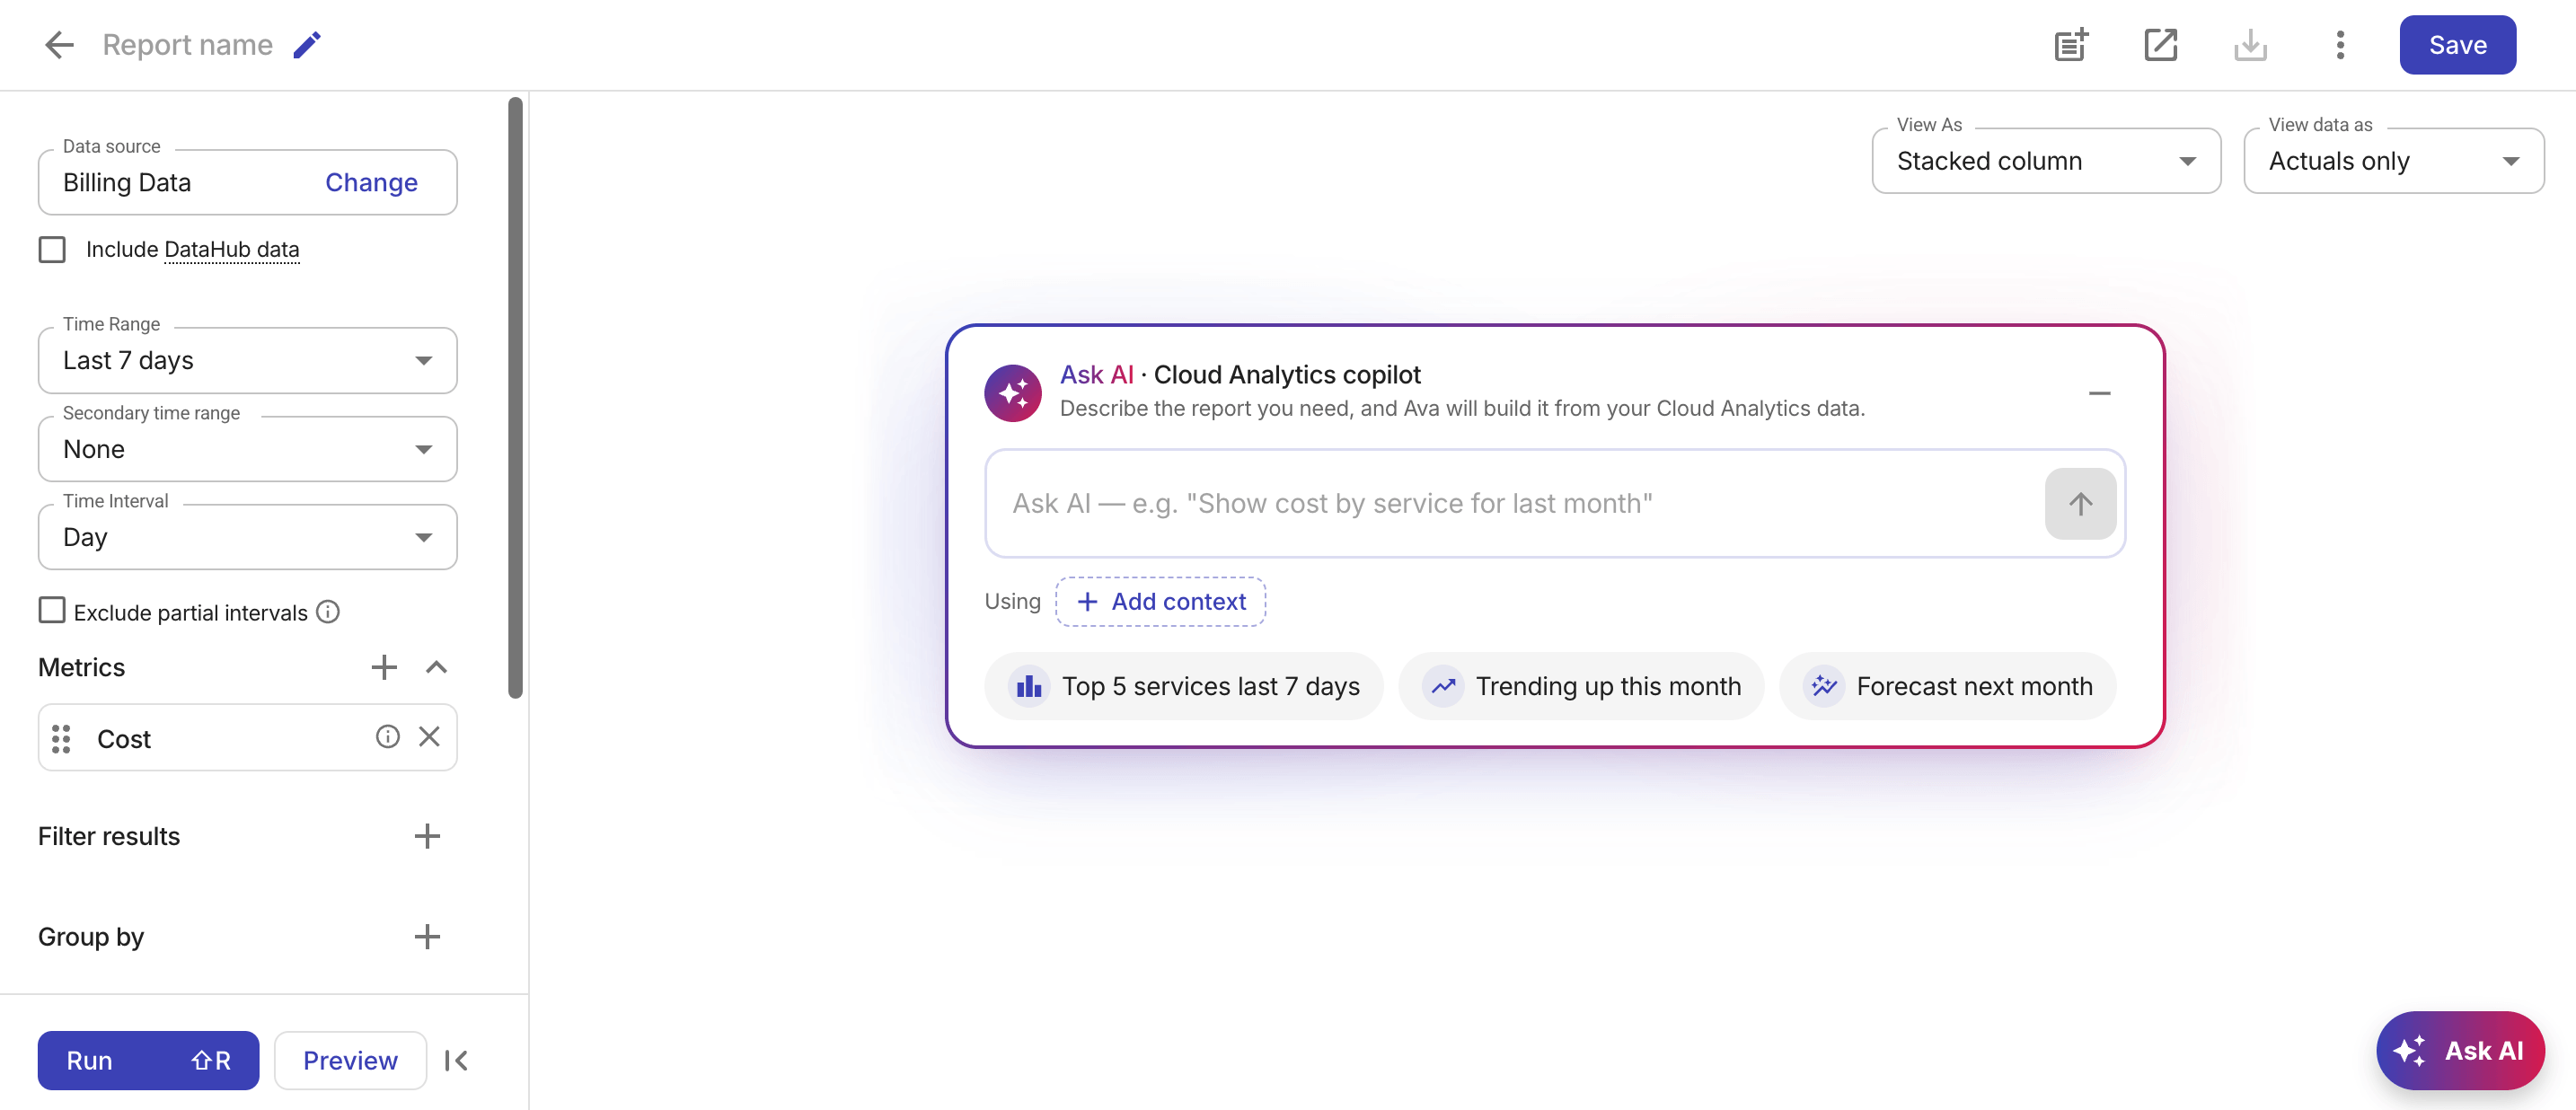
Generate a report with copilot
-
In the copilot prompt, describe the goal of your report, or select one of the suggested prompts.
-
(Optional) Select Add context to give additional information. You can choose any of the supported Dimensions, labels, and tags.
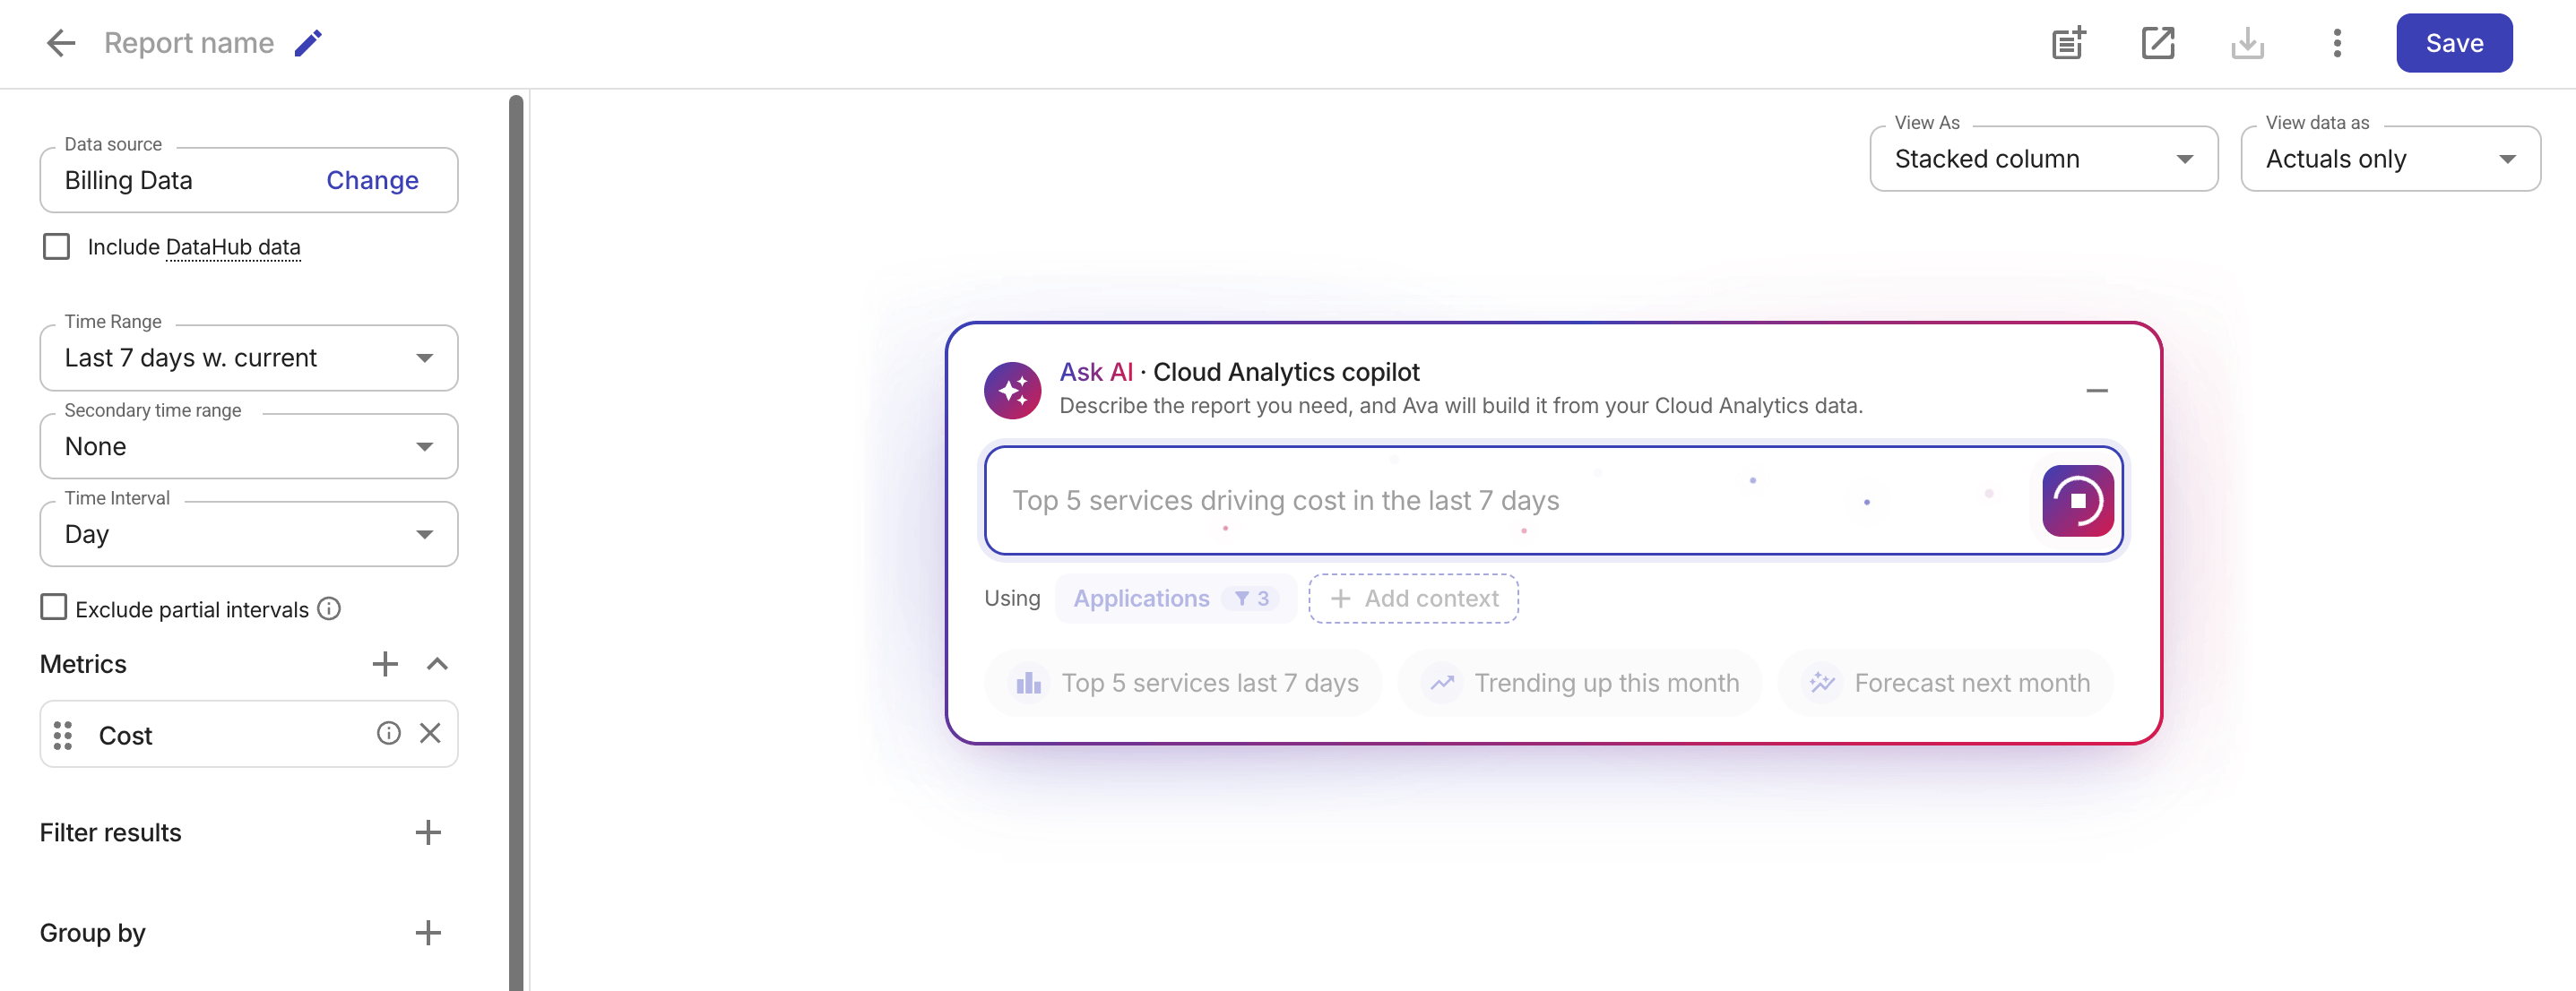
-
Press Enter or select the send button.
The copilot will start generating a report configuration that best suits your goal. You can stop or resume the process at any time by selecting the Stop or Play icon in the prompt field.
The report is rendered once the copilot completes the configuration, and the report settings are updated correspondingly.
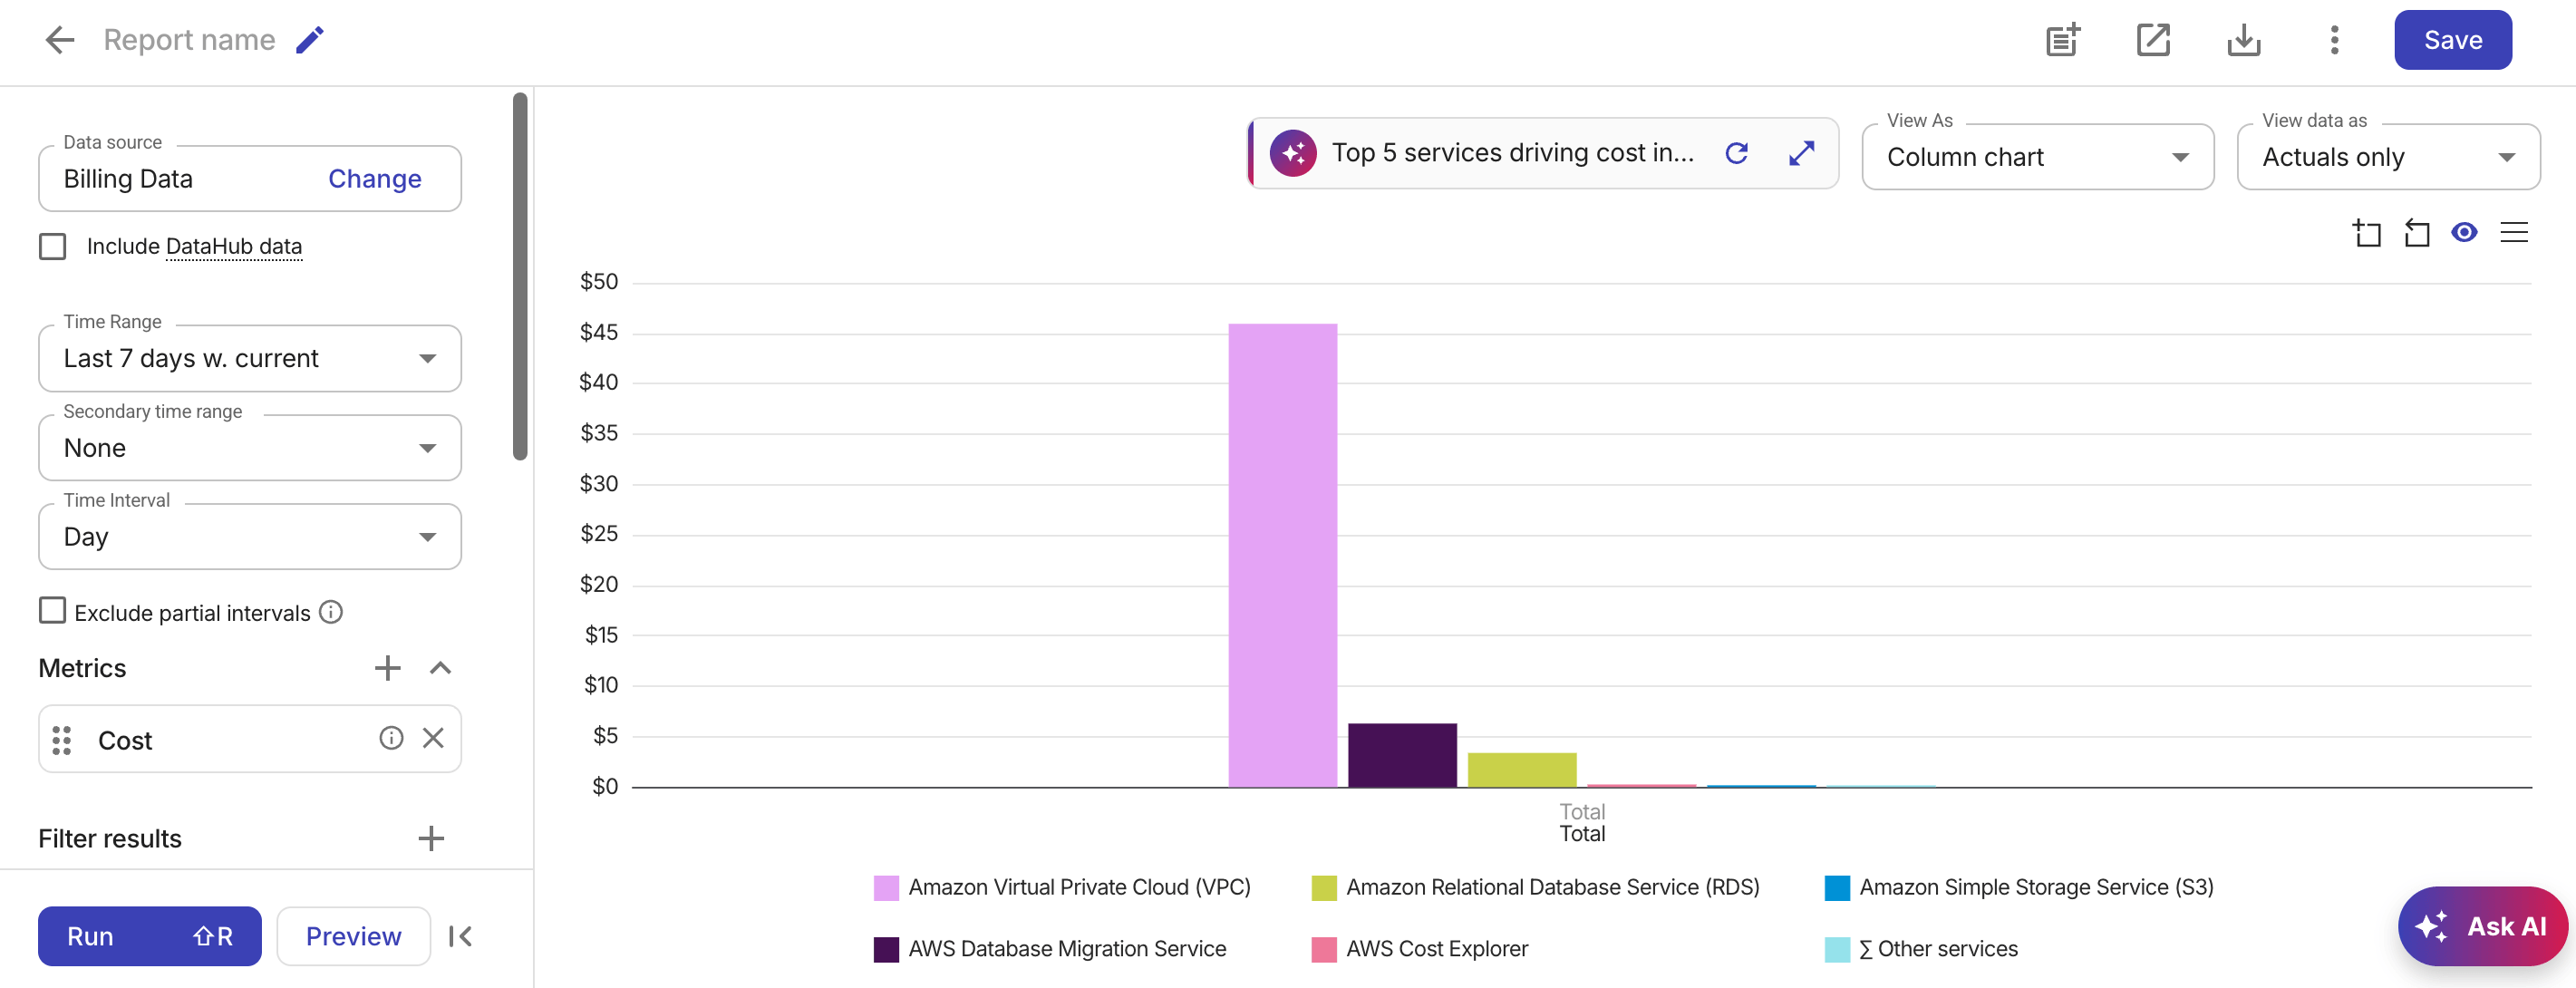
-
Review the generated report and make adjustments if needed. The copilot dock at the top of the report displays the prompt you used and lets you iterate without losing context.
See Edit report settings for more information.
-
Name your new report and select Save.
Build on an existing report
You can build a custom report based on an existing one, for example, a preset report, a managed report, or a custom report created by others.
If you're on the main Reports page:
-
Locate the report of interest.
-
Select the kebab menu (⋮) at the rightmost end of the report entry.
-
Select Duplicate.
If you're viewing a report, follow either of the approaches below:
-
Modify the report and then select Save as to save the customized version as a new report.
-
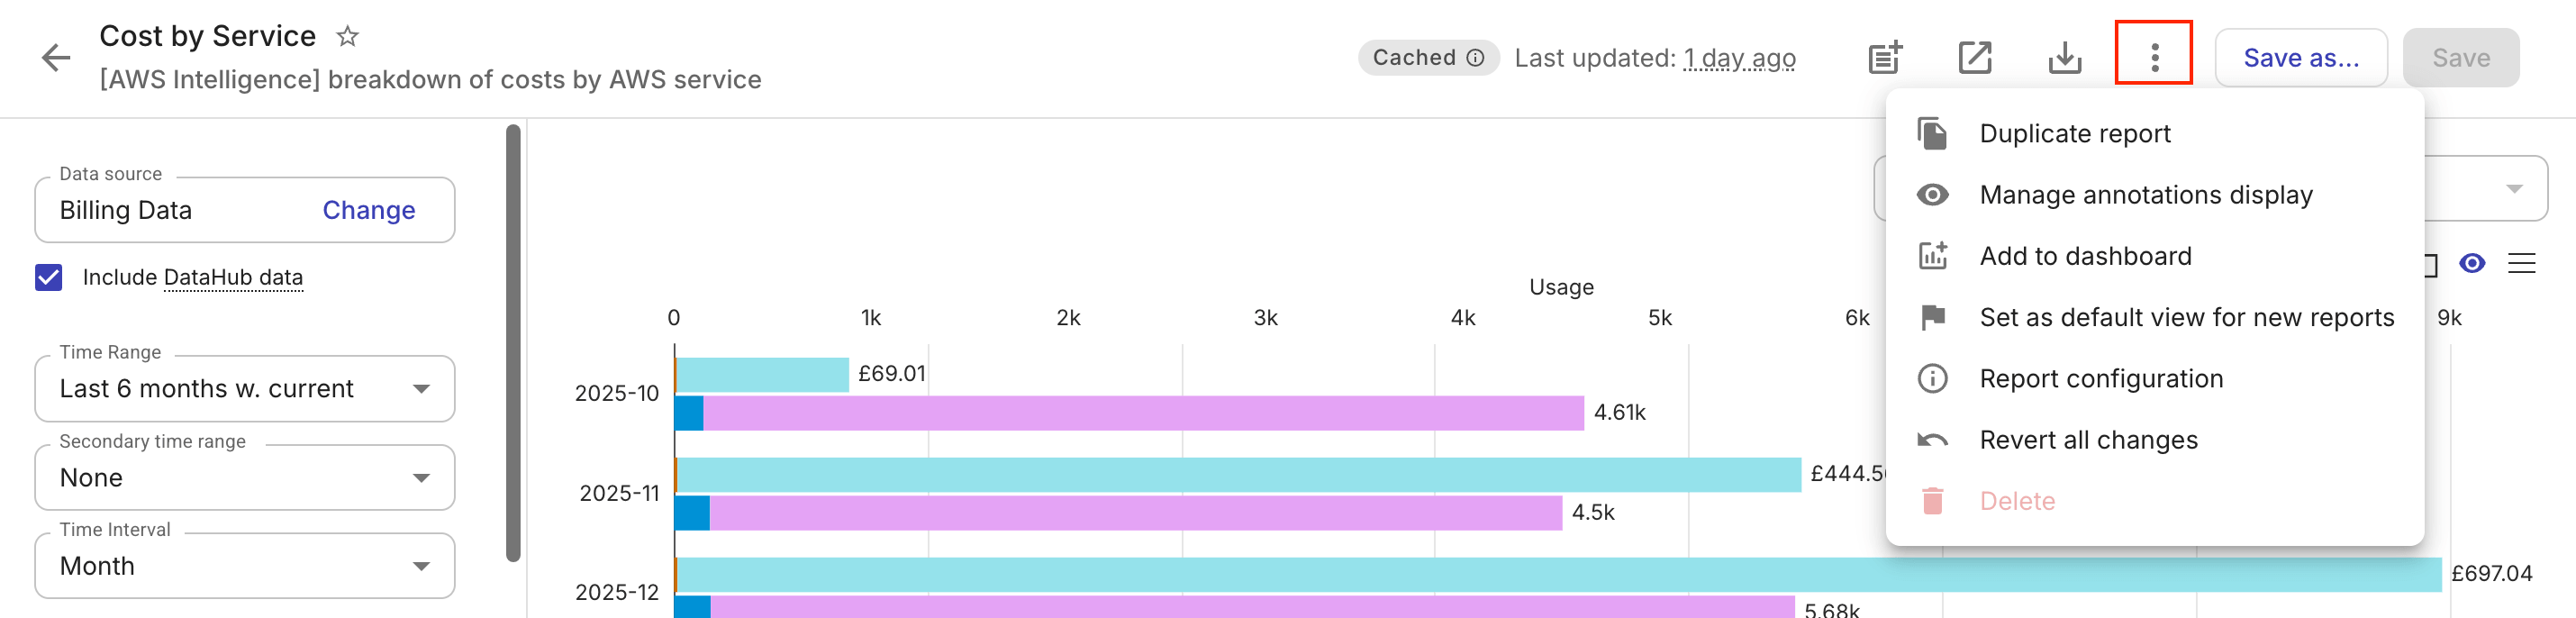
Select the kebab menu (⋮) in the report title bar, and then select Duplicate report.
Set as default view
To save the current report's configuration as your personal default starting point (default view) for new reports:
-
Select the kebab menu (⋮) in the report title bar.
-
Select Set as default view for new reports.
The default view is associated with your account. Once set, any new report you create will start with the default view.
You cannot clear the default view. To overwrite the current default view, open a report with the desired configuration and set it as the new default view.
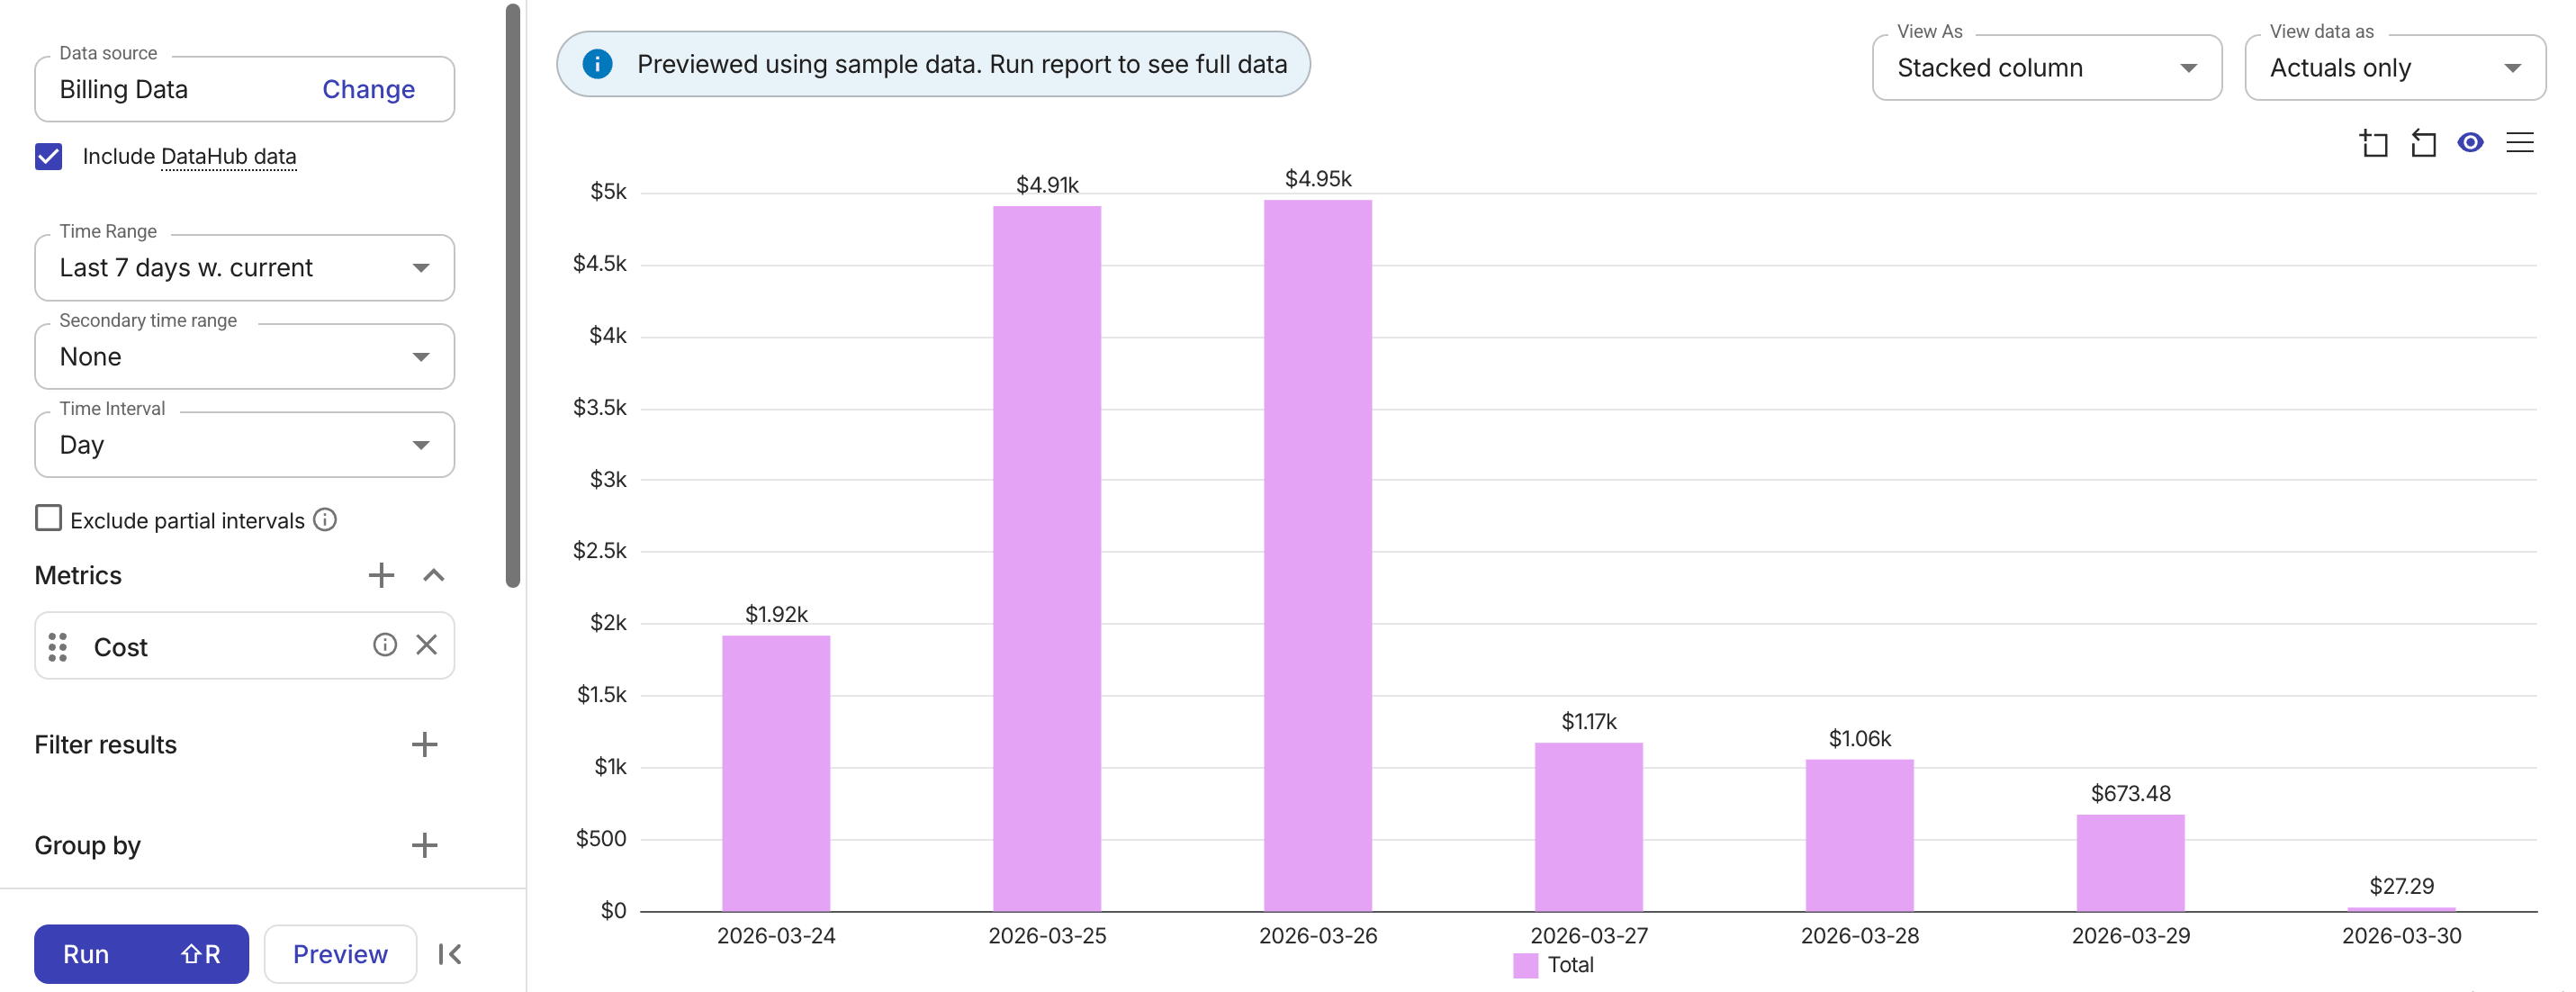
Preview a report
When working with large datasets, it often helps to run the report using a sample of your data first. The reduced wait time allows you to quickly validate and iterate on filters, groups, and other report settings, ensuring your configuration is correct before processing the full dataset.
To run a report with sample data, select Preview next to Run.
The preview uses 10% of the entire dataset.
Best practices
To improve the accuracy and effectiveness when building reports, consider the best practices listed below.
Filter and limit results of high cardinality dimensions
High cardinality dimensions are data attributes with a large number of unique values. They increase the number of rows that the report must read and paginate before downloading the data to your browser and subsequently loading it into a chart or table, thereby slowing down the report generation.
When working with high cardinality dimensions such as Project/Account ID, Service, SKU, and Resource, always filter and limit results. This practice also helps overcome the Data points limits and Data ingestion limits.
Select provider
Manually set the Provider filter and review the Include DataHub data option to ensure accurate data representation.
When filtering for specific values, for example, Service is BigQuery, the Provider filter is automatically applied. However, the filter is not applied retrospectively to reports created in the past, nor if it's removed manually. In addition, using a partial match, regex match, or is not match does not automatically add the Provider filter.
In the context of multicloud reports, filtering to specific providers may present challenges. Nevertheless, it is considered best practice to minimize the amount of scanned data by employing the Provider dimension filter whenever feasible.
If you have ingested a substantial volume of DataHub data, it is essential to evaluate whether the data should be included based on the purpose of your report.
Filter with exact match
Filtering with the is mode is the most efficient method for constructing reports. Employing an equality filter reduces the volume of data that needs to be scanned, thereby improving performance.
Other filtering modes, such as regex and partial match, do not utilize the search indexes and as a result offer less performance improvement compared to the is mode.
Be cautious with forecasts
Be aware that using forecast may increase the report processing time.
Cached reports
If you select Cache report, note that cached reports function as background jobs and share resources with other processes running in the background. Consequently, the performance of cached reports is heavily influenced by the current workloads and can vary considerably.