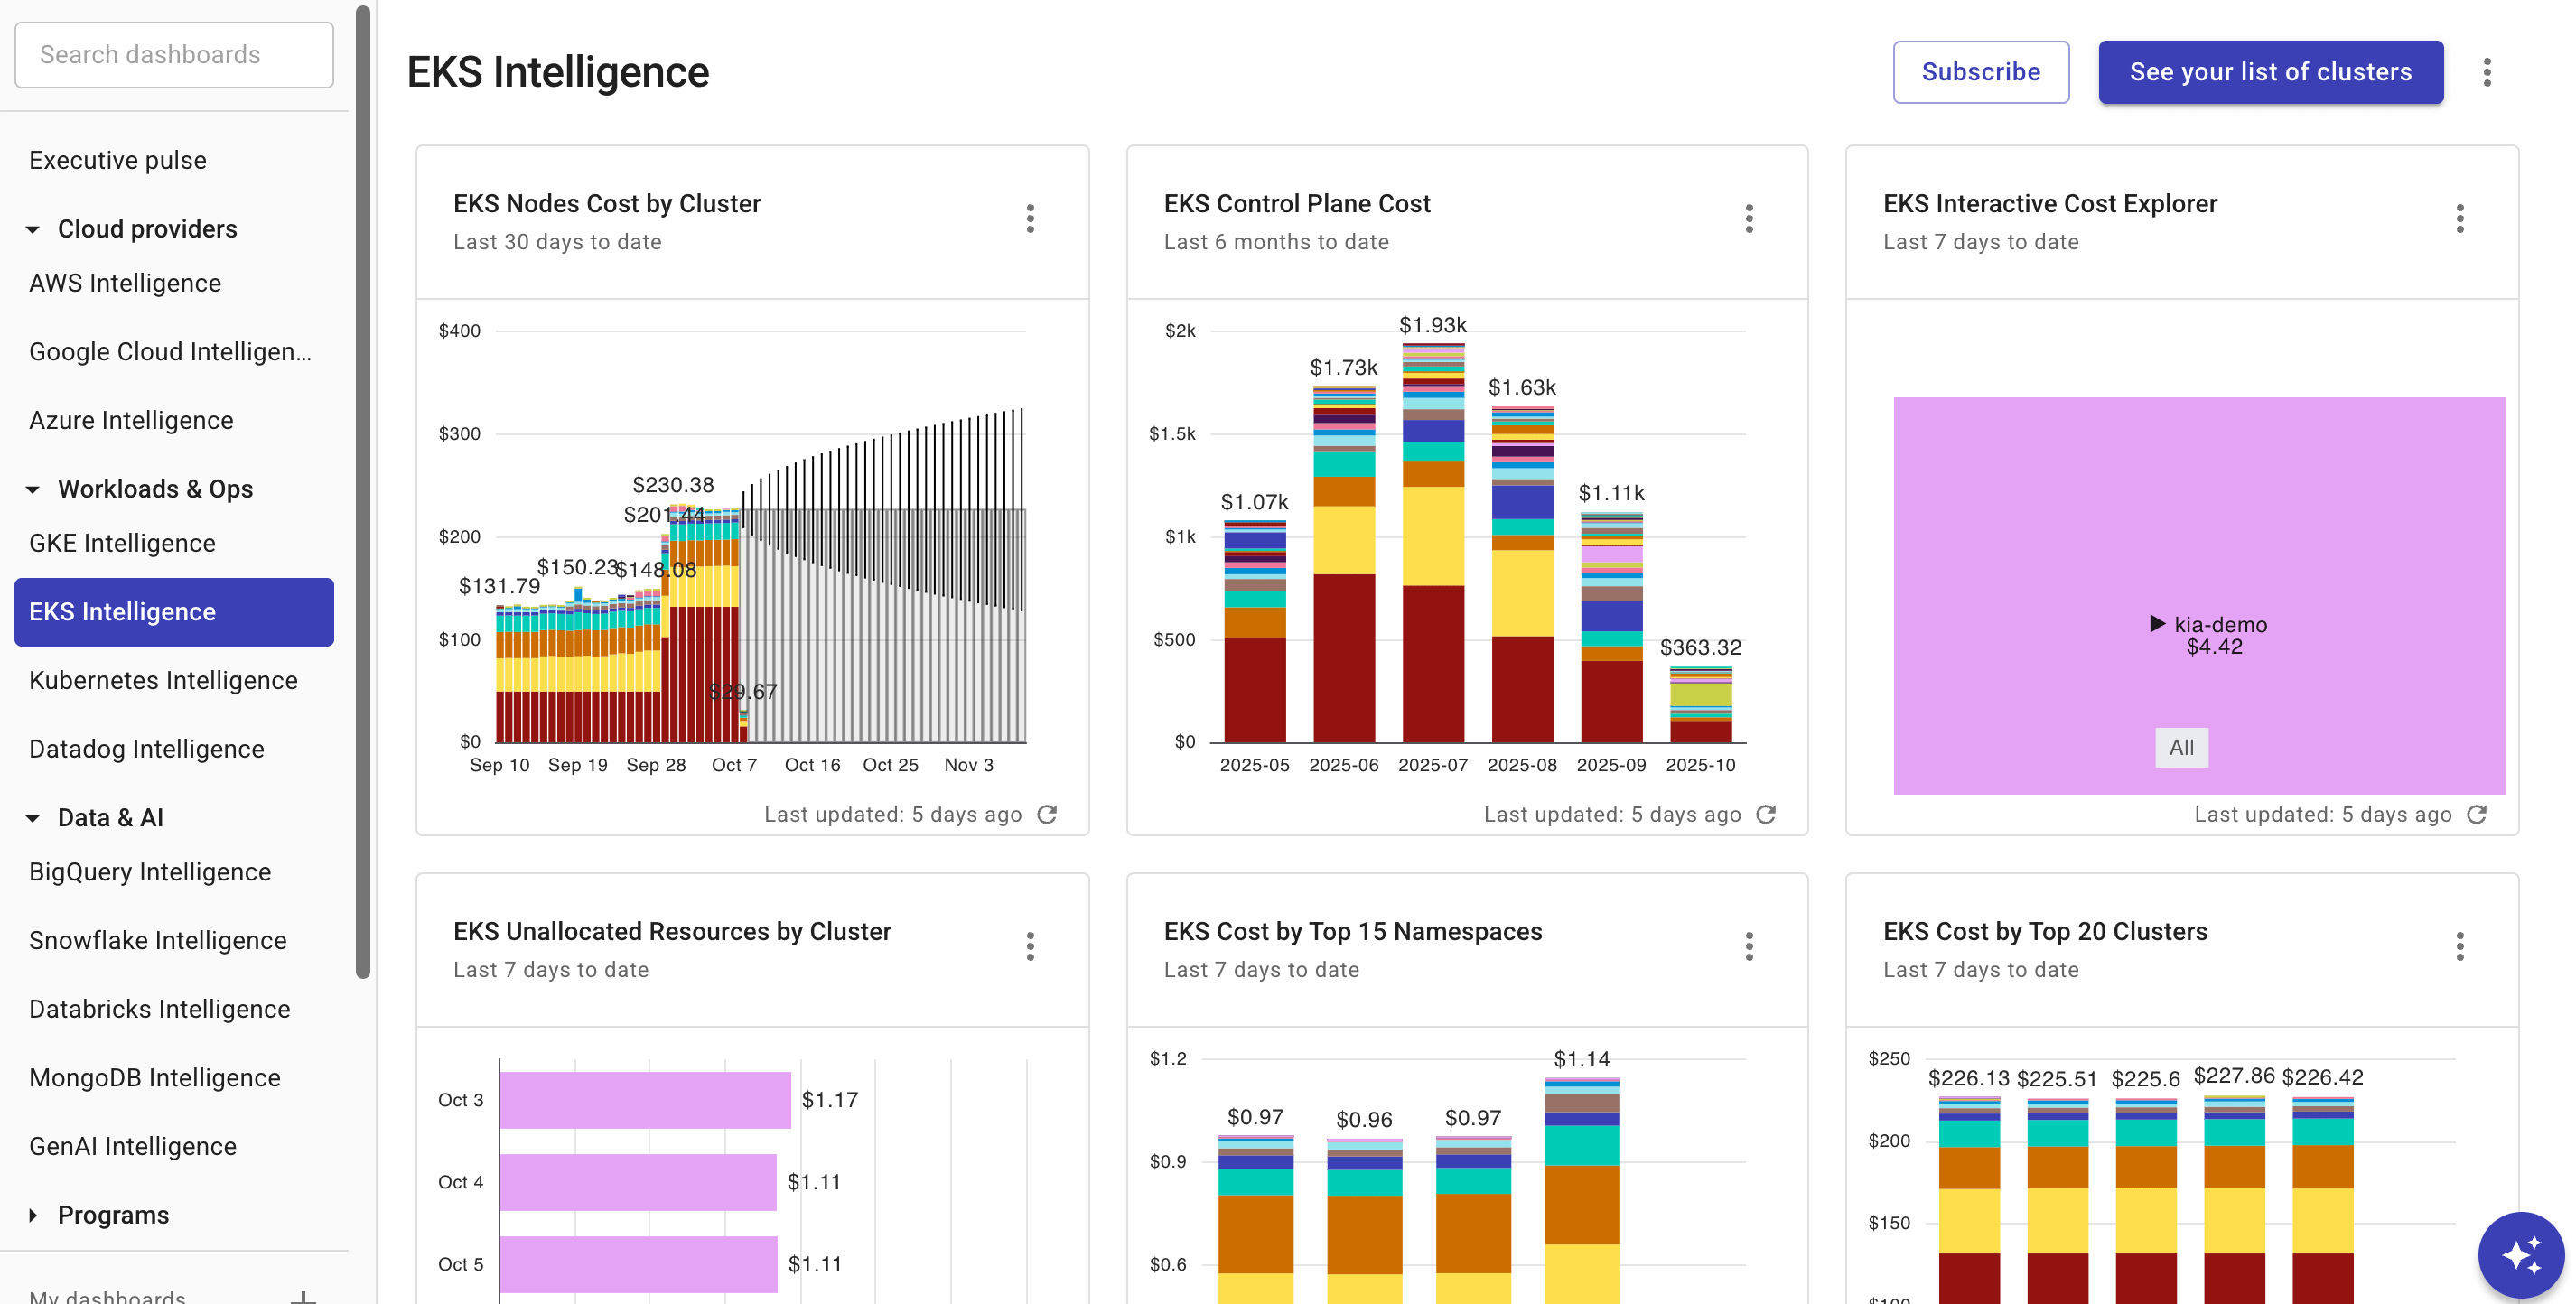
EKS Intelligence dashboard
EKS Intelligence helps you identify and track Amazon Elastic Kubernetes Service (Amazon EKS) cost and usage for clusters running on Amazon EC2 nodes.
Required permission
To access EKS Intelligence, your DoiT account needs the Cloud Analytics User permission.
EKS Intelligence dashboard
The EKS Intelligence dashboard consists of multiple preset report widgets that highlight various aspects of your Amazon EKS spend. Make sure to install the Kubernetes Intelligence agent on your clusters in order to see all the EKS metrics.
To access the EKS Intelligence dashboard, select Dashboards from the top navigation mega menu, then select EKS Intelligence.
-
Widgets on the dashboard are updated independently of each other. See Refresh report data for more information.
-
For each report, you can Open full report to check the report configuration or customize the preset report to create your own one.
-
Selecting See your list of clusters will open the EKS clusters page, where you can check the status of your EKS clusters.
EKS Nodes Cost by Cluster
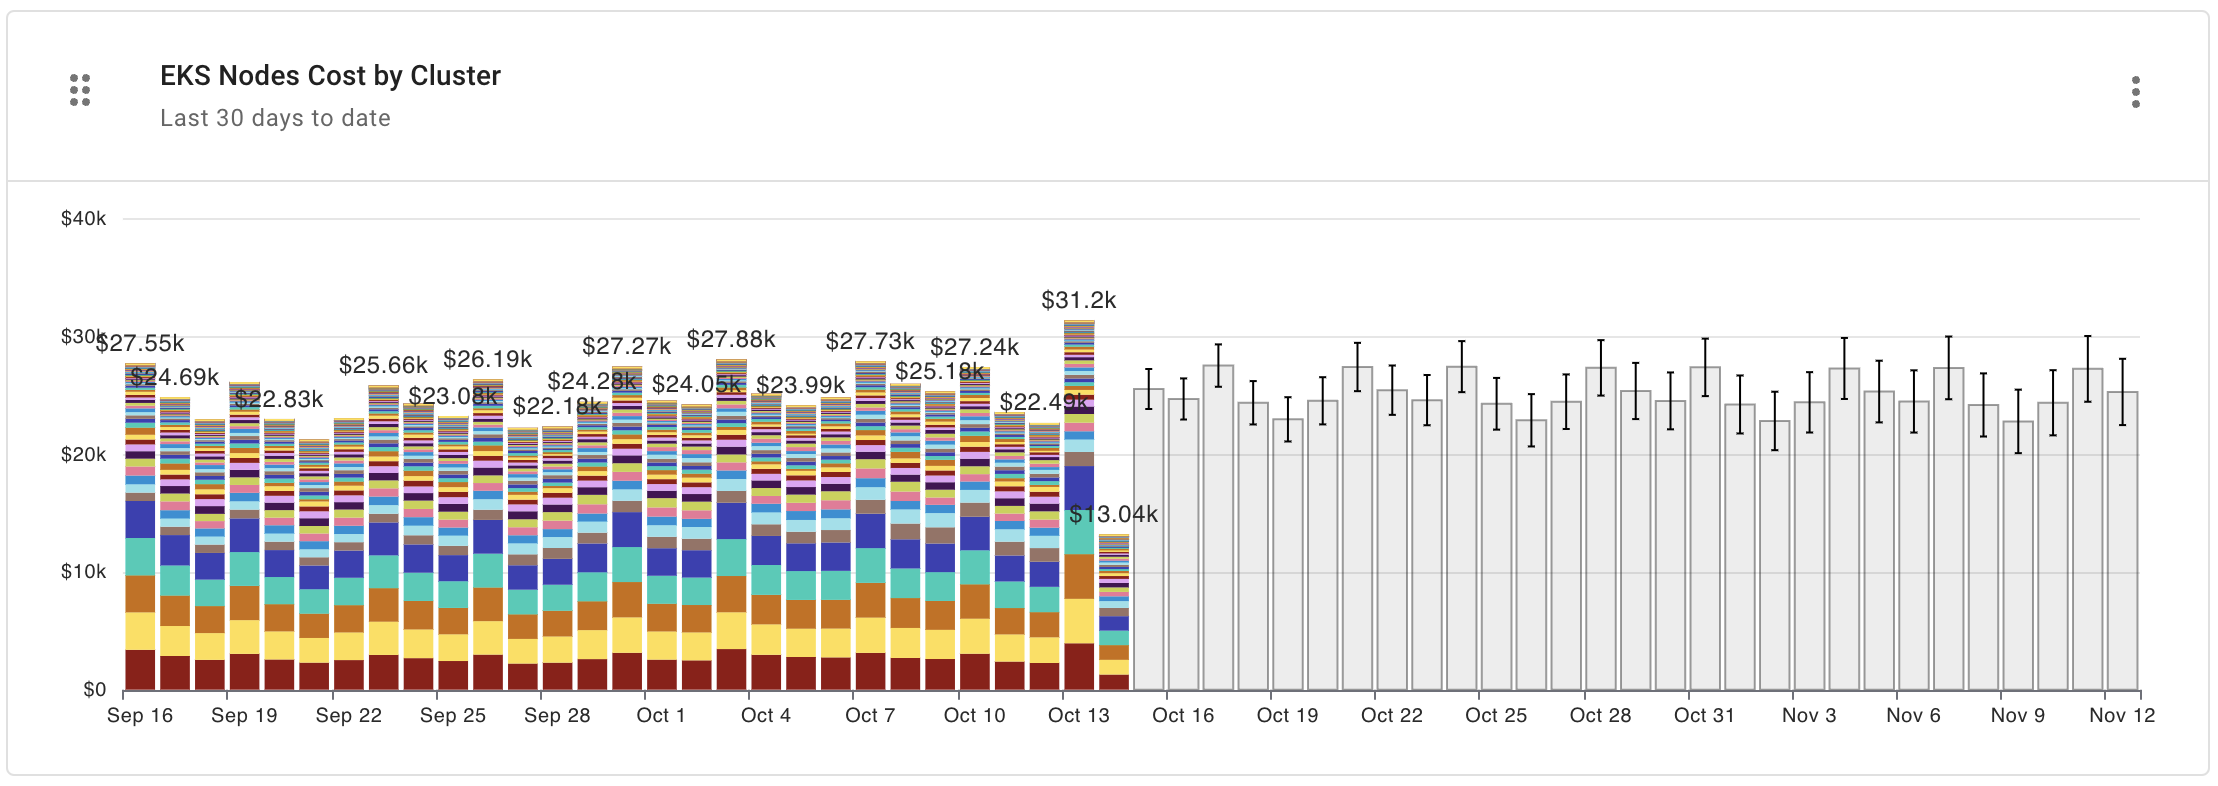
Report configuration:
- Metric: Cost
- Time Range: Last 30 days (include current day)
- Time Interval: Day
- Filters:
- Provider equals
Amazon Web Services - Service equals
Amazon Elastic Compute Cloud (EC2)
- Provider equals
- Group by: EKS cluster name
- Advanced options:
- Advanced Analysis: Forecast
EKS Control Plane Cost
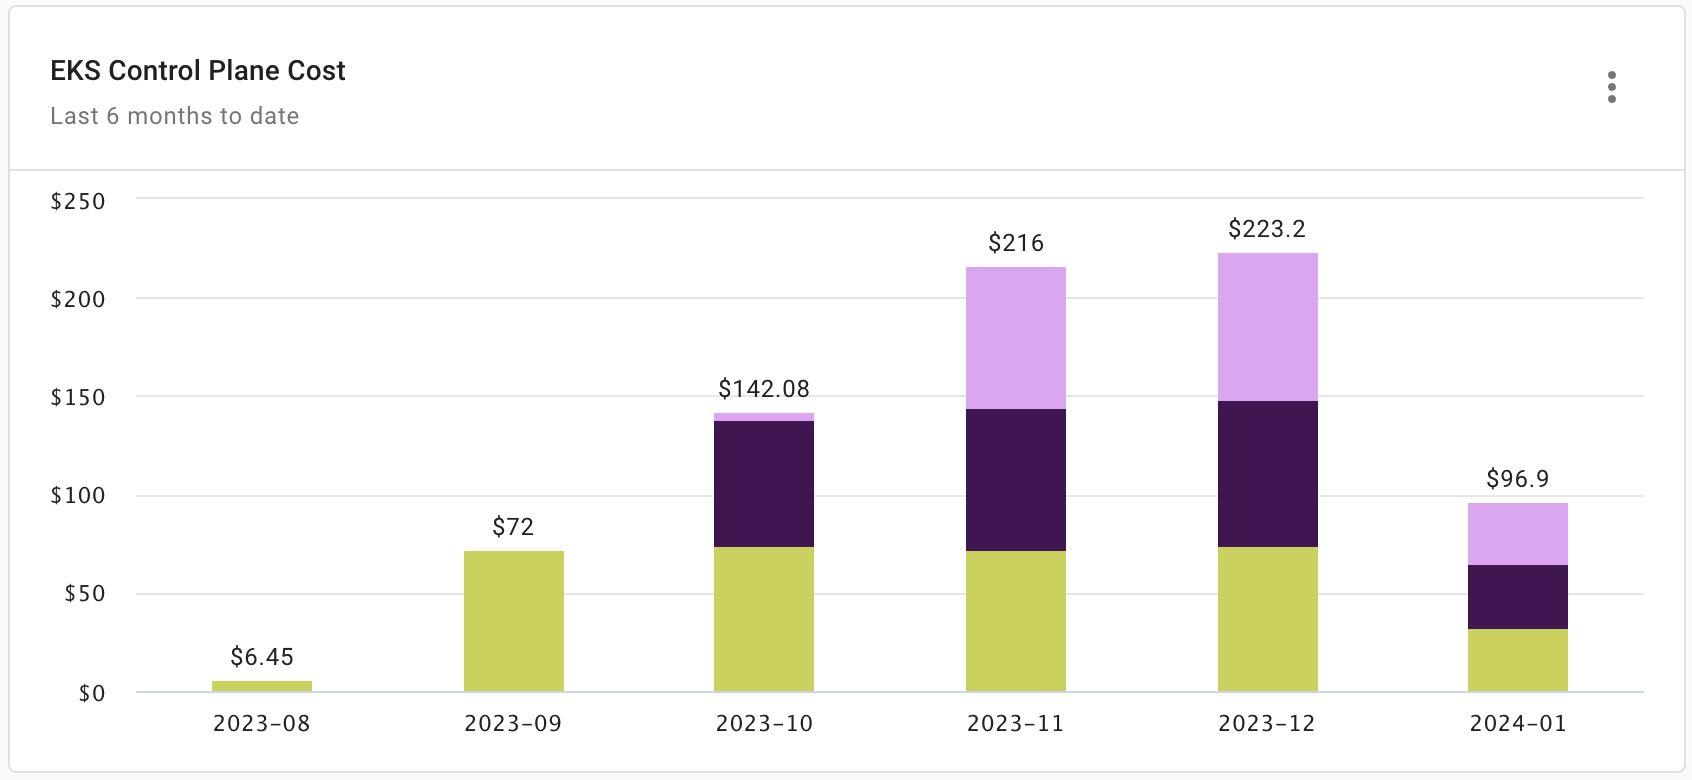
Report configuration:
- Metric: Cost
- Time Range: Last 6 months (include current month)
- Time Interval: Month
- Filters:
- Service equals
Amazon Elastic Container Service for Kubernetes (EKS)
- Service equals
- Group by: EKS cluster name, Region
EKS Interactive Cost Explorer
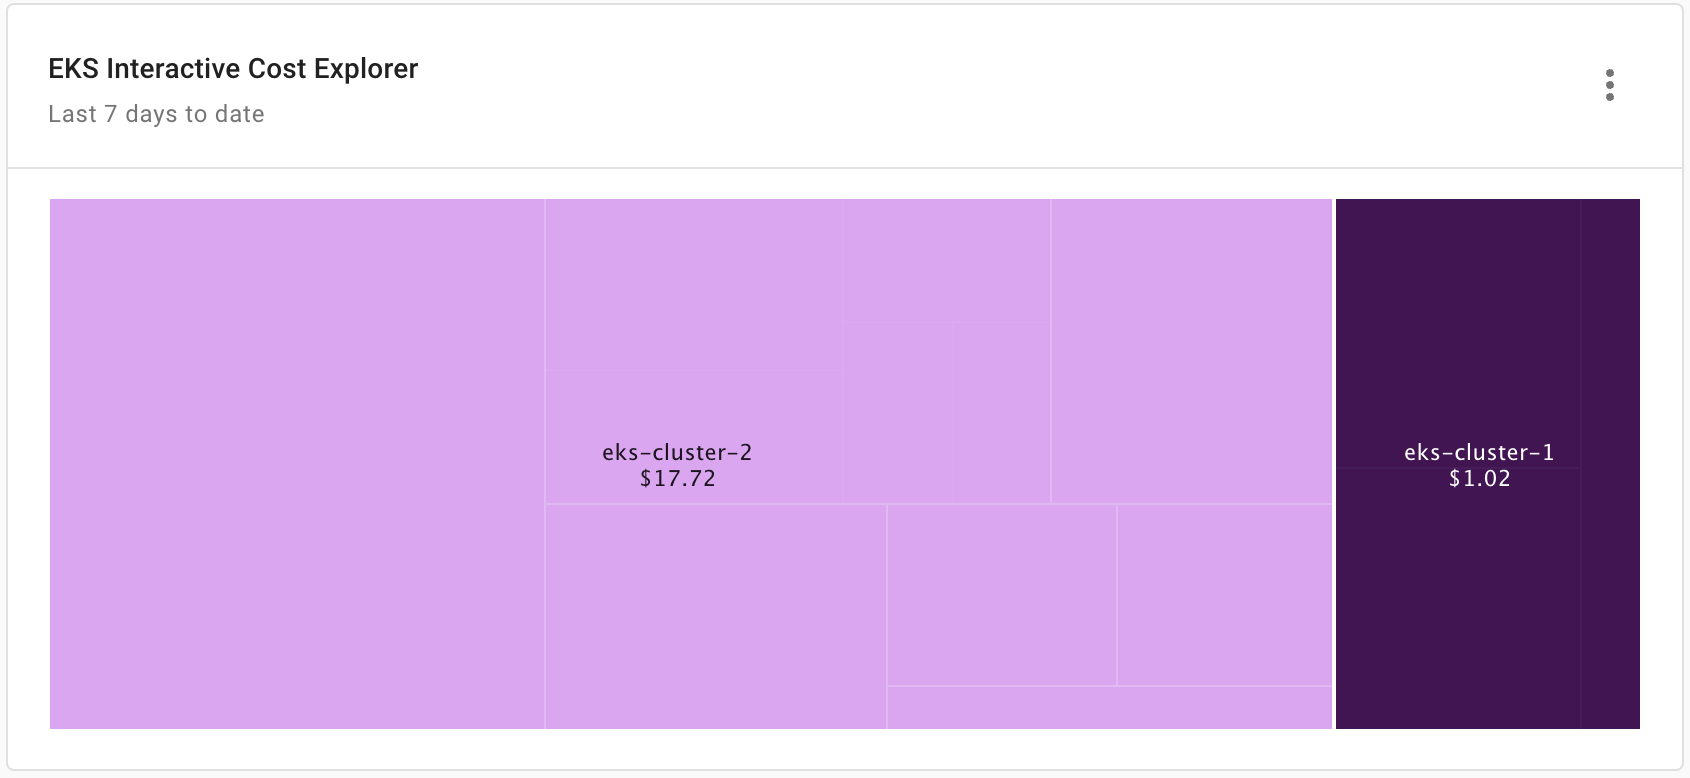
The EKS Interactive Cost Explorer is a treemap that allows you to drill down from clusters to namespaces and apps.
Report configuration:
- Metric: Cost
- Time Range: Last 7 days (include current day)
- Time Interval: Day
- Filters:
- EKS cluster name not equals
[Label N/A] - EKS namespace not equals
[Label N/A]
- EKS cluster name not equals
- Group by: EKS cluster name, EKS namespace, EKS label_k8s_app
EKS Unallocated Resources by Cluster
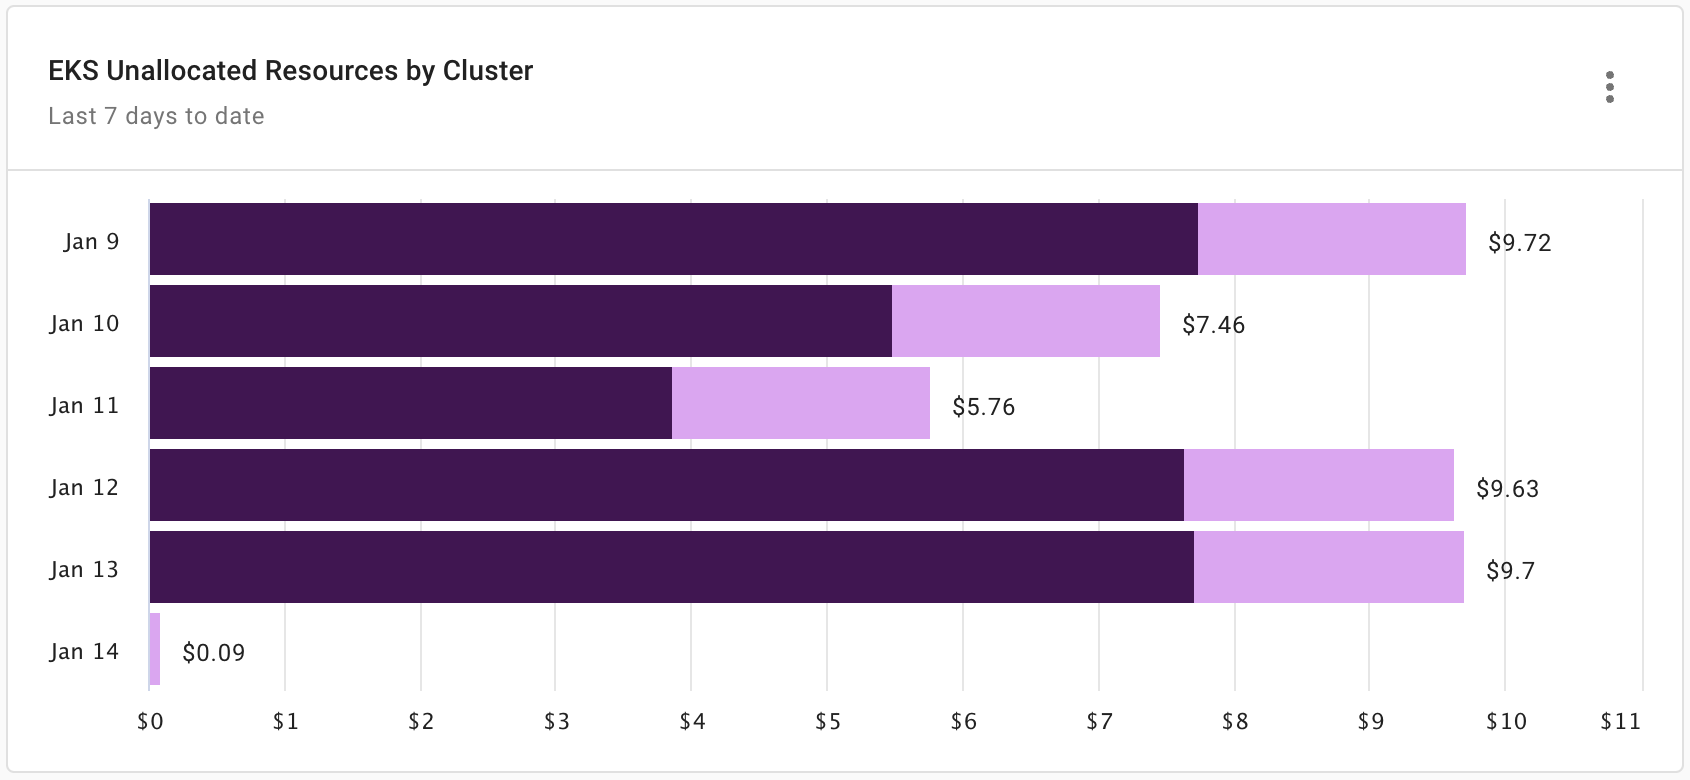
Report configuration:
- Metric: Cost
- Time Range: Last 7 days (include current day)
- Time Interval: Day
- Filters:
- EKS cluster name not equals
[Label N/A] - EKS pod_owner_name equals
UNREQUESTED_COSTS
- EKS cluster name not equals
- Group by: EKS cluster name, EKS pod_owner_name
EKS Cost by Top 15 Namespaces
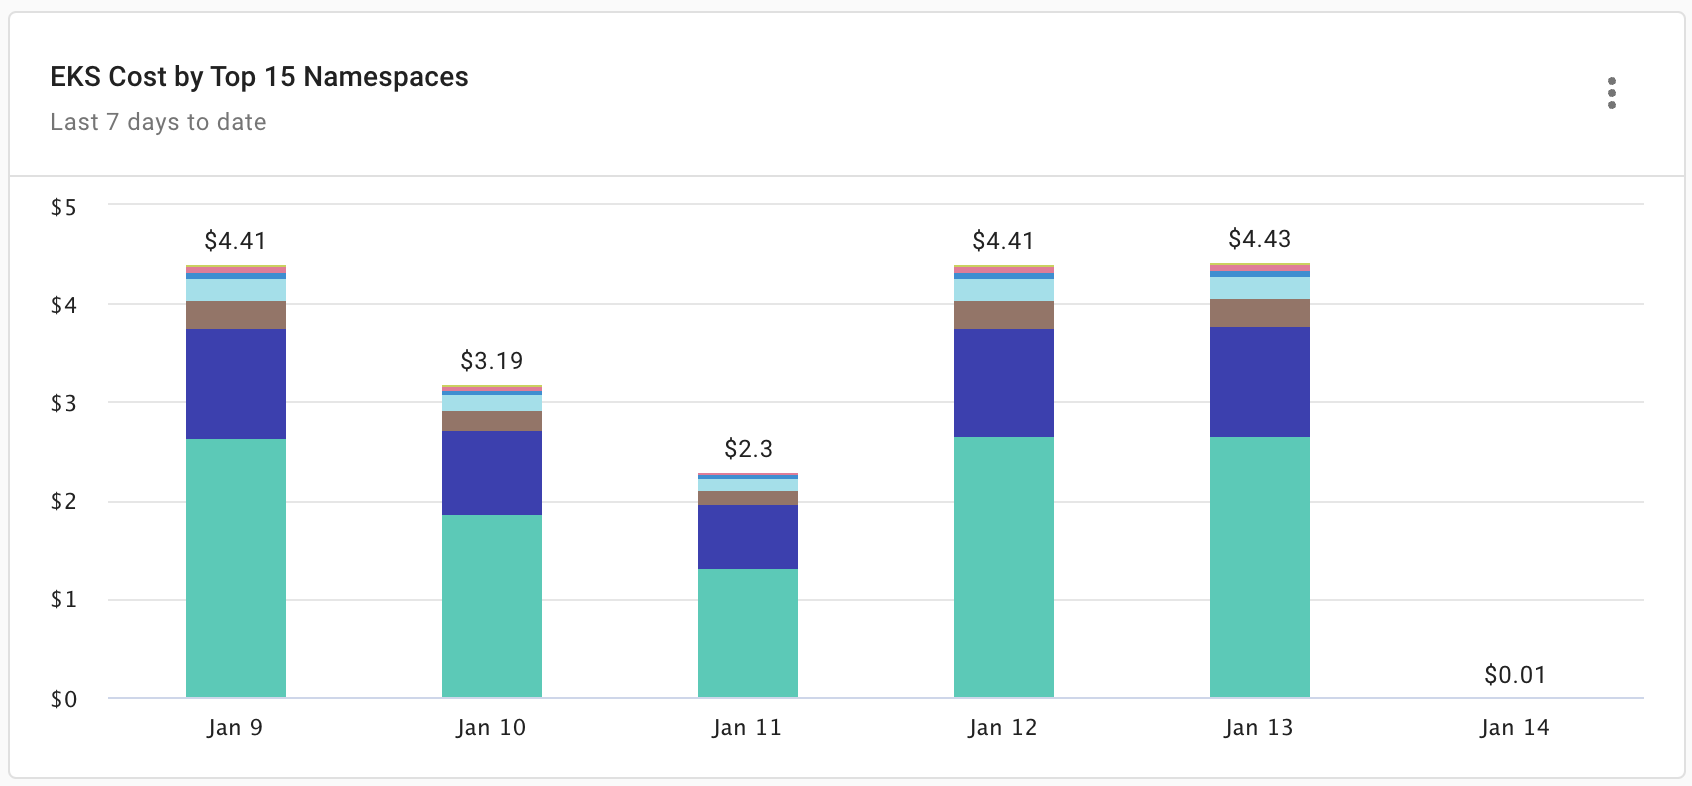
Report configuration:
- Metric: Cost
- Time Range: Last 7 days (include current day)
- Time Interval: Day
- Filters:
- EKS namespace not equals
[Label N/A] - EKS pod_owner_name equals
UNREQUESTED_COSTS
- EKS namespace not equals
- Group by: EKS namespace
- Limit results: Limit to top 15 by cost
EKS Cost by Top 20 Clusters
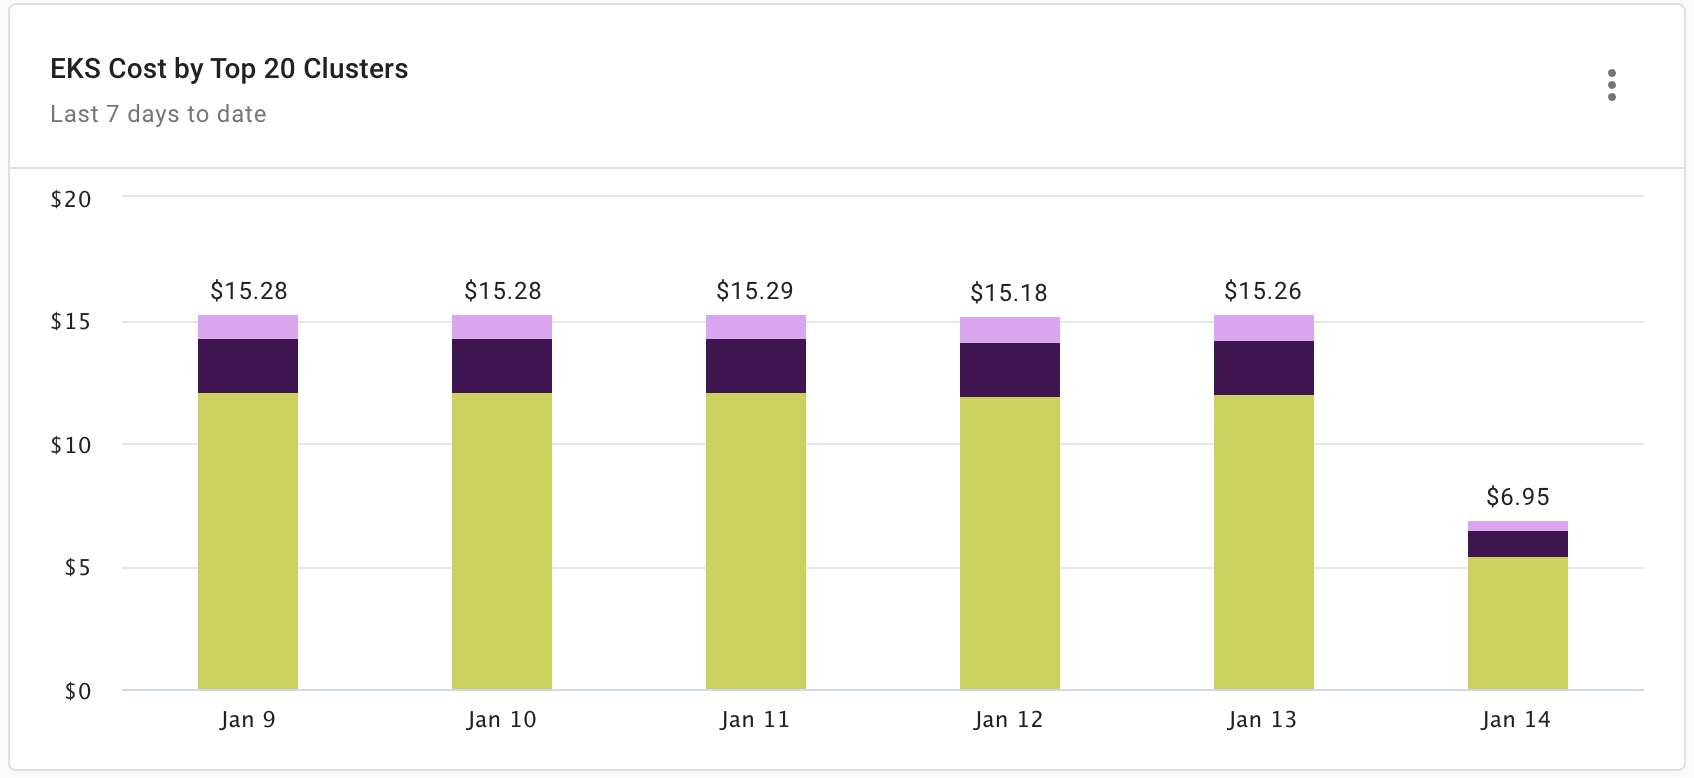
Shows the top 20 EKS clusters by cost in the last 7 days.
Report configuration:
- Metric: Cost
- Time Range: Last 7 days (include current day)
- Time Interval: Day
- Filters:
- EKS cluster name not equals
[Label N/A]
- EKS cluster name not equals
- Group by: EKS cluster name
- Limit results: Limit to top 20 by cost
EKS Clusters Utilization
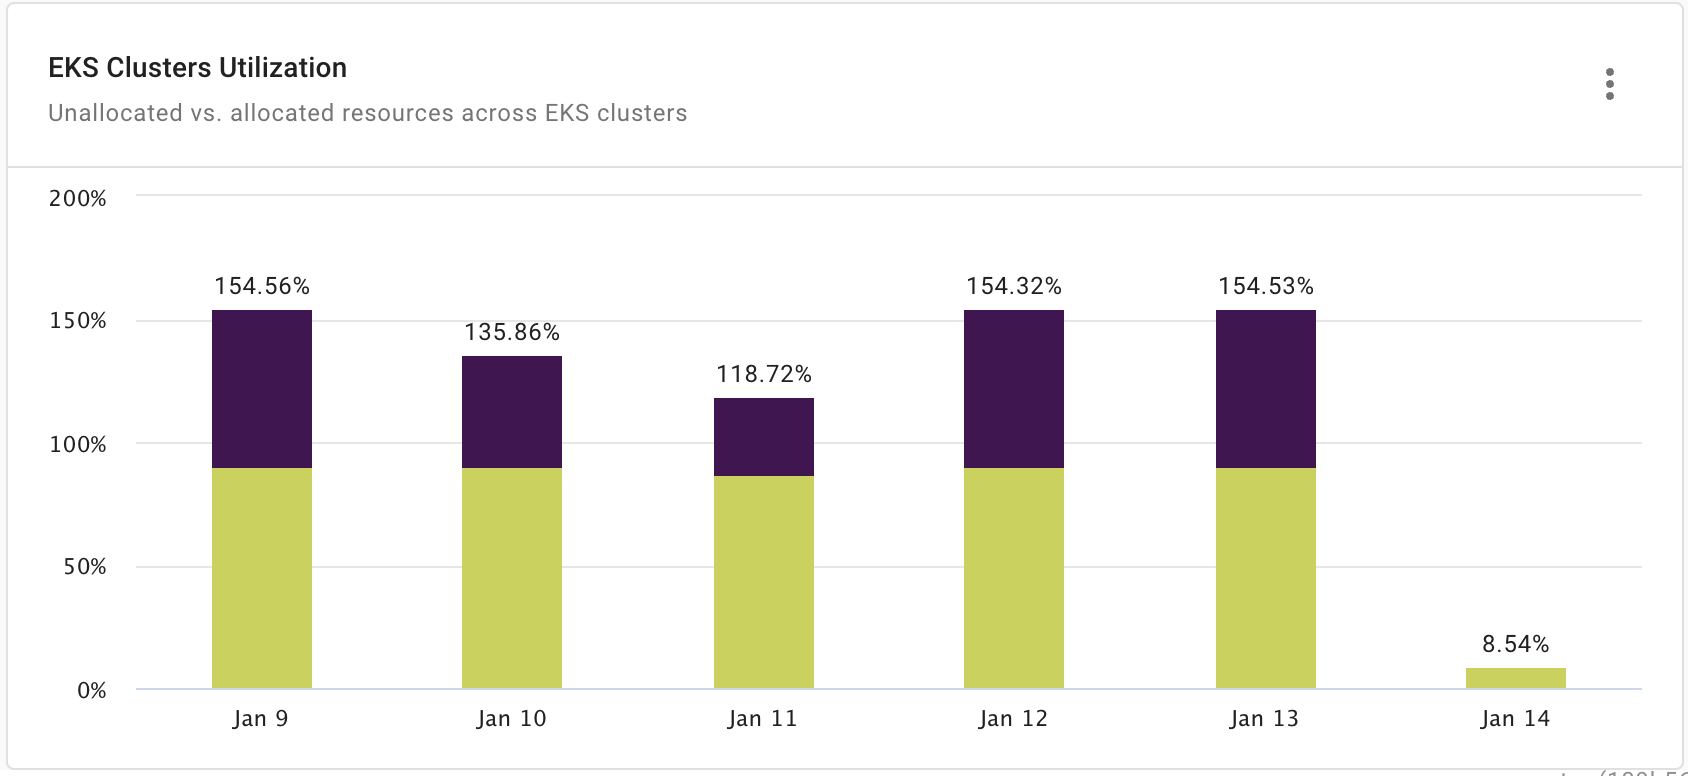
Shows the utilization of resources across EKS clusters.
Report configuration:
- Metric: EKS Capacity Utilization
- Time Range: Last 7 days (include current day)
- Time Interval: Day
- Filters:
- Allocation rule is
EKS Allocated ResourcesorEKS Unallocated Resources - EKS cluster name not equals
[Label N/A]
- Allocation rule is
- Group by: EKS cluster name