Google Cloud Intelligence
Google Cloud Intelligence helps you measure your Google Cloud spend against best practices and identify areas for improvement.
Required permission
To access Google Cloud Intelligence, your DoiT account needs the Cloud Analytics User permission.
Google Cloud Intelligence dashboard
The Google Cloud Intelligence dashboard consists of preset report widgets that highlight various aspects of your Google Cloud spend. It is automatically created when Google Cloud workloads are detected in your account.
To access the Google Cloud Intelligence dashboard, select Dashboard from the top navigation mega menu, and then select Google Cloud Intelligence.

Widgets on the dashboard are updated independently of each other. See Refresh report data for more information.
You can Open full report to check the report configuration or customize the preset report to create your own one.
Spend History
The Spend History widget shows a high-level view of your Google Cloud spend in the last 12 months with forecast for the next 12 months. It's an aggregated view of your usage trend and the associated cost across your organization.
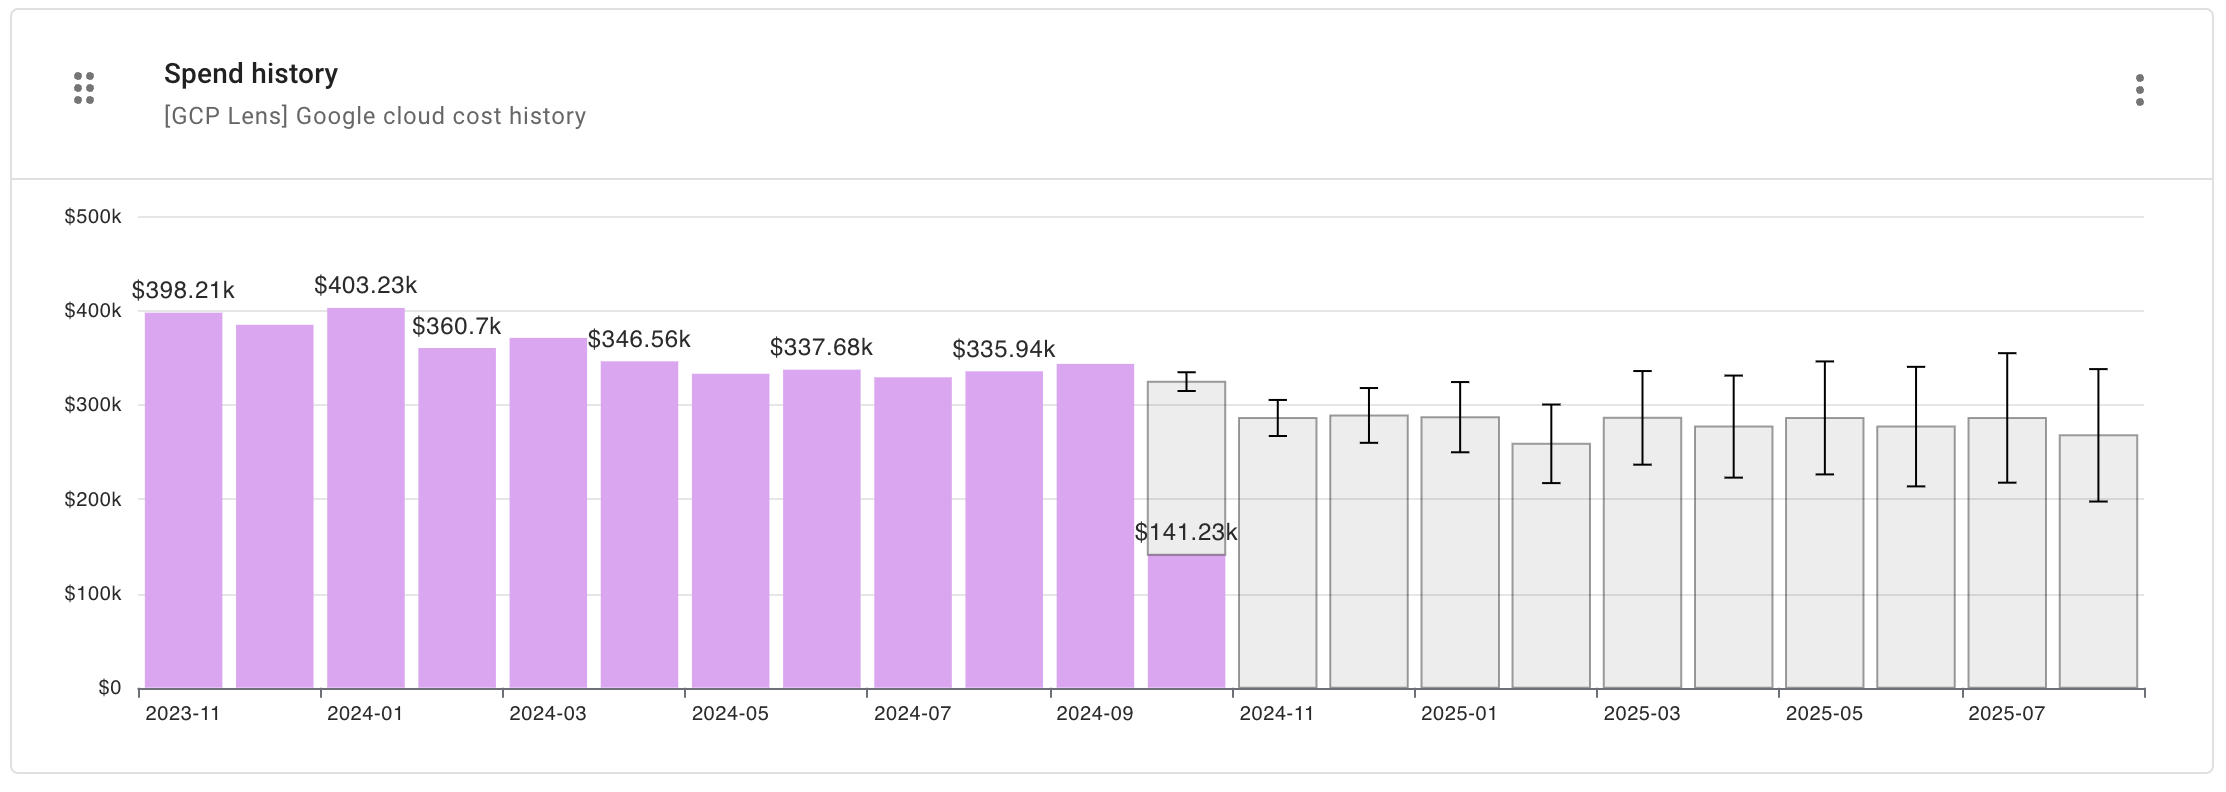
Report configuration:
- Metric: Cost
- Time Range: Last 12 months (include current month)
- Time Interval: Month
- Filter results:
- Cost Type not equals
Credit - Credit not matches regexp
^GFS Cloud - Provider equals
Google Cloud
- Cost Type not equals
- Group by: Provider
- Advanced Options:
- Advanced Analysis: Forecast
Cost By Top Service
The Cost By Top Service widget shows the top 10 Google Cloud services by cost in the last six months. It allows you to quickly identify the usage patterns of top services and unusual costs that you may want to investigate.
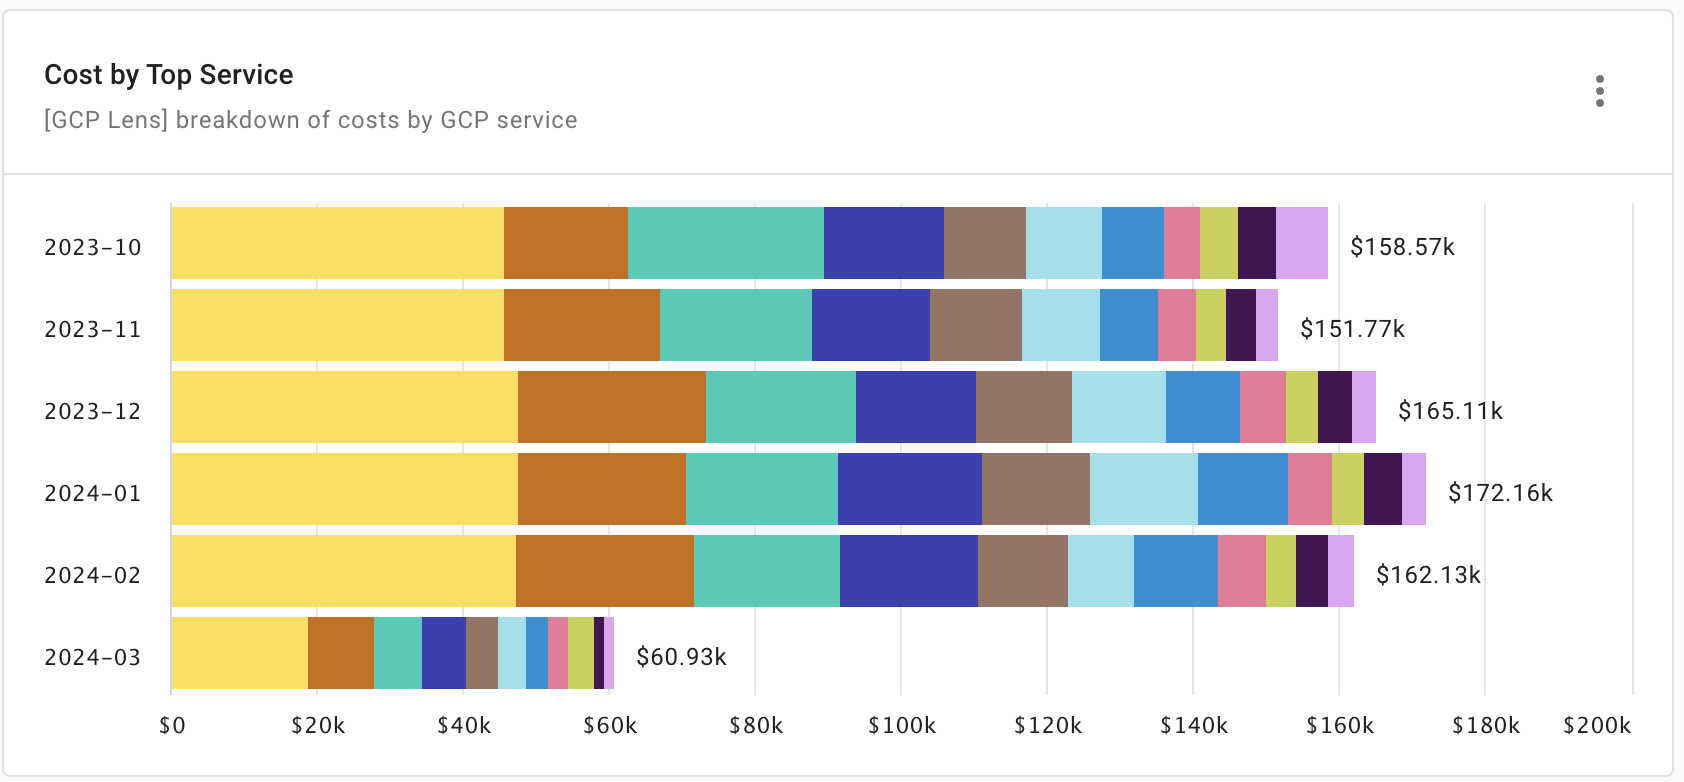
Report configuration:
- Metric: Cost
- Time Range: Last 6 months (include current month)
- Time Interval: Month
- Group by: Service
- Filter results:
- Provider equals
Google Cloud
- Provider equals
- Limit results:
- Limit Service to top 10 by cost
- Limit by value: Cost > US$0.00
Cost By Top Projects
The Cost By Top Projects widget shows the top 10 Google Cloud projects by cost in the last six months.
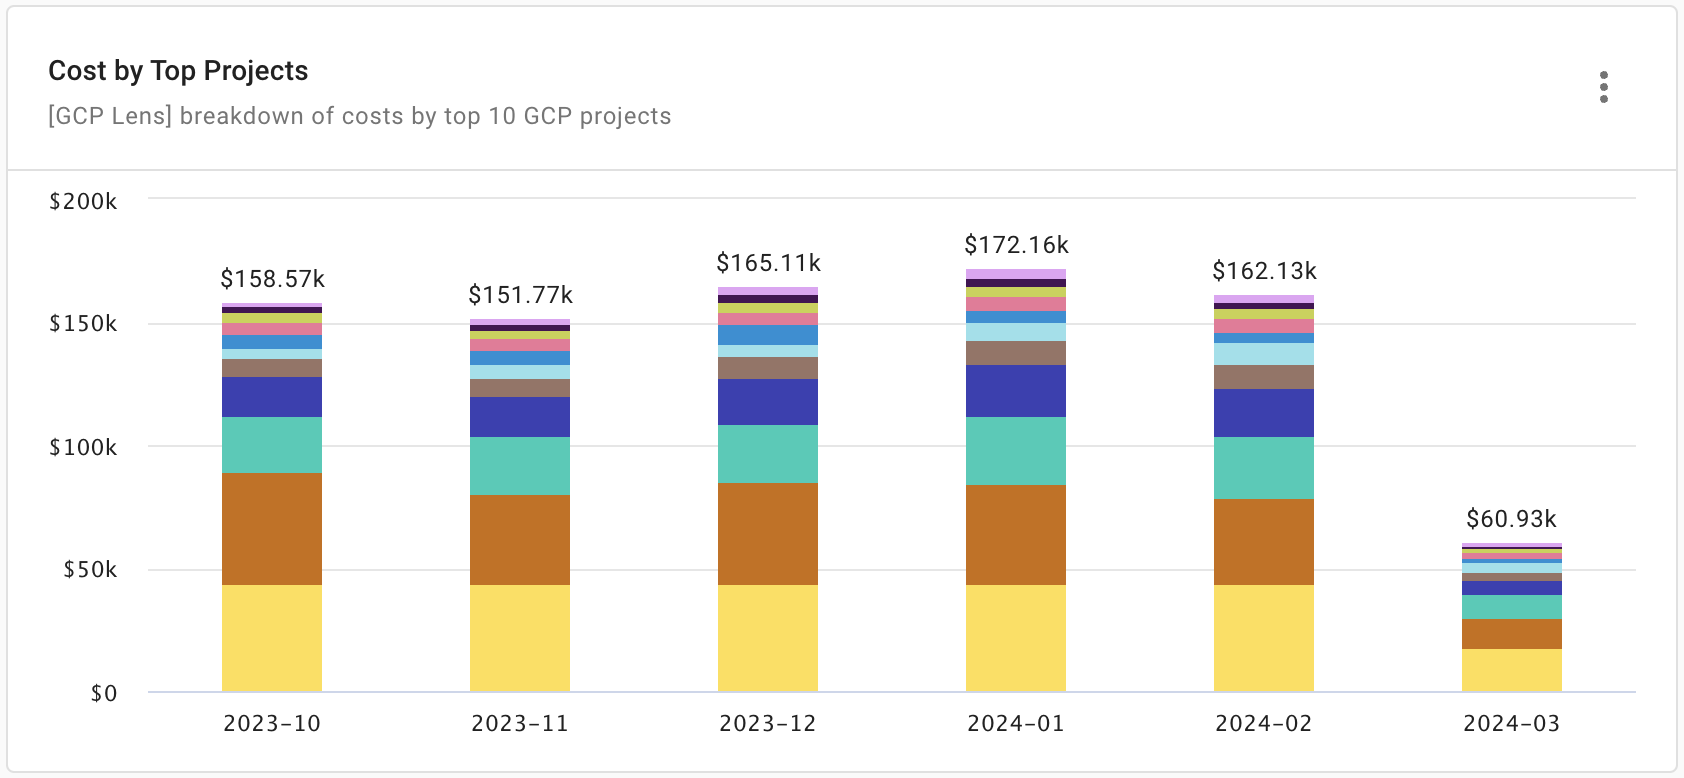
Report configuration:
- Metric: Cost
- Time Range: Last 6 months (include current month)
- Time Interval: Month
- Filter results:
- Provider equals
Google Cloud
- Provider equals
- Group by: Project/Account ID
- Limit results:
- Limit Project/Account ID to top 10 by cost
Cost By Top Regions
The Cost By Top Regions widget shows the top 10 Google Cloud regions by cost in the last 30 days, aggregated to monthly data.
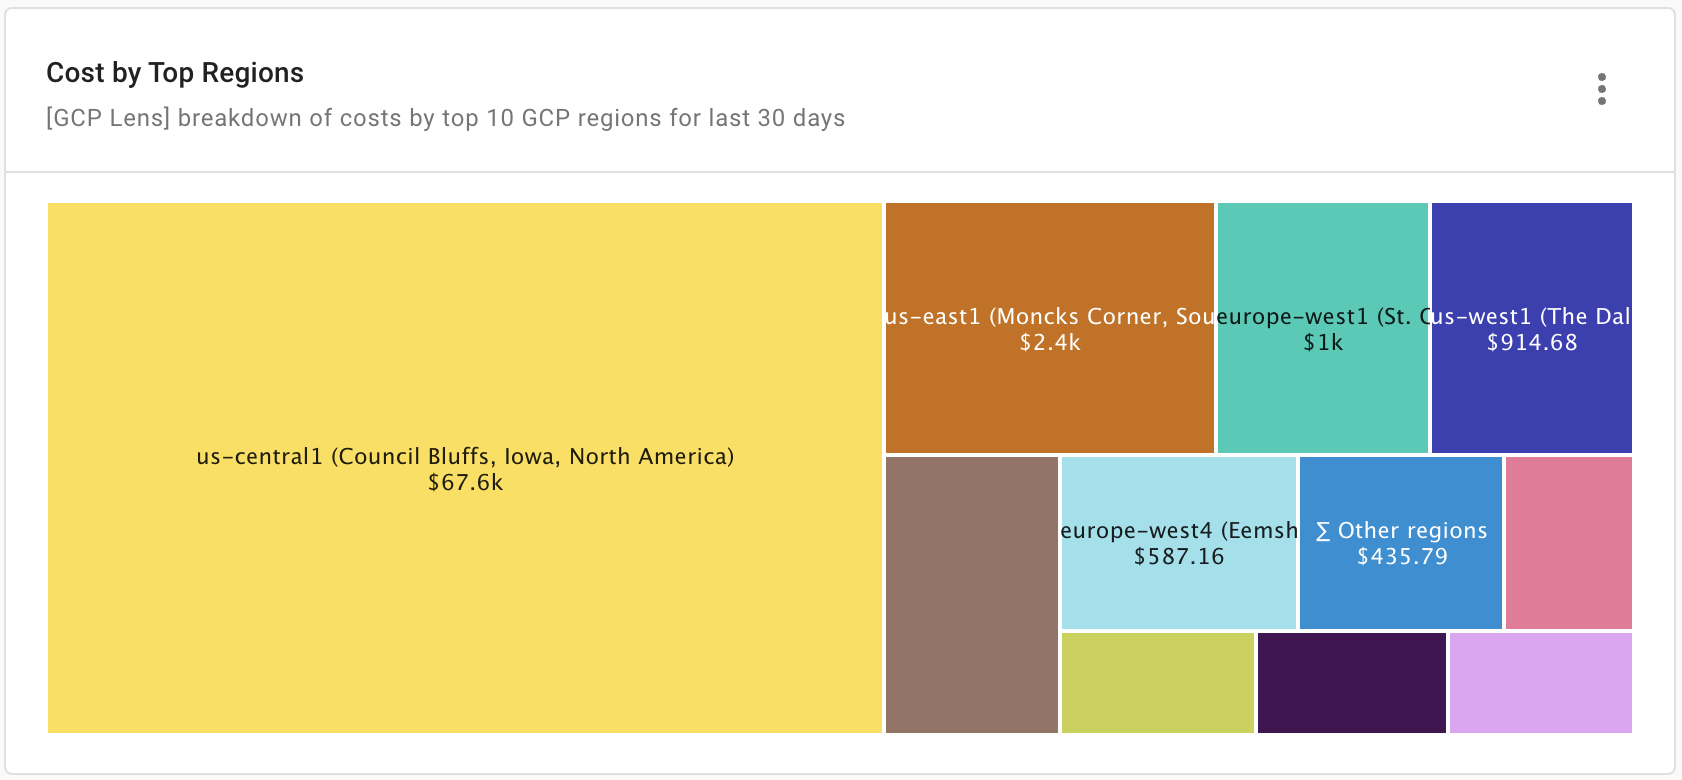
Report configuration:
- Metric: Cost
- Time Range: Last 30 days (include current day)
- Time Interval: Month
- Filter results:
- Provider equals
Google Cloud - Region not equals
[Region N/A]
- Provider equals
- Group by: Region
- Limit results:
- Limit Region to top 10 by cost
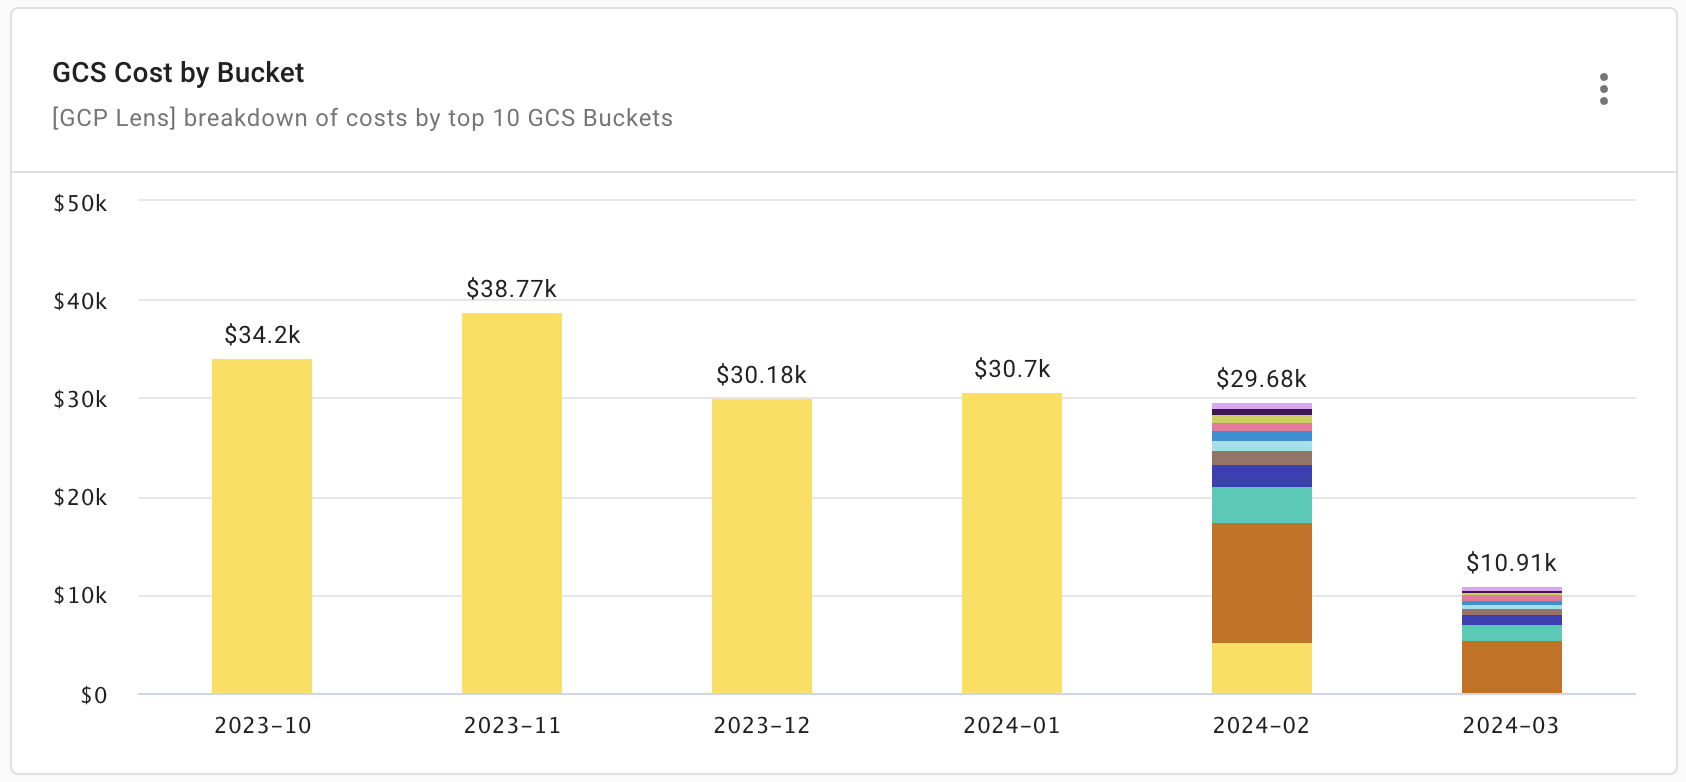
GCS Cost by Bucket
The first full day of granular Cloud Storage bucket-level cost data is February 13, 2024. See Identify granular cost data by service for more information.
The GCS Cost by Bucket widget shows a breakdown of your storage costs across GCS buckets and helps you identify high-cost buckets.
Report configuration:
- Metric: Cost
- Time Range: Last 6 months (include current month)
- Time Interval: Month
- Filter results:
- Provider equals
Google Cloud - Service equals
Cloud Storage (GCS) - Cost Type is not one of
CreditorCredit Adjustment
- Provider equals
- Group by: Global resource
- Limit results:
- Limit Global resource to top 10 by cost
- Limit by value: Cost not between -US$1.00 AND US$1.00
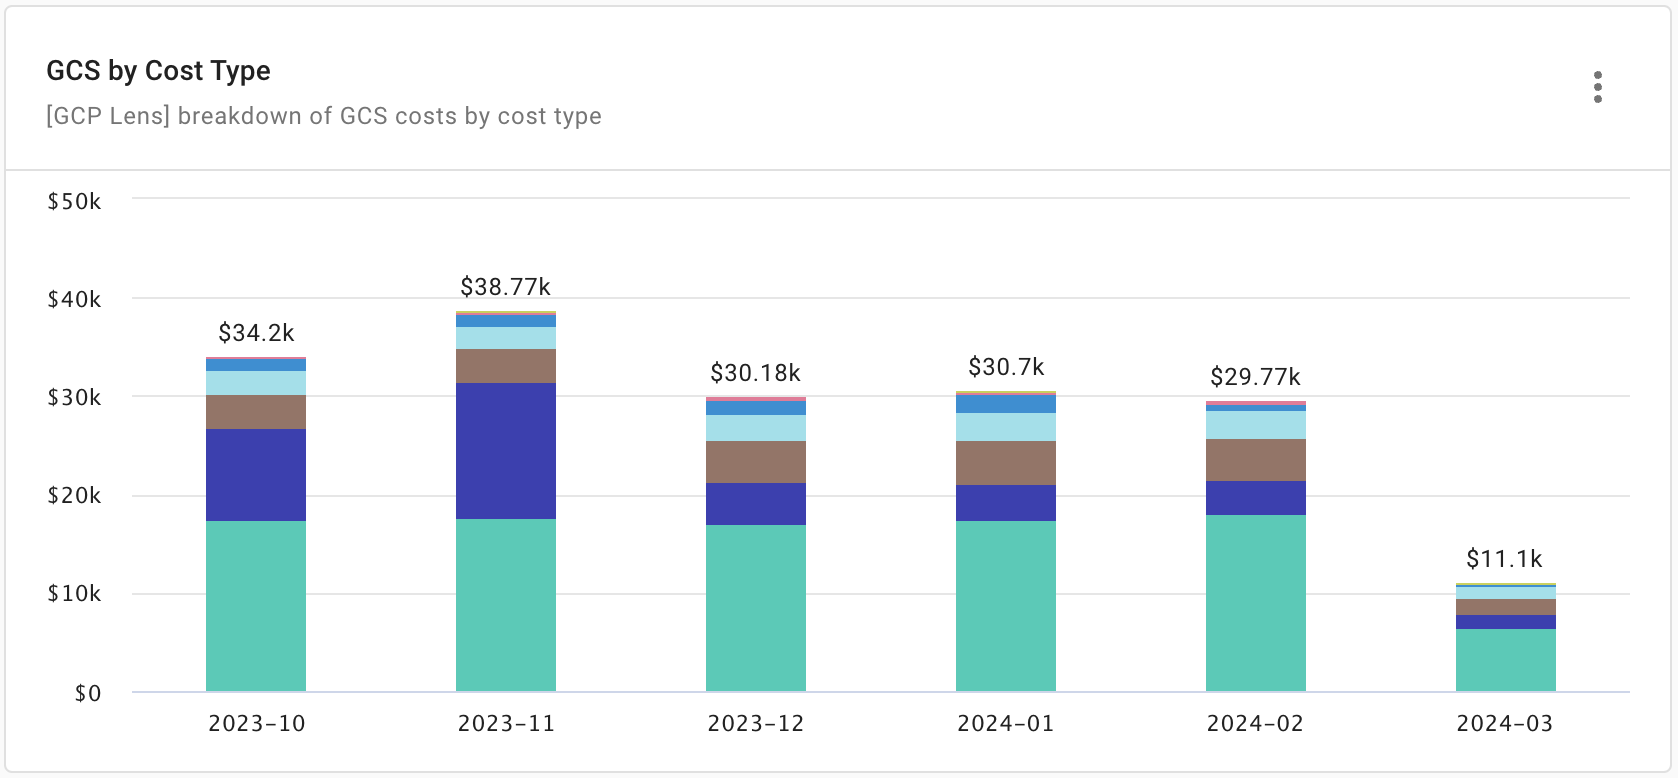
GCS by Cost Type
The GCS by Cost Type widget provides a GCS cost breakdown by cost type. It helps you understand your spending pattern, distinguish between different categories of expenses, such as storage, network, and operations costs, and target specific areas for cost optimization.
Report configuration:
- Metric: Cost
- Time Range: Last 6 months (include current month)
- Time Interval: Month
- Filter results:
- Provider equals
Google Cloud - Service equals
Cloud Storage (GCS) - Cost Type is not one of
CreditorCredit Adjustment
- Provider equals
- Group by: Google Cloud Storage
- Limit results:
- Limit by value: Cost not between -US$1.00 AND US$1.00
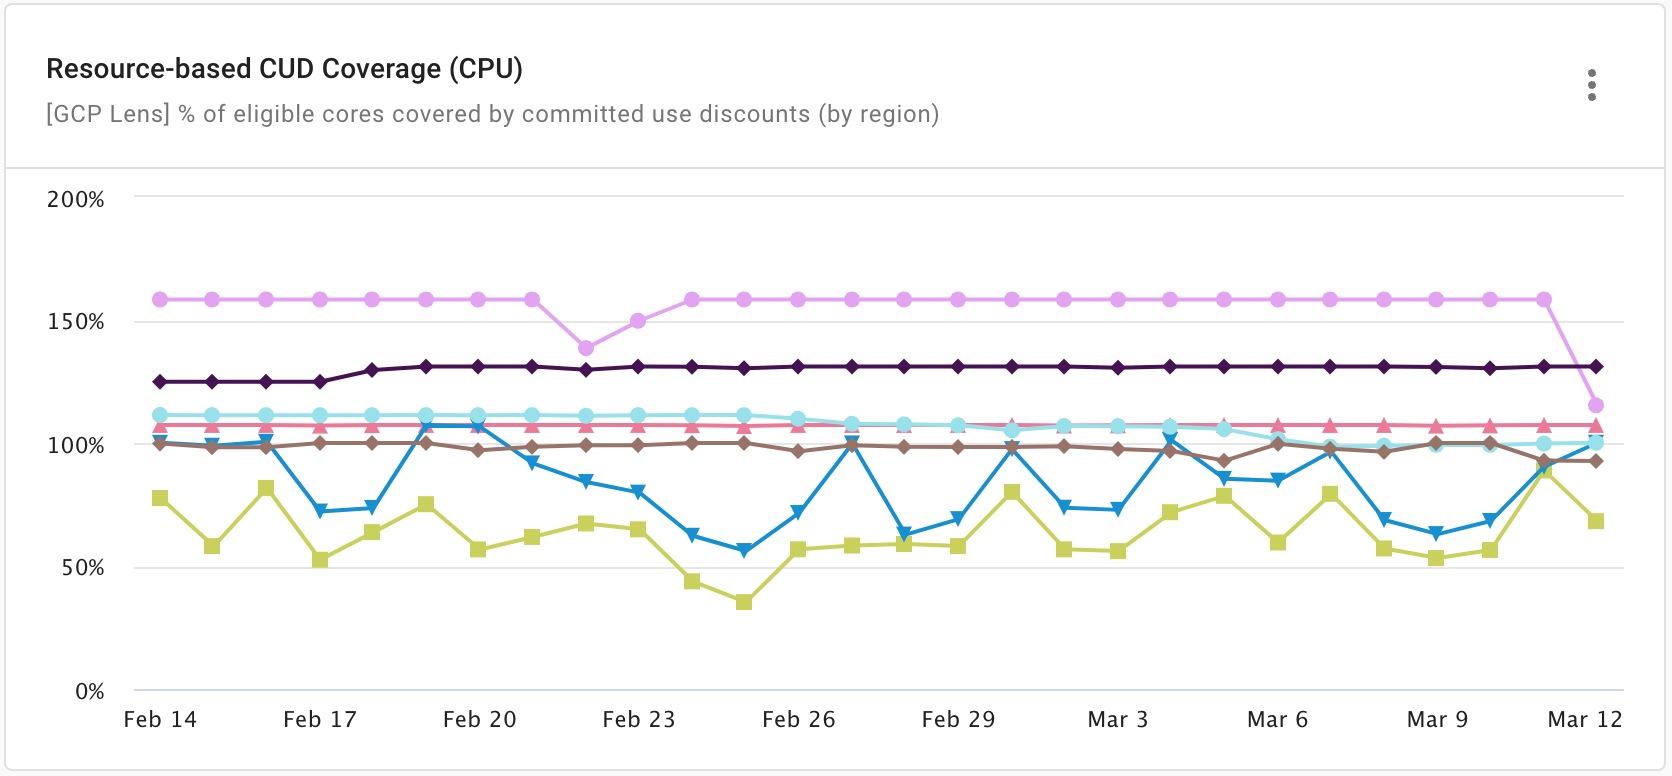
Resource-based CUD Coverage (CPU)
The Resource-based CUD Coverage (CPU) widget shows the coverage of eligible CPU resources with committed use discounts (CUDs) by region.
Report configuration:
- Metric: GCE CUD Coverage
- Time Range: Last 30 (include current day)
- Time Interval: Day
- Exclude partial intervals: Yes
- Filter results:
- Provider equals
Google Cloud - Service equals
Compute Engine (GCE) - Allocation rule is one of
GCP CUD CommitmentsorGCP Eligible for CUD(see Preset allocations: Google Cloud) - GCE Resource equals
cpu
- Provider equals
- Group by: Billing Account, Region, CUD Type
- Limit results:
- Limit by value: GCE CUD Coverage > 0%
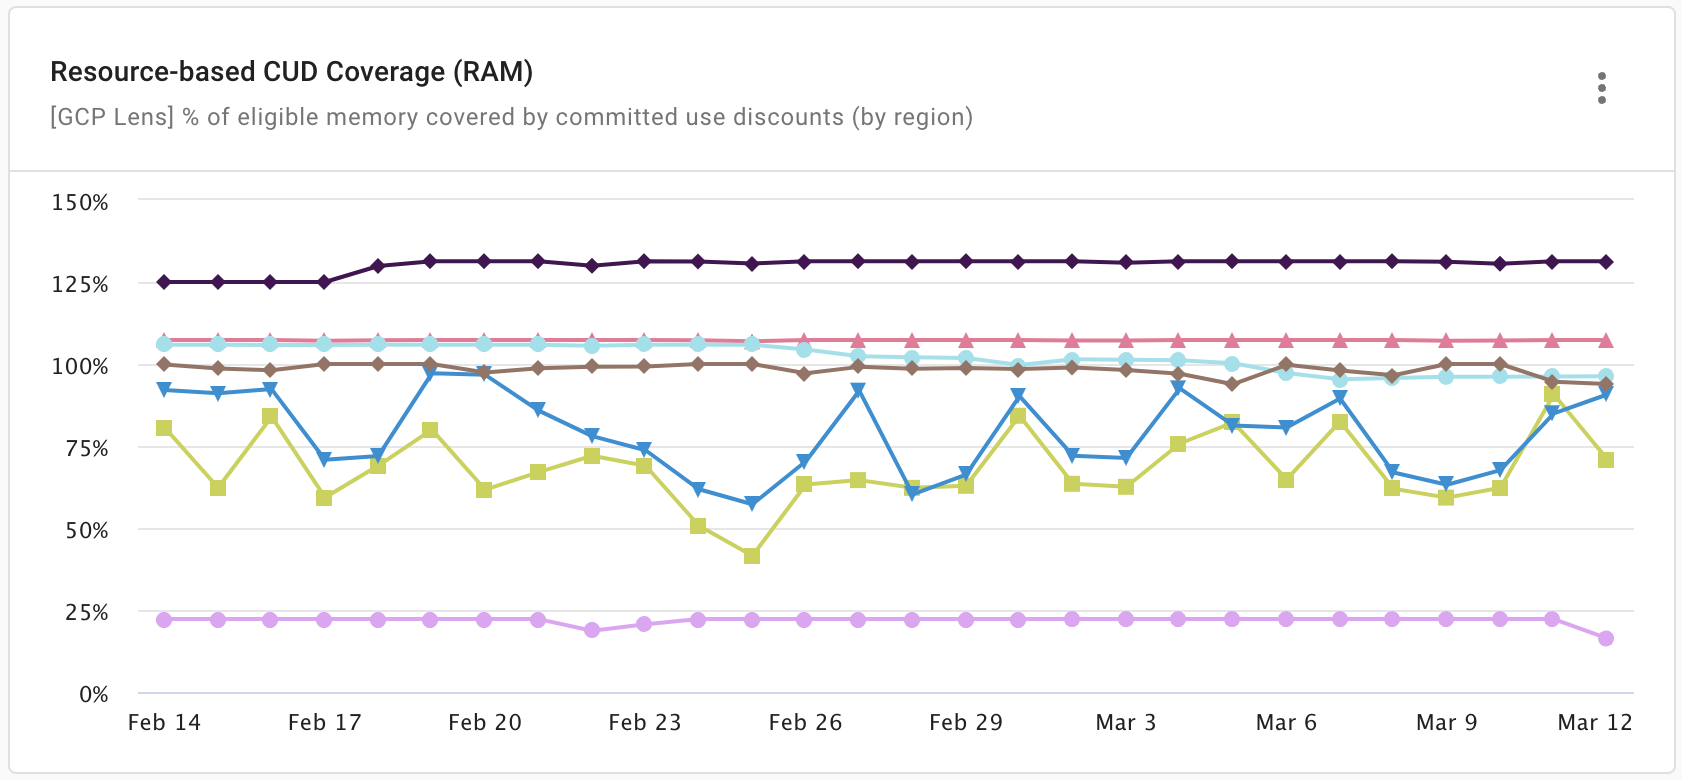
Resource-based CUD Coverage (RAM)
The Resource-based CUD Coverage (RAM) widget shows the coverage of eligible memory resources with committed use discounts (CUDs) by region.
Report configuration:
- Metric: GCE CUD Coverage
- Time Range: Last 30 (include current day)
- Time Interval: Day
- Exclude partial intervals: Yes
- Filter results:
- Provider equals
Google Cloud - Service equals
Compute Engine (GCE) - Allocation rule is one of
GCP CUD CommitmentsorGCP Eligible for CUD(see Preset allocations: Google Cloud) - GCE Resource equals
memory
- Provider equals
- Group by: Billing Account, Region, CUD Type
- Limit results:
- Limit by value: GCE CUD Coverage > 0%