AWS MAP Intelligence
The AWS Migration Acceleration Program (MAP) is a program that provides a framework, tools and resources designed to accelerate your cloud migration.
The AWS MAP preset dashboard in the DoiT console enables you to understand your cloud migration in depth.
Required permission
To access AWS MAP Intelligence, your DoiT account needs the Cloud Analytics User permission.
AWS MAP Intelligence dashboard
The AWS MAP Intelligence dashboard consists of several preset report widgets that highlight various aspects of your AWS MAP spend. The dashboard is automatically created when resources tagged with the AWS resource tag map-migrated are detected in the past 12 months.
To access the AWS MAP Intelligence dashboard, select Dashboard from the top navigation bar, and then select AWS MAP Intelligence under Programs.
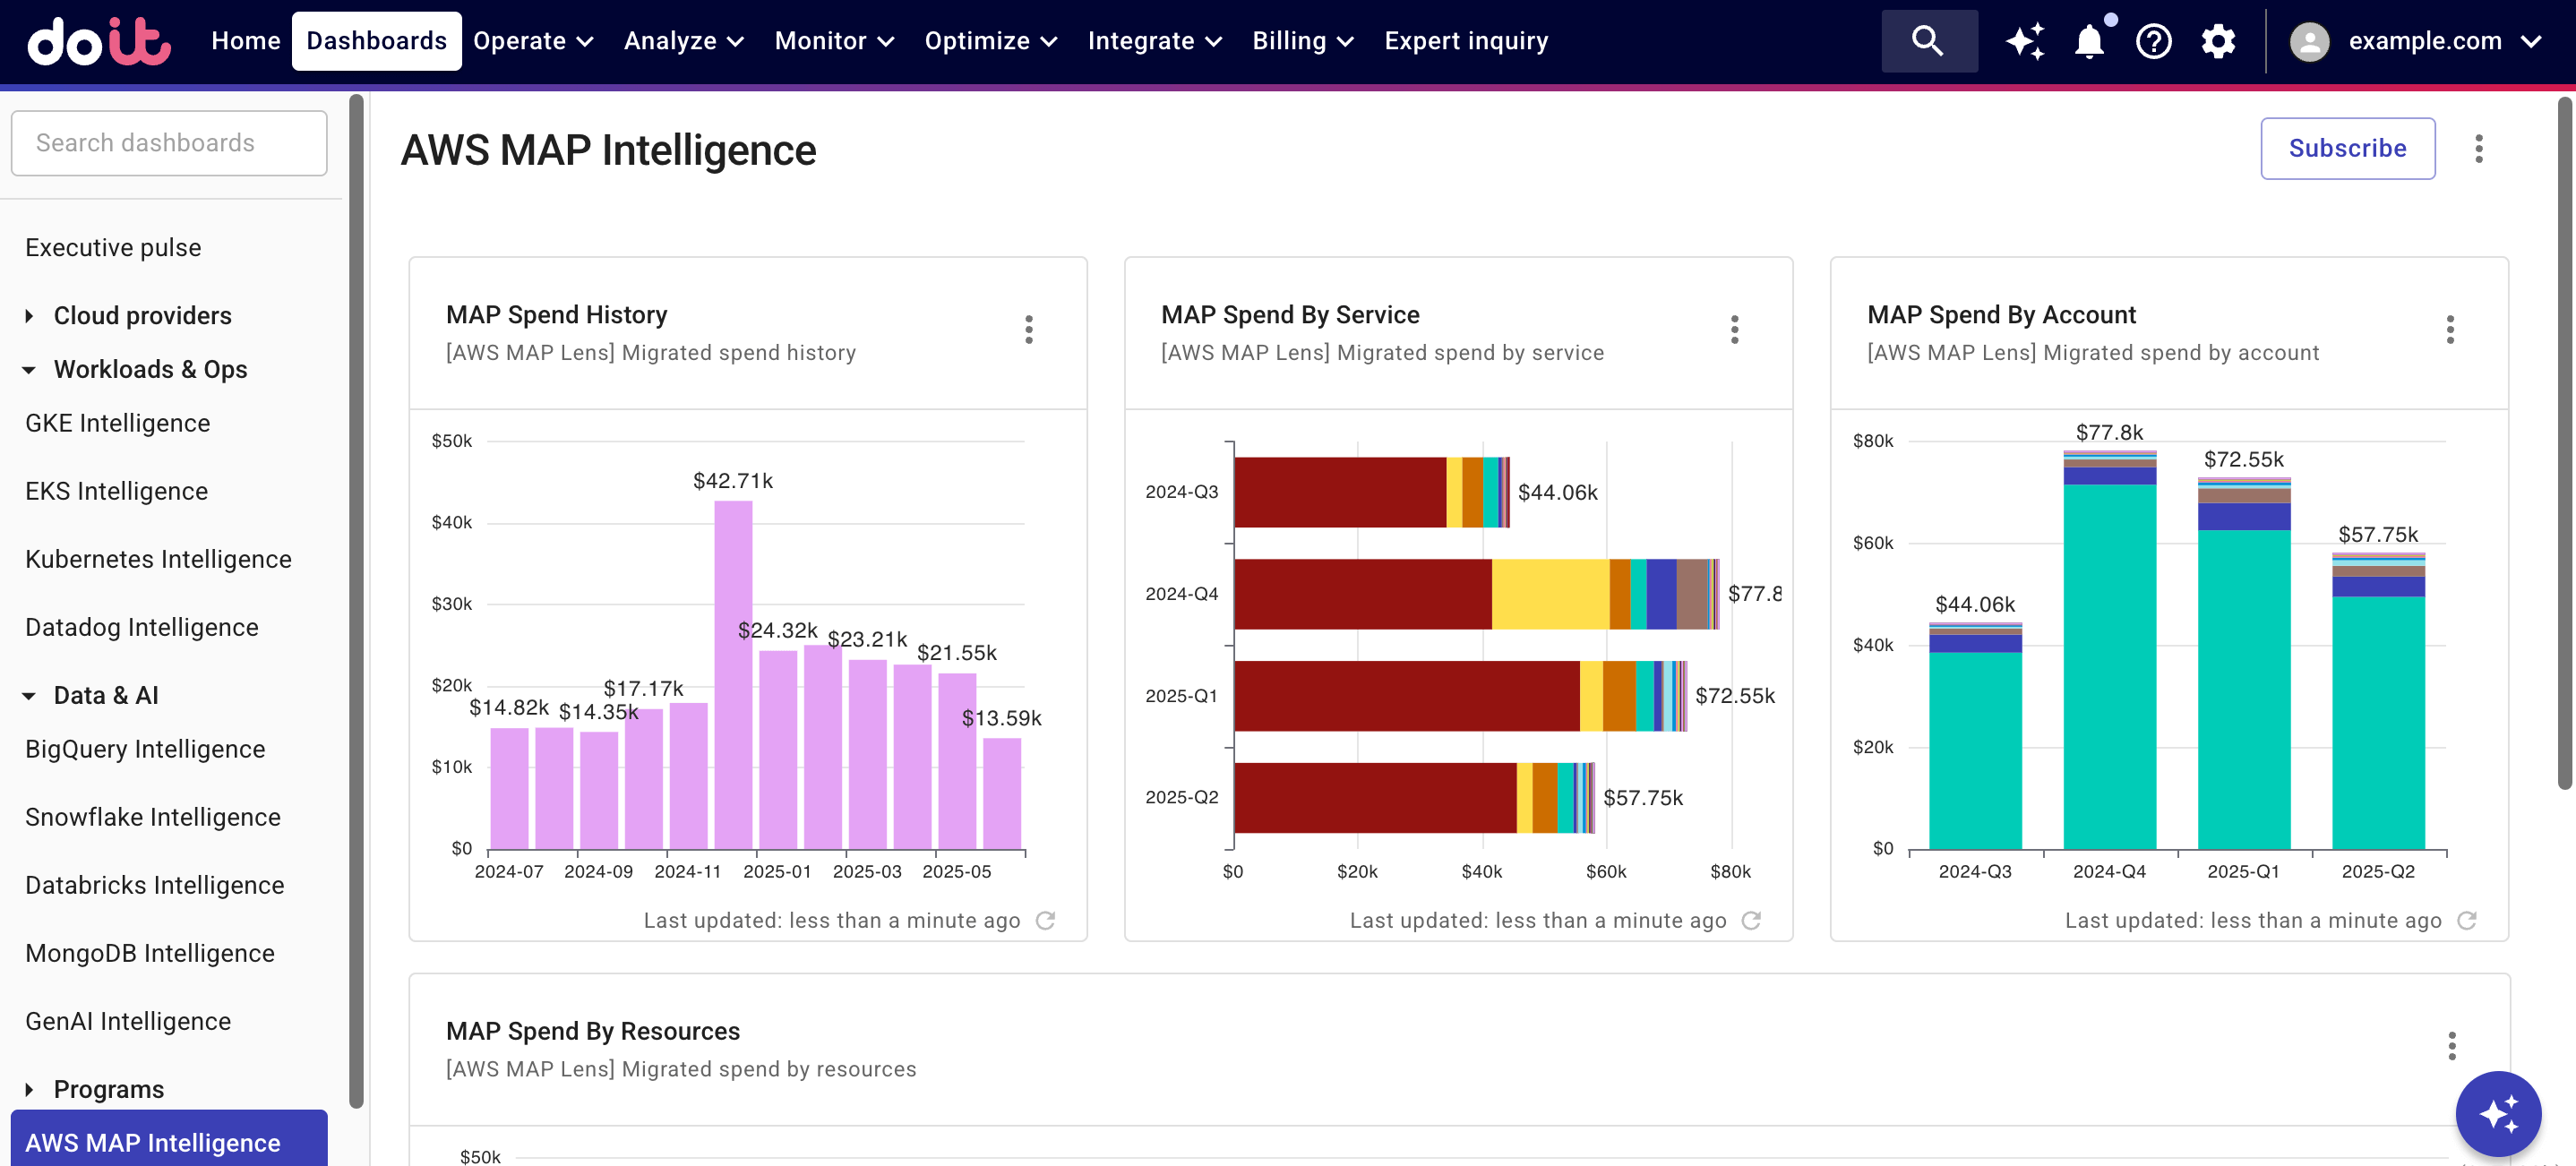
Widgets on the dashboard are updated independently of each other. See Refresh report data for more information.
You can Open full report to check the report configuration or customize the preset report to create your own one.
MAP Spend History
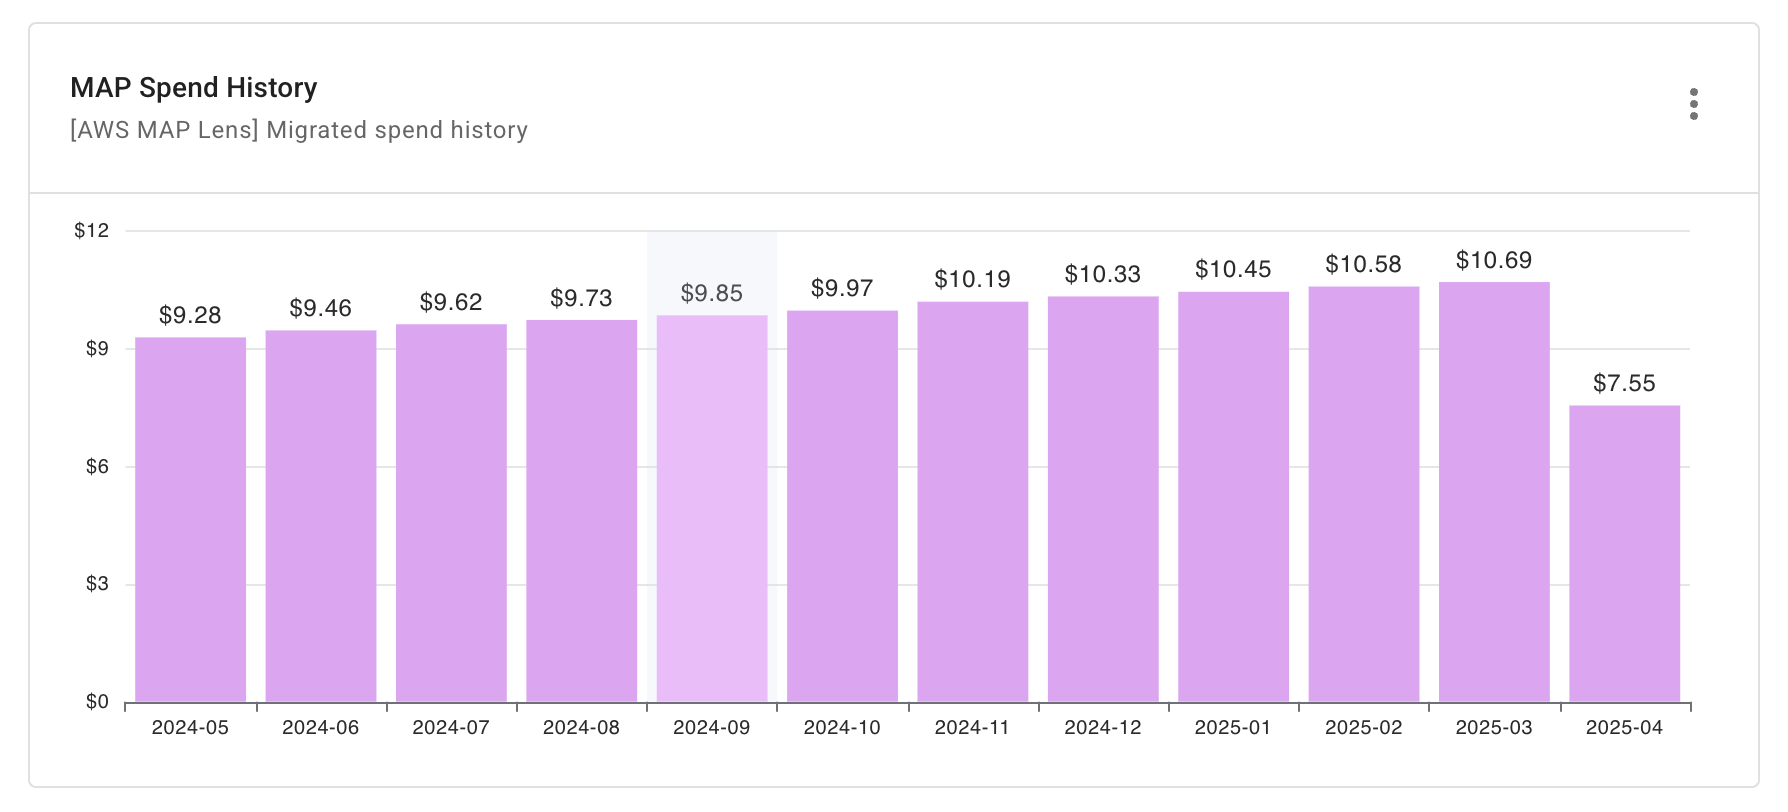
Shows the total expenditure for all AWS resources tagged as part of the Migration Acceleration Program. It allows you to visualize the associated cost of all MAP-related resources across your organization, allowing you to validate your costs and identify any concerning spending patterns.
- Metric: Cost
- Time Range: Last 12 months
- Time Interval: Month
- Filter:
- Provider: Amazon Web Services
- map-migrated: EXCLUDE: [LABEL N/A]
MAP Spend by Service
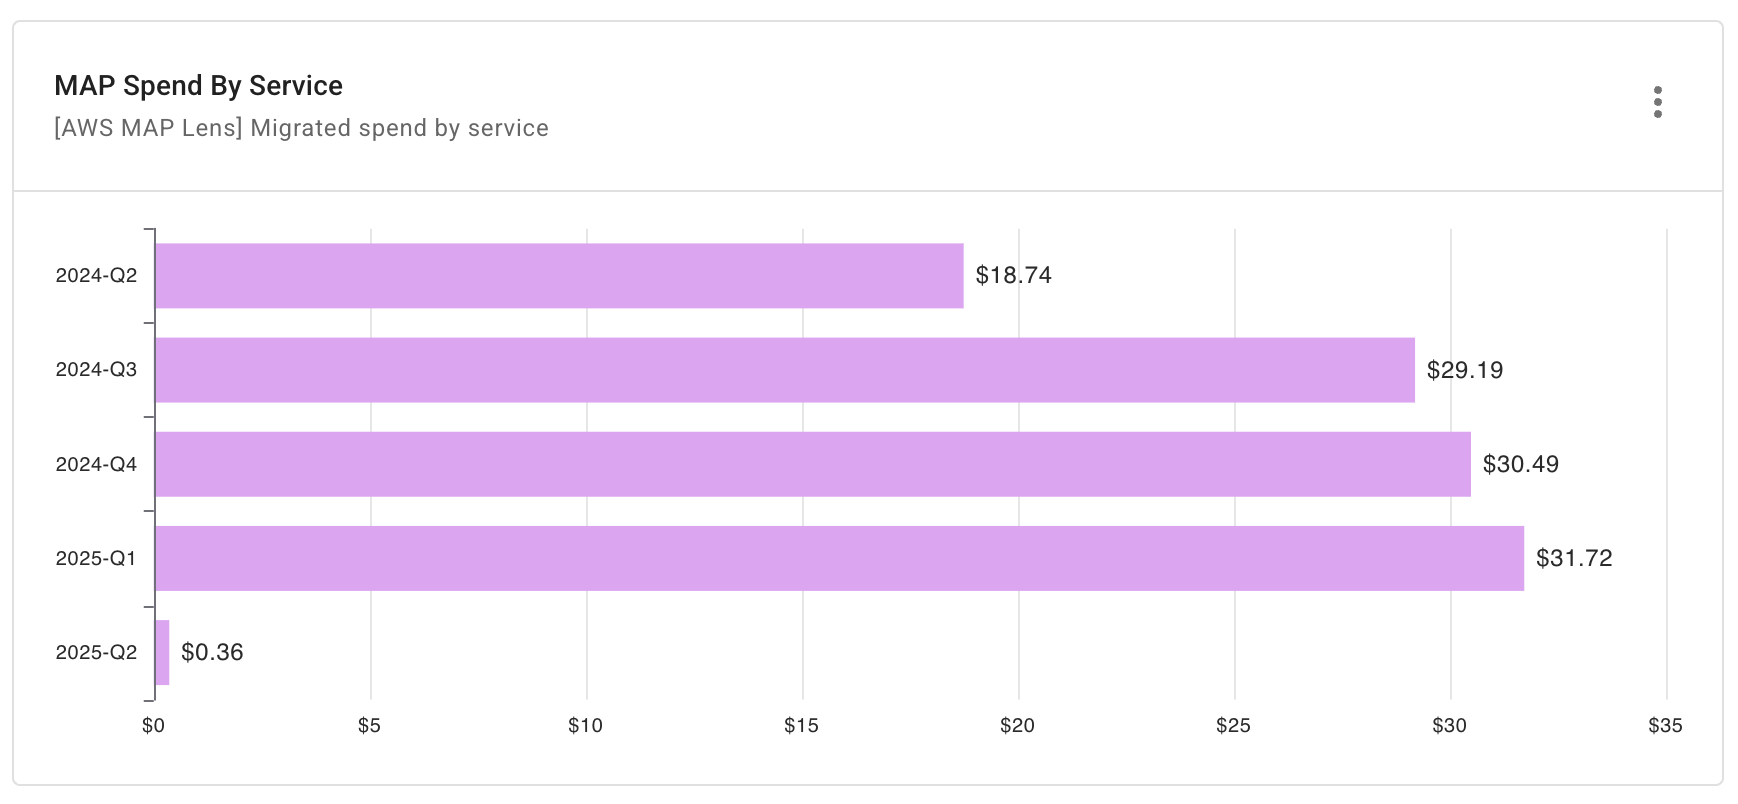
Shows the expenditure for each AWS service utilized for resources tagged as part of the Migration Acceleration Program. This chart provides a breakdown of costs associated with each AWS service, helping you identify optimization opportunities and validate service adoption.
- Metric: Cost
- Time Range: Last 12 months
- Time Interval: Quarter
- Filter:
- Provider: Amazon Web Services
- map-migrated: EXCLUDE: [LABEL N/A]
- Group by: Project/Account ID
MAP Spend by Account
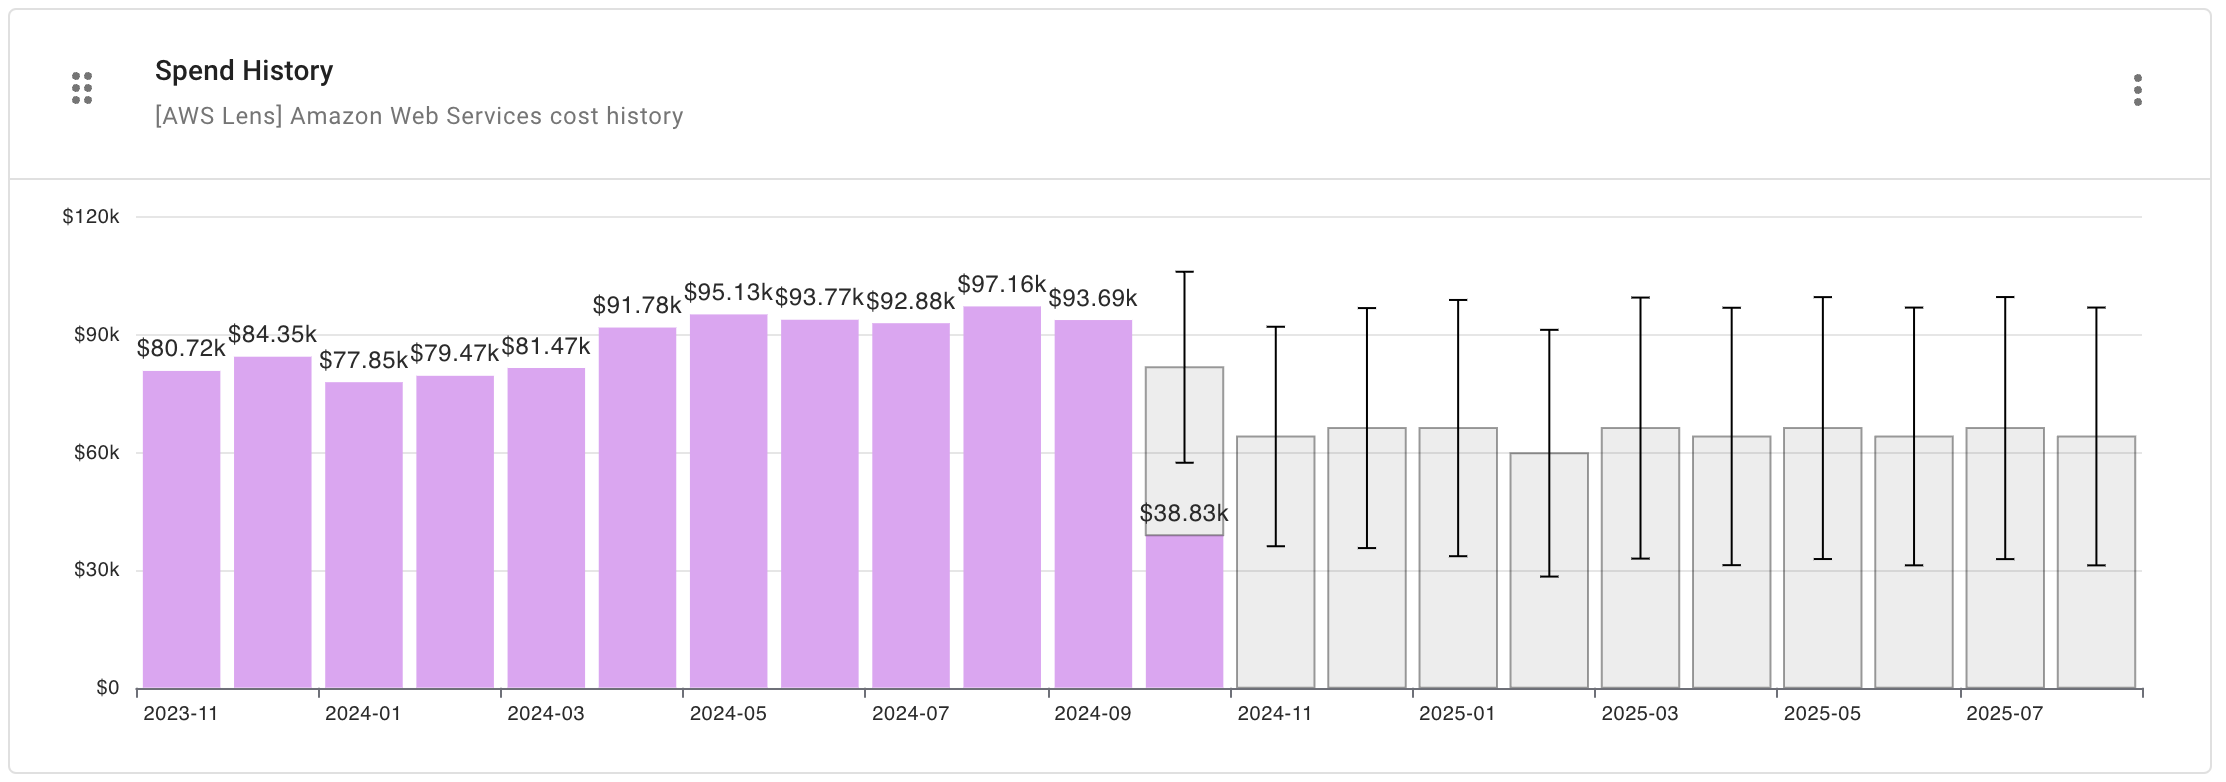
Shows the expenditure for each AWS account utilized for resources tagged as part of the Migration Acceleration Program. This chart shows the cost at account-level, enabling you to analyse financial cost associated with each migration initiative, ensuring each migration account stays within budget while helping cost allocation and prioritization decisions.
- Metric: Cost
- Time Range: Last 12 months
- Time Interval: Quarter
- Filter:
- Provider: Amazon Web Services
- map-migrated: EXCLUDE: [LABEL N/A]
- Group by: Project/Account ID
MAP Spend by Resources
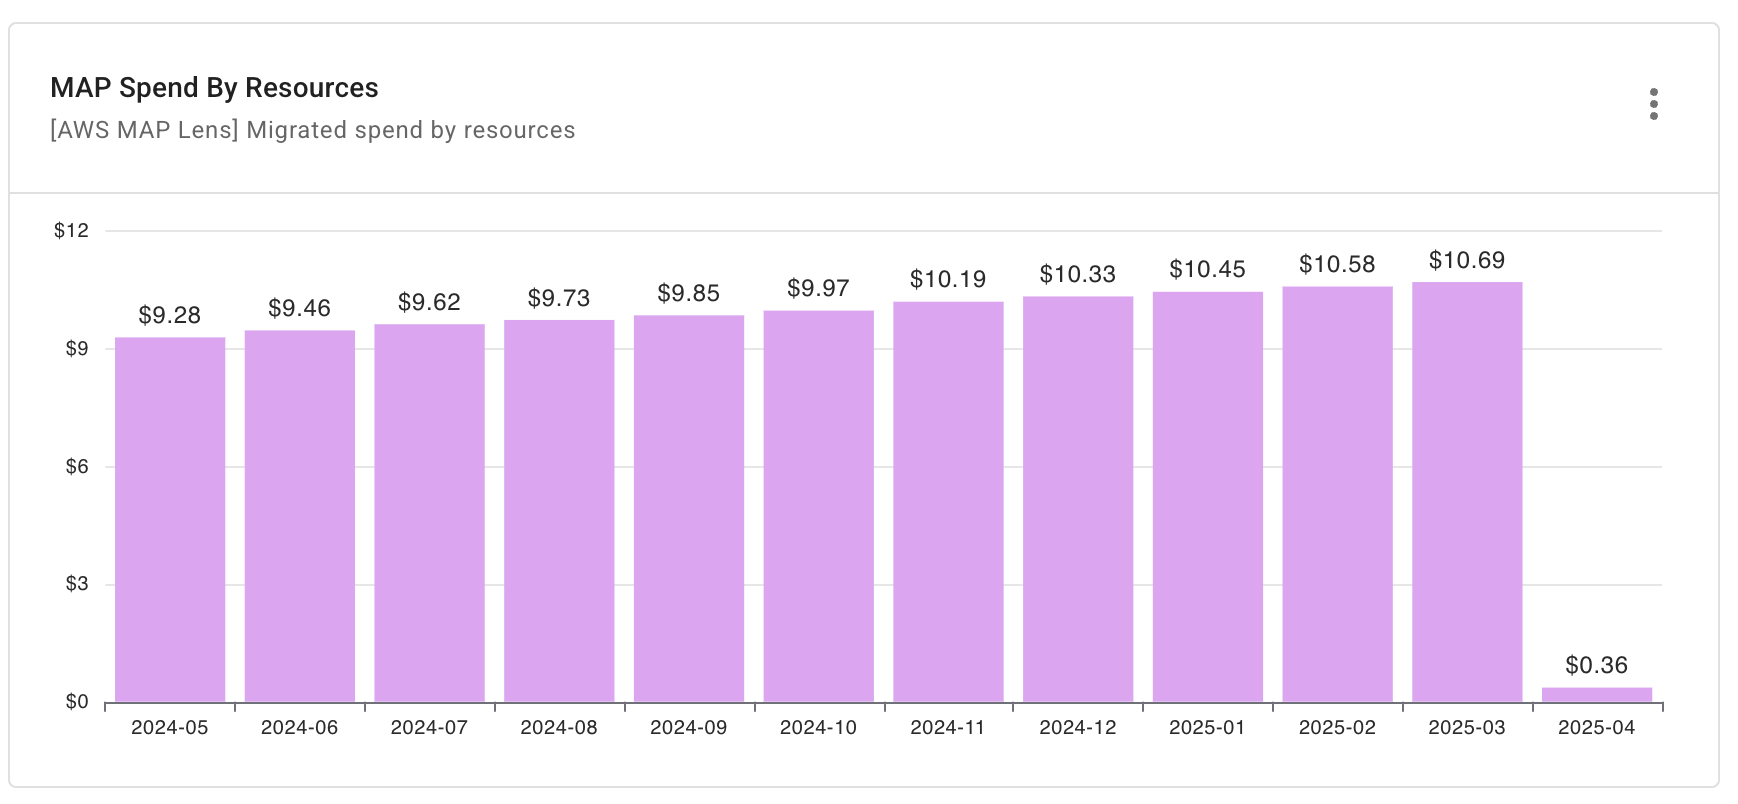
Shows the expenditure for each AWS resource tagged as part of the Migration Acceleration Program, for example, EC2 instances, S3 buckets, RDS databases, and so on. This chart enables you to validate your MAP tagging and make optimization decisions based on actual resource-level usage.
- Metric: Cost
- Time Range: Last 12 months
- Time Interval: Month
- Group by: map-migrated [LABEL N/A]
MAP Credits History
Shows the AWS MAP credits you have accrued over a specified timeframe. This chart helps you track the financial benefits you have received through AWS MAP.
- Metric: Cost
- Time Range: Last 12 months
- Time Interval: Quarter
- Filter:
- Provider: Amazon Web Services
- Cost Type: Credit
- Credit: (?!)map
- Group by: Project/Account ID