Access reports
Required permission
- Cloud Analytics Read Only, Cloud Analytics User, or Cloud Analytics Admin
A custom report is visible only to those with whom the owner has shared it or those with the Cloud Analytics Admin permission. See Share reports for more information. If you've set up the Organizations feature, be aware that reports shared outside an organization are not visible within.
Access reports
To access Cloud Analytics reports, sign in to the DoiT console, select Reporting and analytics > Reports from the top navigation mega menu.
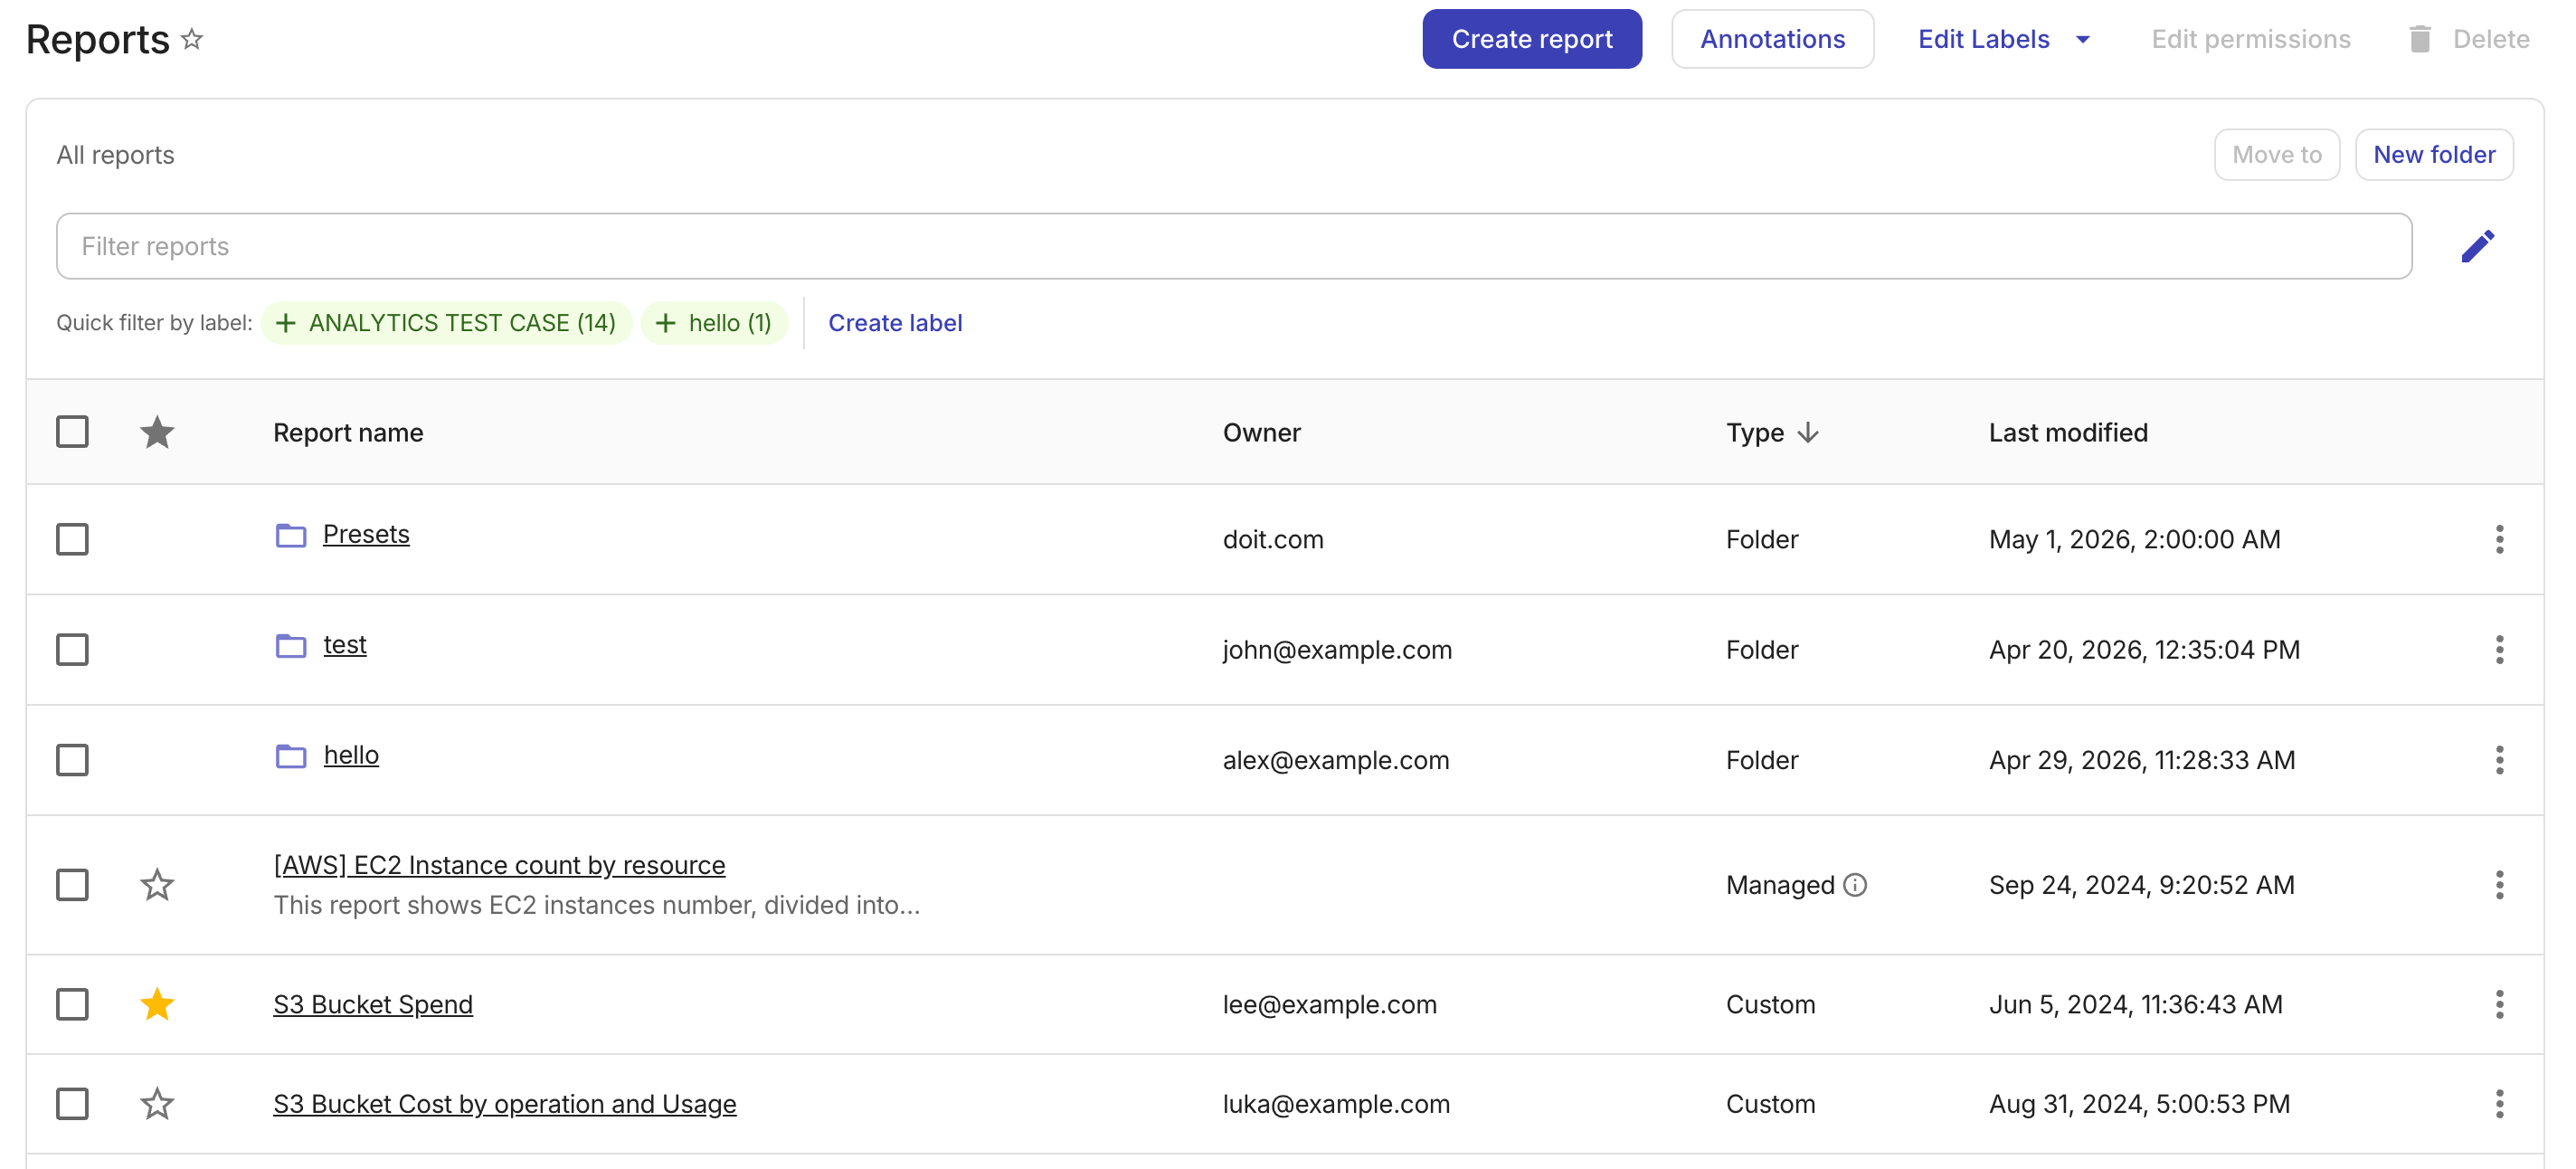
The Reports list is displayed in the following order:
-
A read-only Presets folder that contains all preset reports. This folder is maintained by DoiT and cannot be renamed, moved, or deleted.
-
Folders created by you and other users in your organization to group custom reports.
-
Managed reports maintained by DoiT.
-
Custom reports not in any folders.
You can filter reports by property; the results include matches from any folder. You cannot filter folders at the moment.
View a report
To view a report, select its name on the main Reports screen.
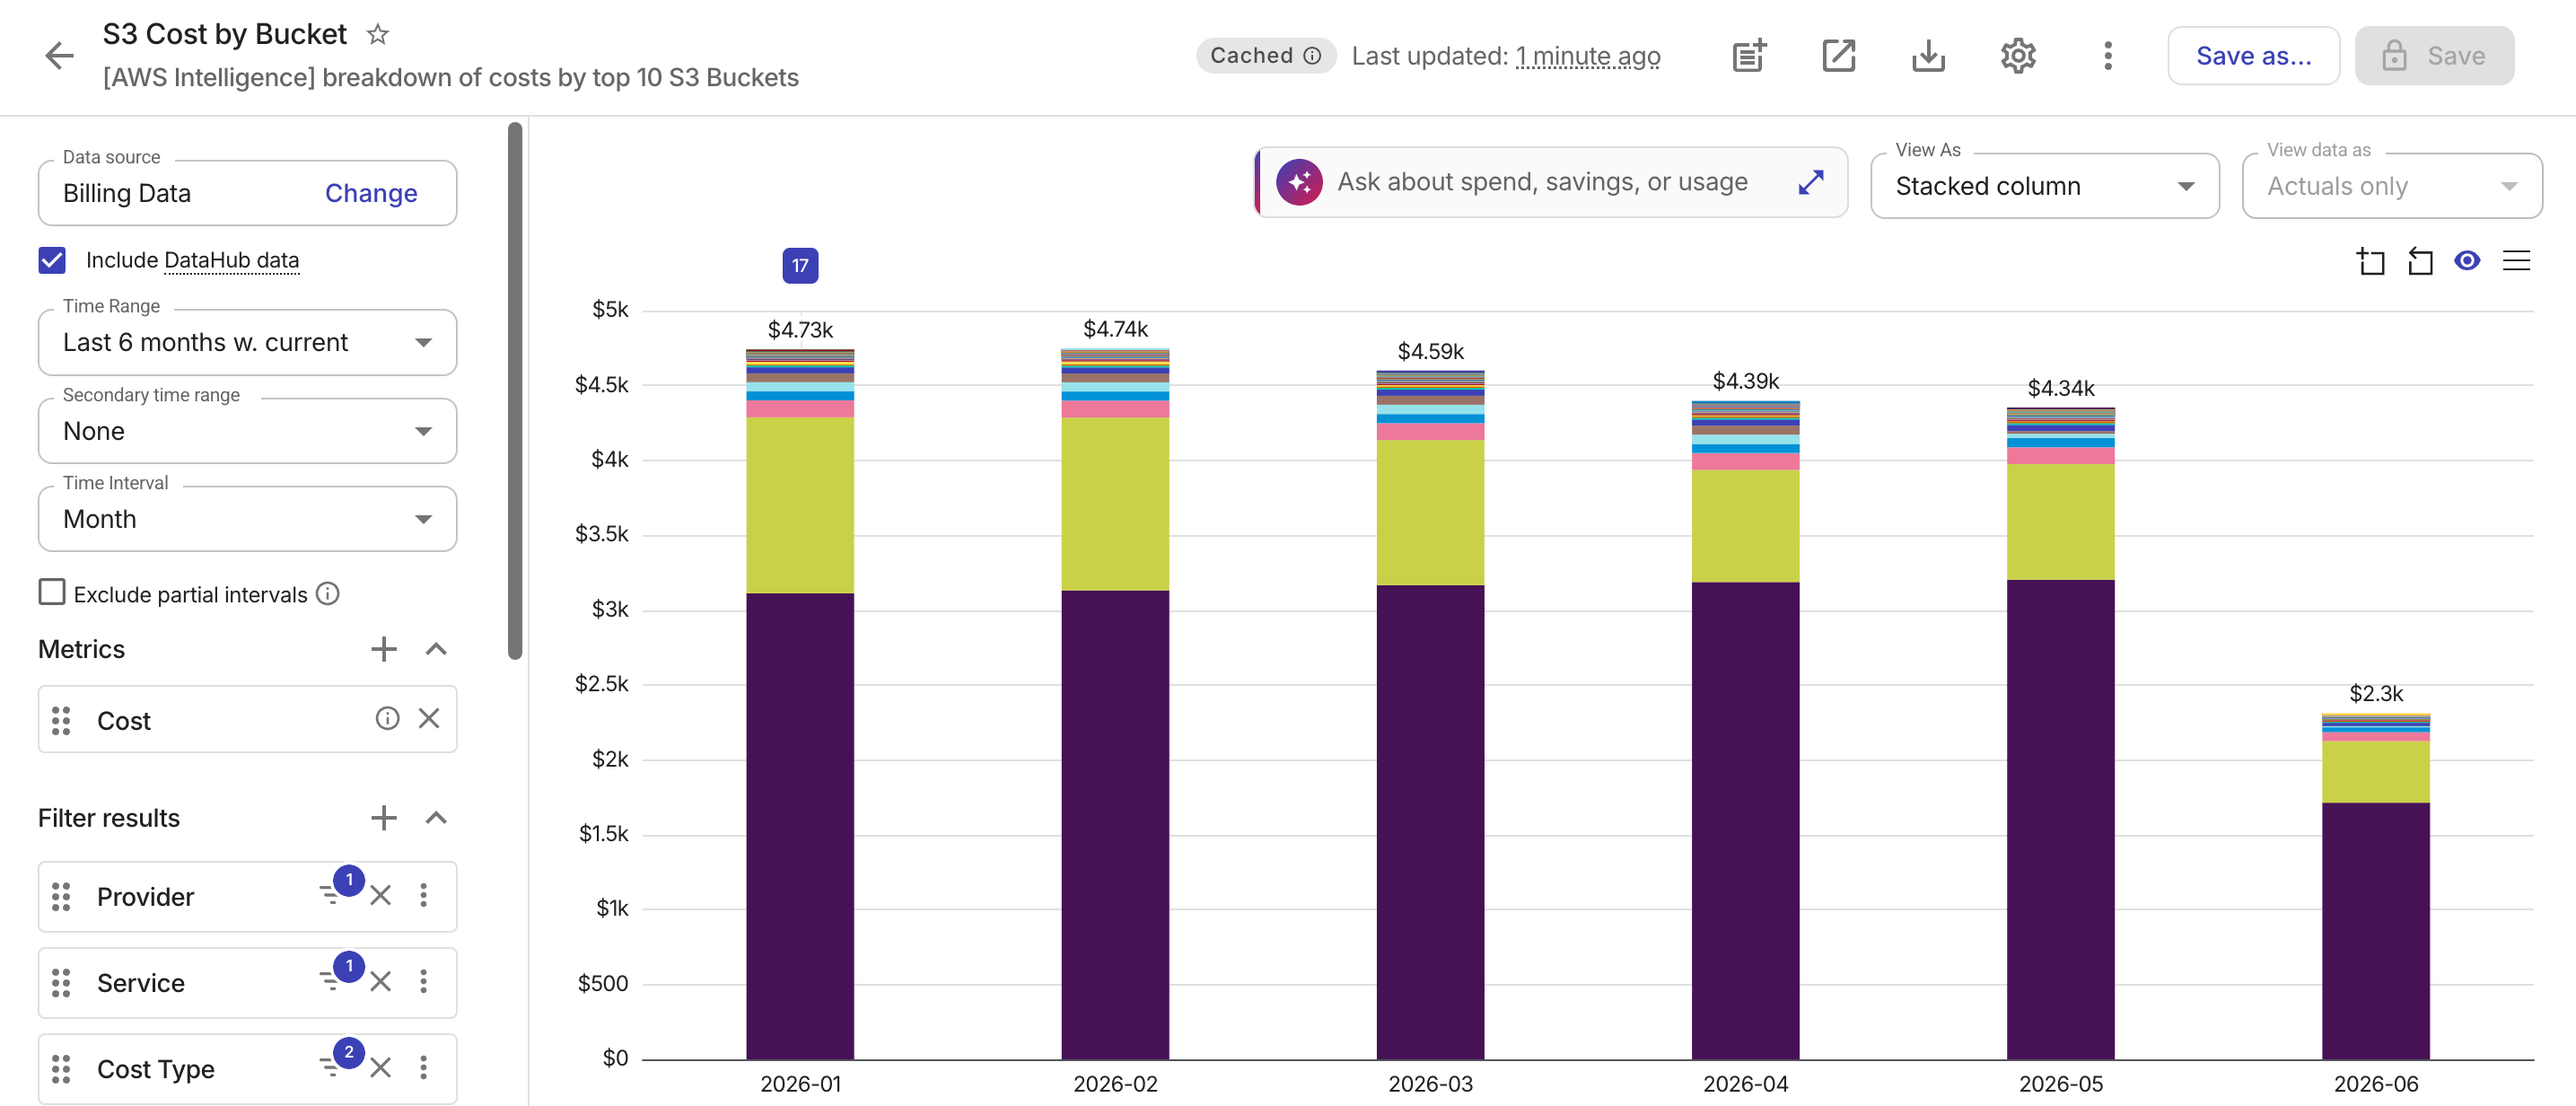
Select the kebab menu (⋮) in the report title bar and choose Report configuration to view the report details.
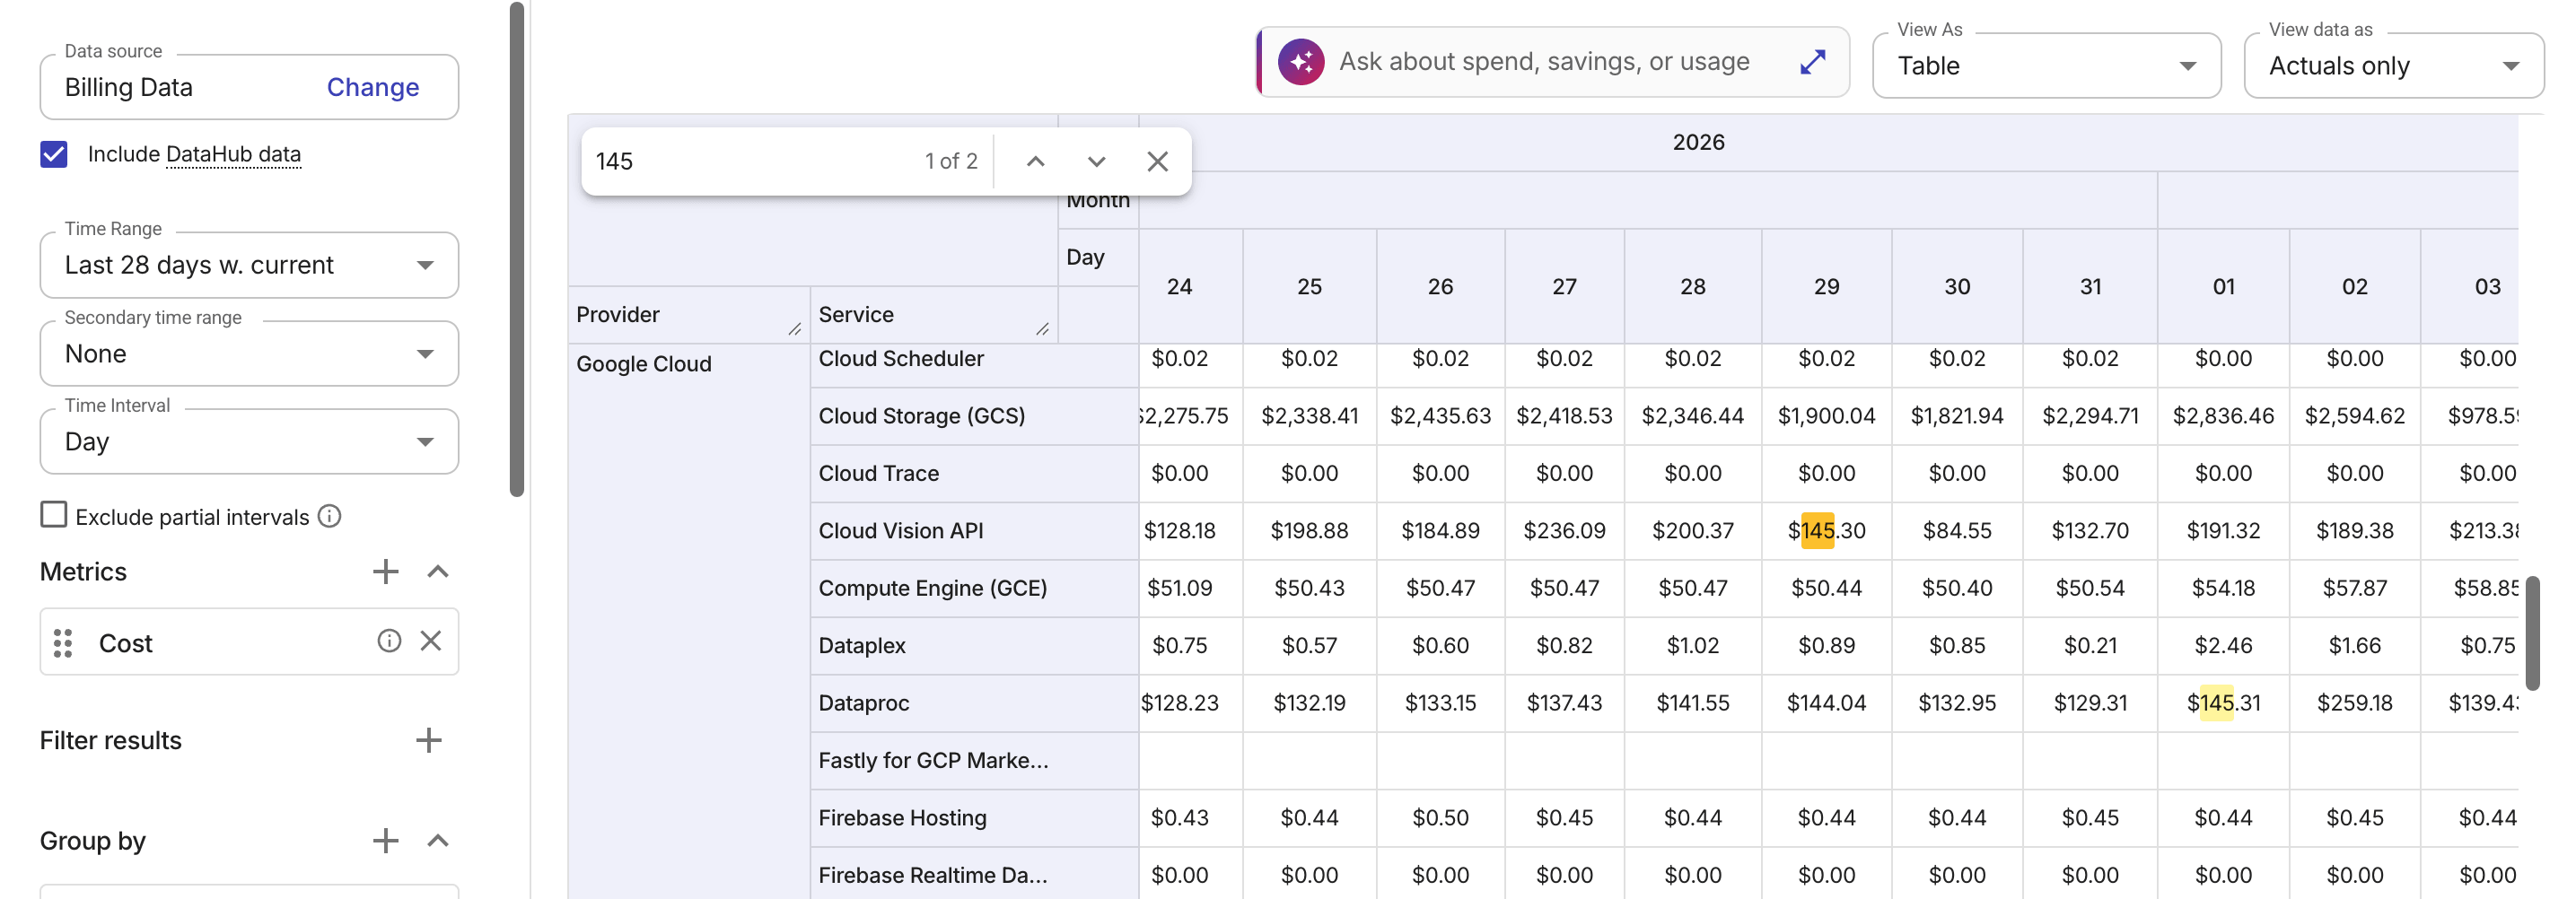
Search in table
To ensure optimal performance, tabular reports (Tables and Heatmaps) render only the rows and cells currently visible on your screen. Because standard browser search cannot detect unrendered rows, finding specific values in high-volume analytics reports requires scrolling manually, which is often impractical.
DoiT console enhances the standard Ctrl+F and Cmd+F shortcuts with a custom global search. This allows you to search across your entire table, regardless of whether the rows are currently hidden from view.
-
The search scans both dimension label columns and metric value columns.
-
The search is case-insensitive and matches any substring within a cell.
-
The search matches against formatted values as they appear on screen, not the underlying raw data.
Series totals
When viewing a report as a line and bar chart (including bar and column charts and trend and time-series charts), you can select the menu icon (
) in the upper-right corner of the chart area and choose Show totals panel to display a series totals panel alongside the chart so you can compare individual contributions without leaving the chart view.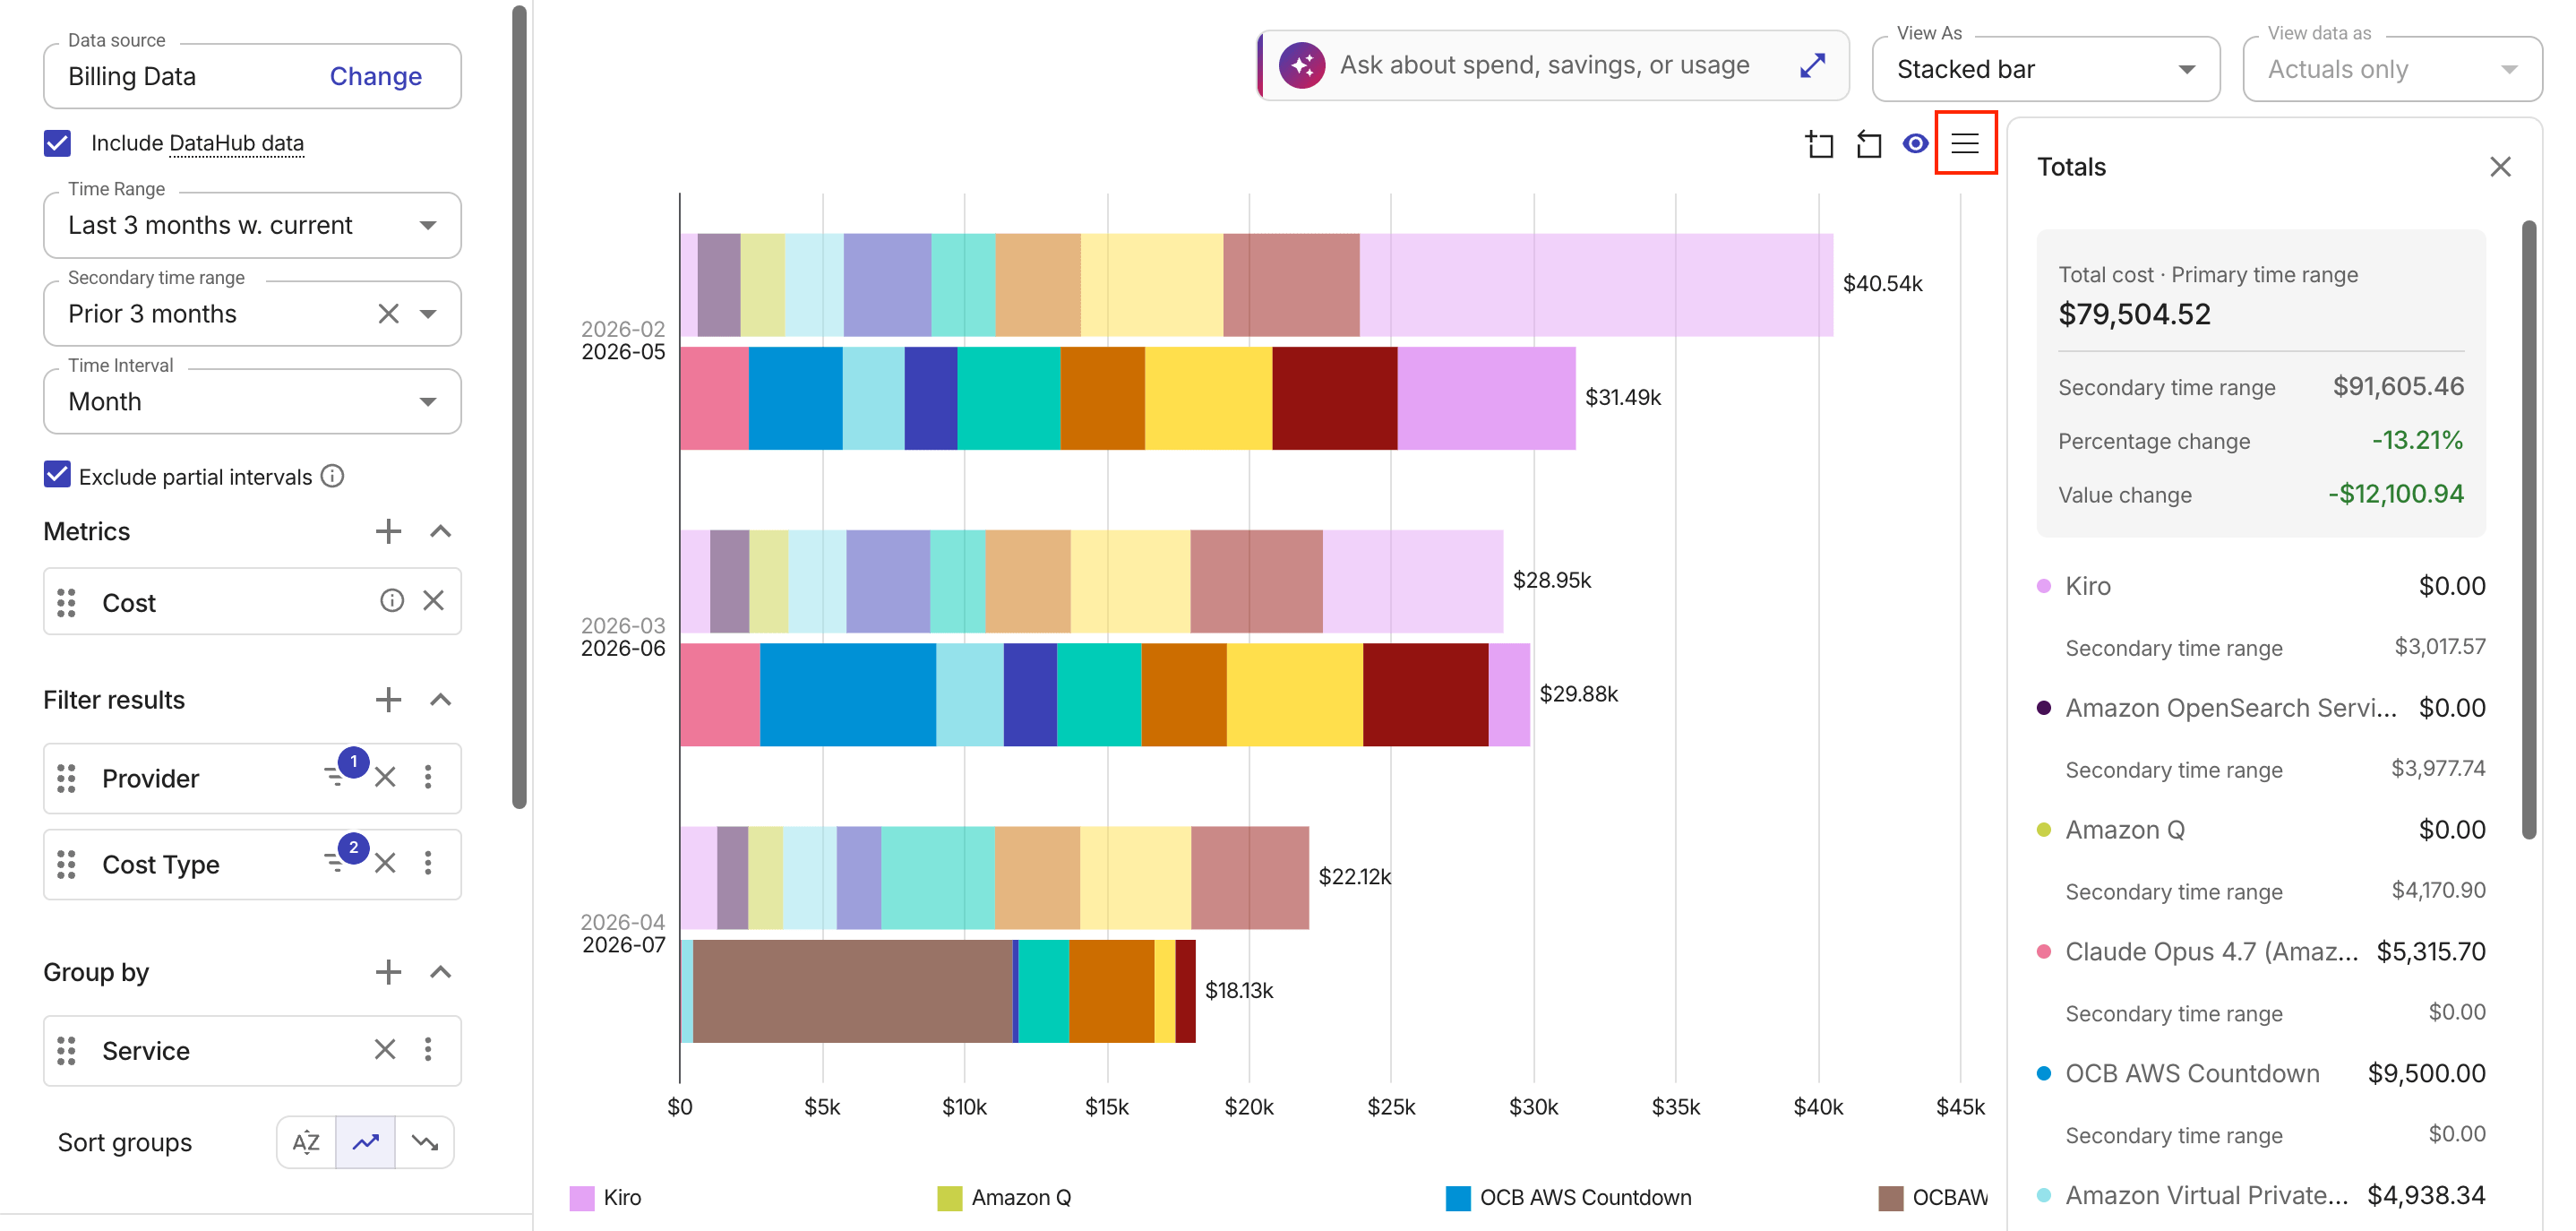
The panel displays the sum of all visible series values:
-
Each series is listed with its color indicator and summed value. When a report uses grouped dimensions, series are organized into collapsible groups that show subtotals.
-
When the report uses a comparison time range, the panel shows primary and secondary time range totals for each metric, along with the percentage change and value change between the two ranges.
-
When a report includes multiple metrics, each metric appears as a separate collapsible section.
-
When you zoom into a subset of the data, the panel recalculates totals to reflect only the visible range.
-
The totals panel is not available when the report is displayed as a dashboard widget or during export.
To hide the panel, select the chart menu icon again and choose Hide totals panel.
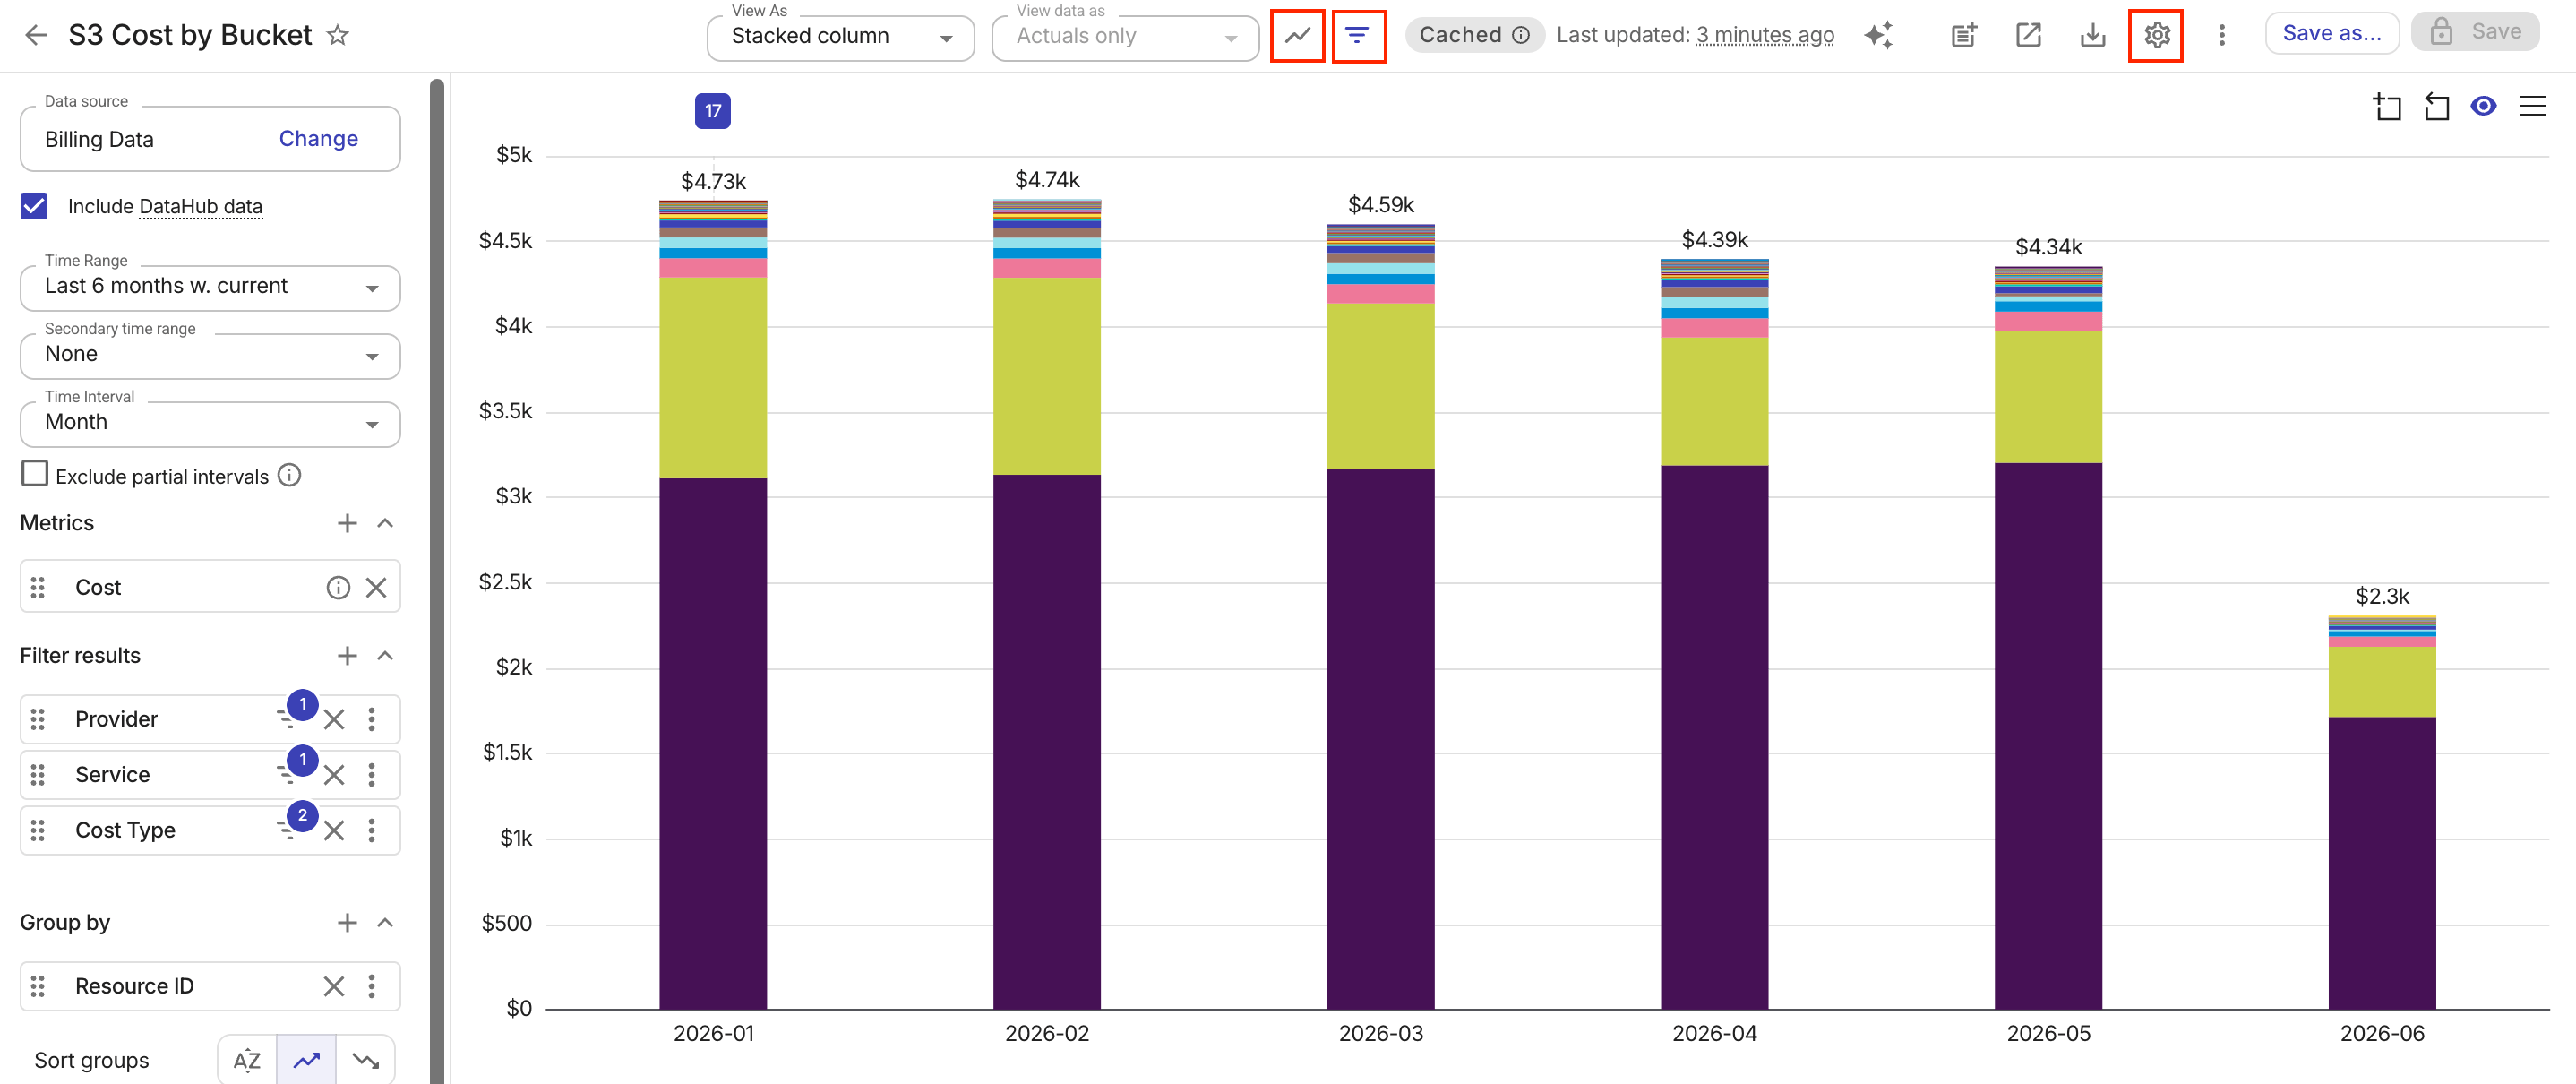
Compact mode
When Compact UI is enabled, the report uses smaller typography, tighter spacing, and a narrower side panel to maximize space for the chart and table.
All report configuration options remain available in compact mode, though some move to different locations:
-
Forecast and Limit results appear as icon buttons in the toolbar.
-
Advanced options moves into the Report Settings (gear) dialog.