Azure Intelligence
Azure Intelligence in the DoiT console helps you understand your Microsoft Cloud costs and maximize the value of your Azure investments.
Required permission
To access Azure Intelligence, your DoiT account needs the Cloud Analytics User permission.
Azure Intelligence dashboard
The Azure Intelligence dashboard consists of report widgets that highlight various aspects of your Azure spend. It is automatically created when Azure workloads are detected in your DoiT account.
To access the Azure Intelligence dashboard, select Dashboards from the top navigation mega menu, and then select Azure Intelligence.
Note that Microsoft Azure billing data is backfilled from January 1, 2023.

Widgets on the dashboard are updated independently of each other. See Refresh report data for more information.
You can Open full report to check the report configuration or customize the preset report to create your own one.
Spend History
The widget shows a high-level view of your Azure spend in the last 12 months with forecast for the next 12 months. It's an aggregated view of your usage trend and costs across your organization.
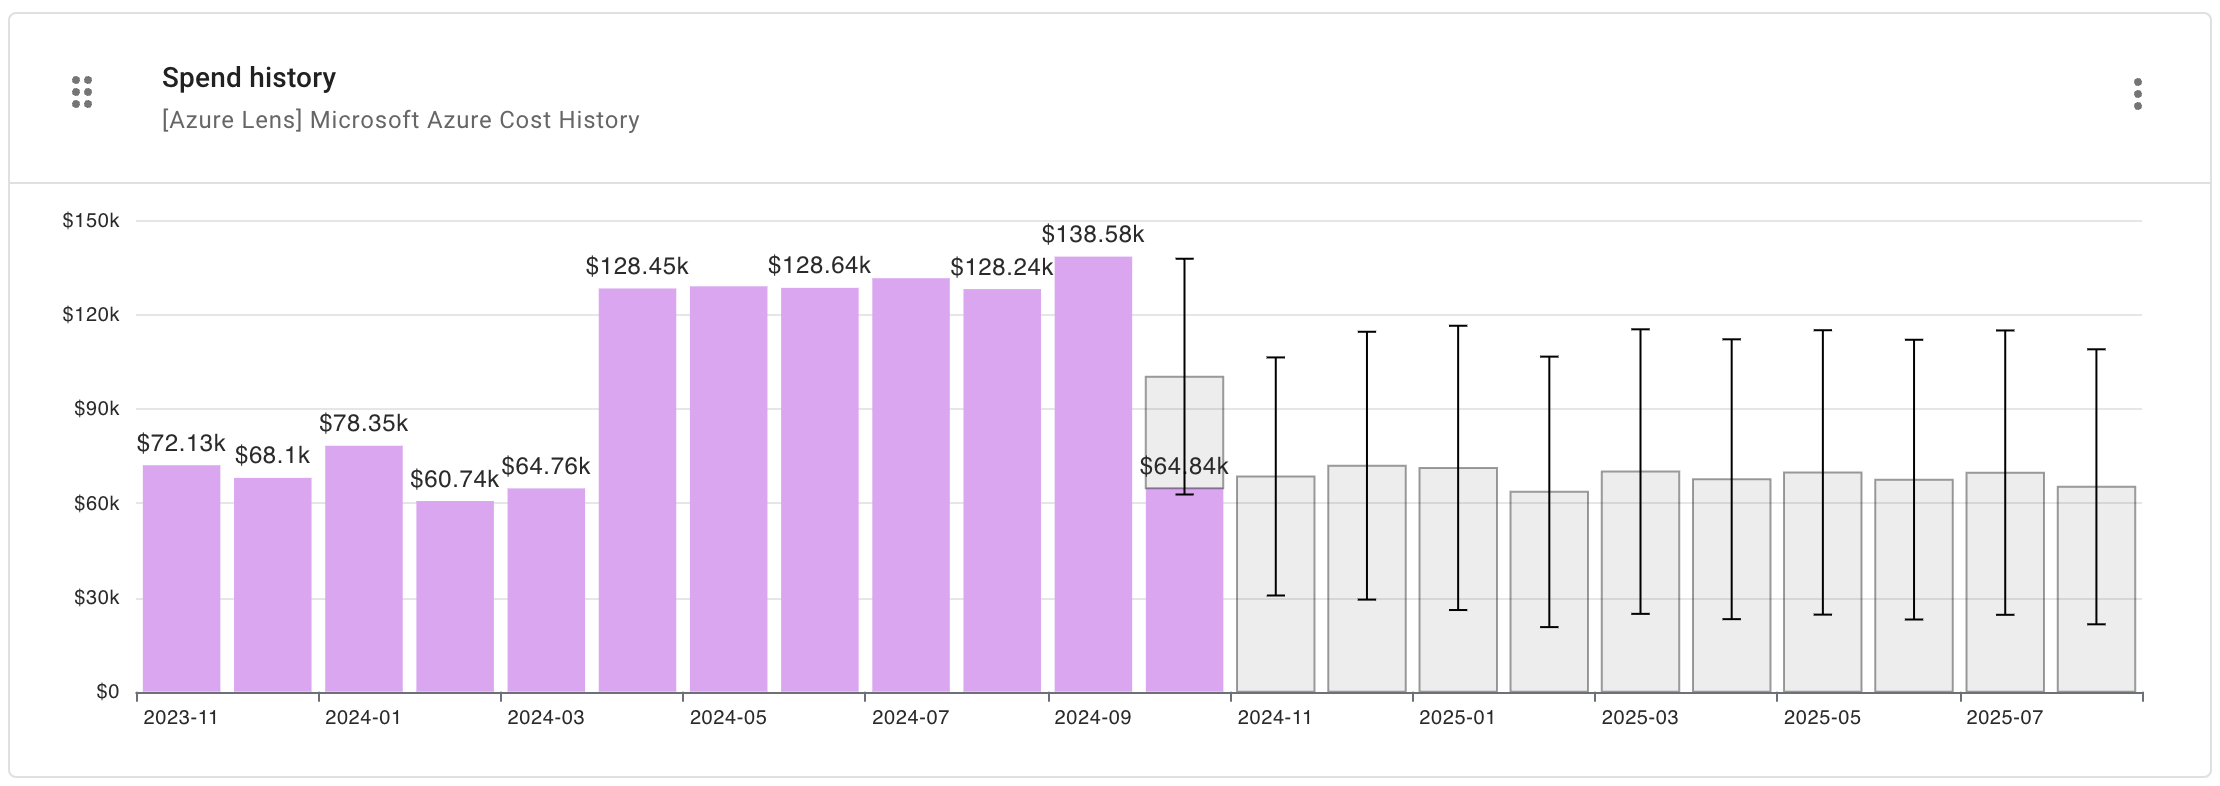
Report configuration:
- Metric: Cost
- Time Range: Last 12 months (include current month)
- Time Interval: Month
- Filter results: Provider equals
Microsoft Azure - Group by: Provider
- Advanced options:
- Advanced Analysis: Forecast
Cost By Top Services
The widget shows the top 10 Azure services by cost in the last six months. It allows you to quickly identify the usage patterns of top services and unusual costs that you may want to investigate.
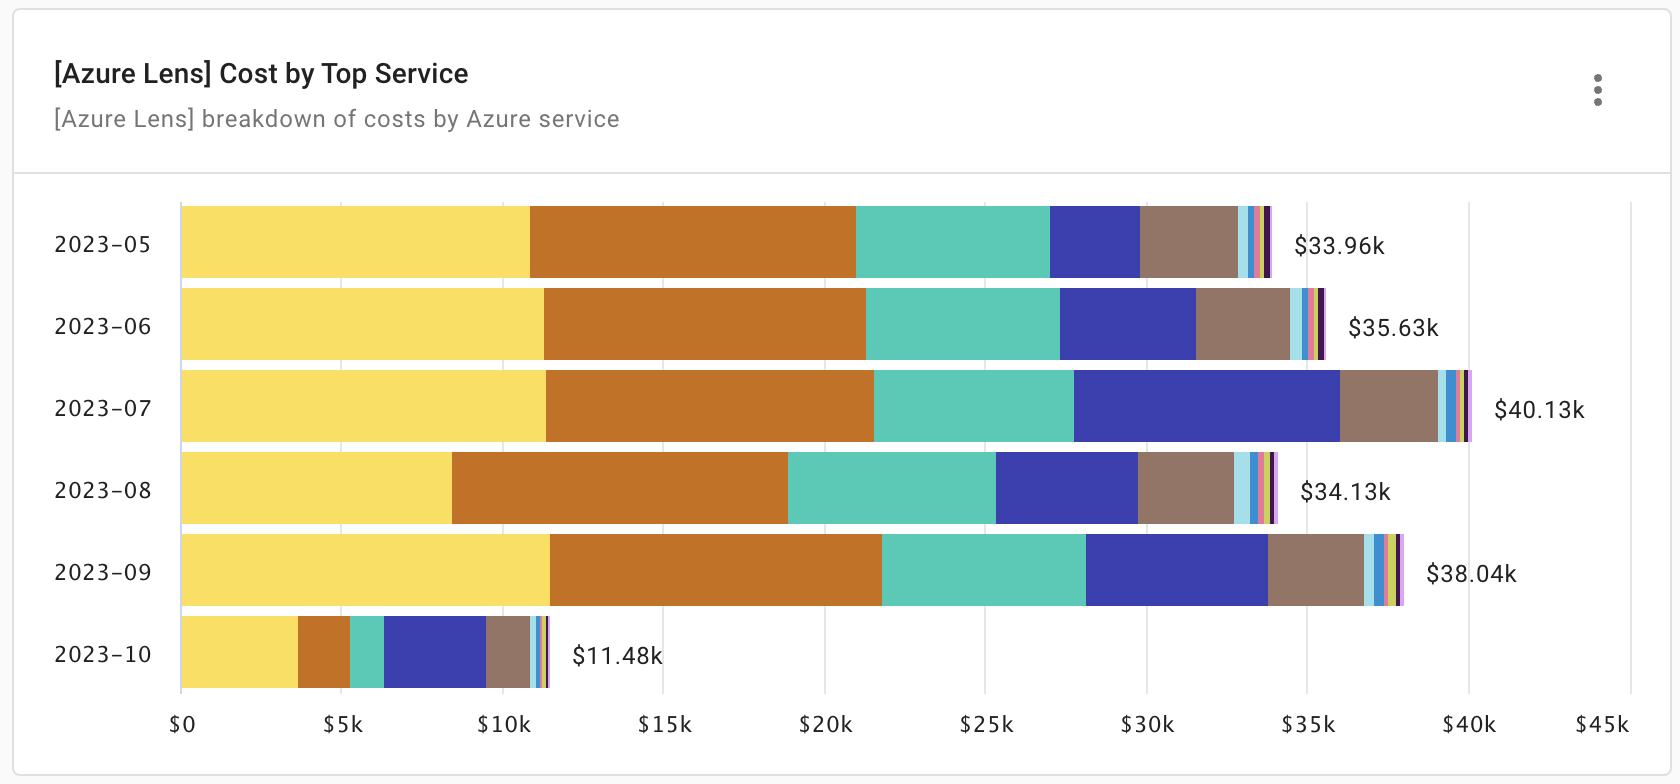
Report configuration:
- Metric: Cost
- Time Range: Last 6 months (include current month)
- Time Interval: Month
- Filter results: Provider equals
Microsoft Azure - Group by: Service (Azure Service maps to the cost details field
MeterCategory) - Limit results:
- Limit by top/bottom: Service—Limit to top 10 by cost
Cost By Top Resource Groups
The widget shows the top 10 Azure resource groups by cost in the last six months.
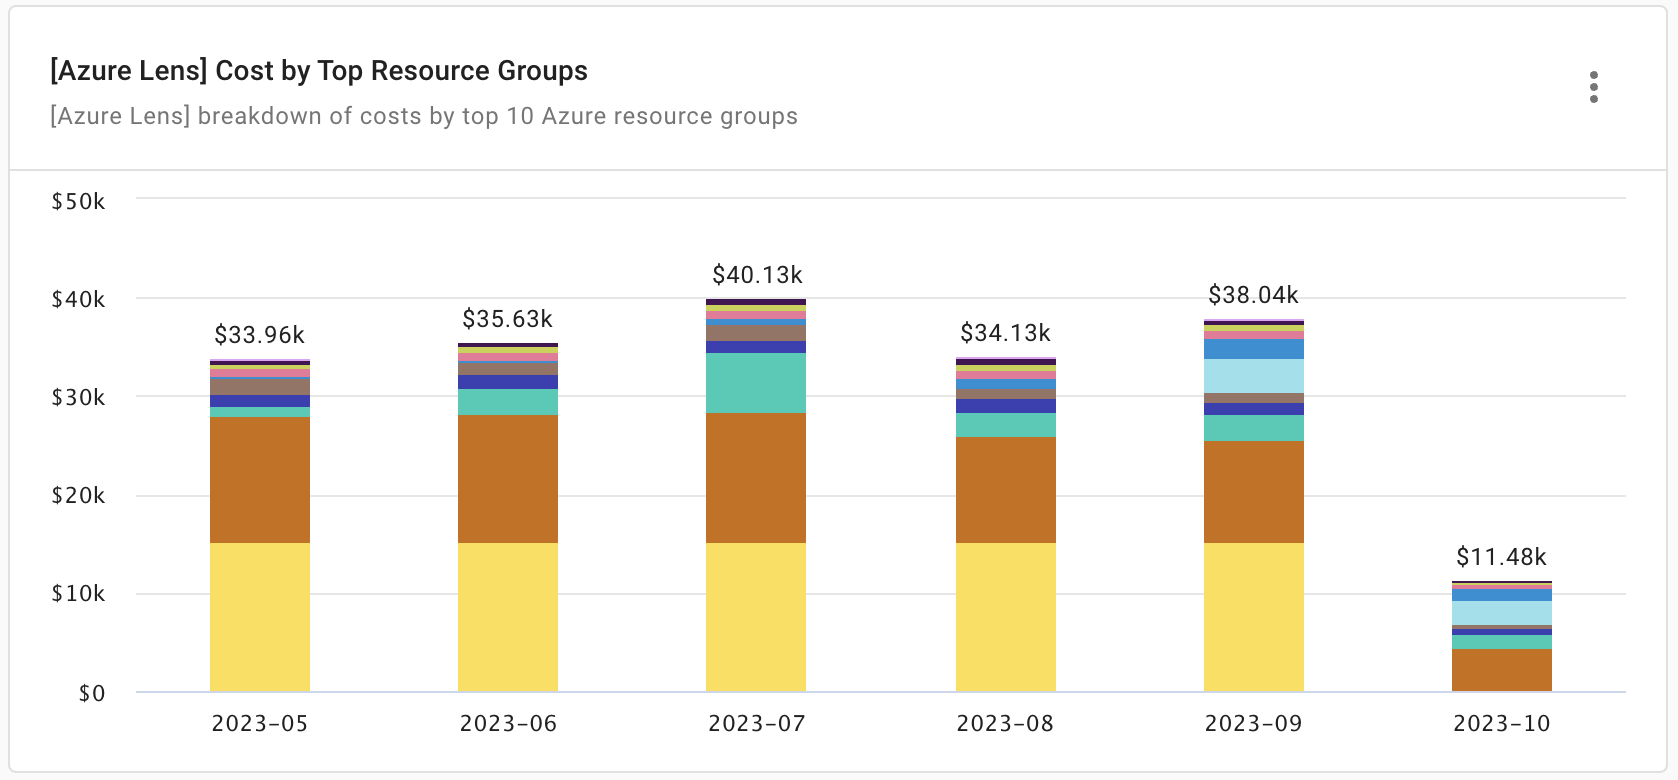
Report configuration:
- Metric: Cost
- Time Range: Last 6 months (include current month)
- Time Interval: Month
- Filter results: Provider equals
Microsoft Azure - Group by: Project/Account ID (Azure Project/Account ID maps to the cost details field
ResourceGroup) - Limit results:
- Limit by top/bottom: Project/Account ID—Limit to top 10 by cost
Cost By Top Regions
The widget shows the top 10 Azure regions by cost in the last 30 days, aggregated to monthly data.
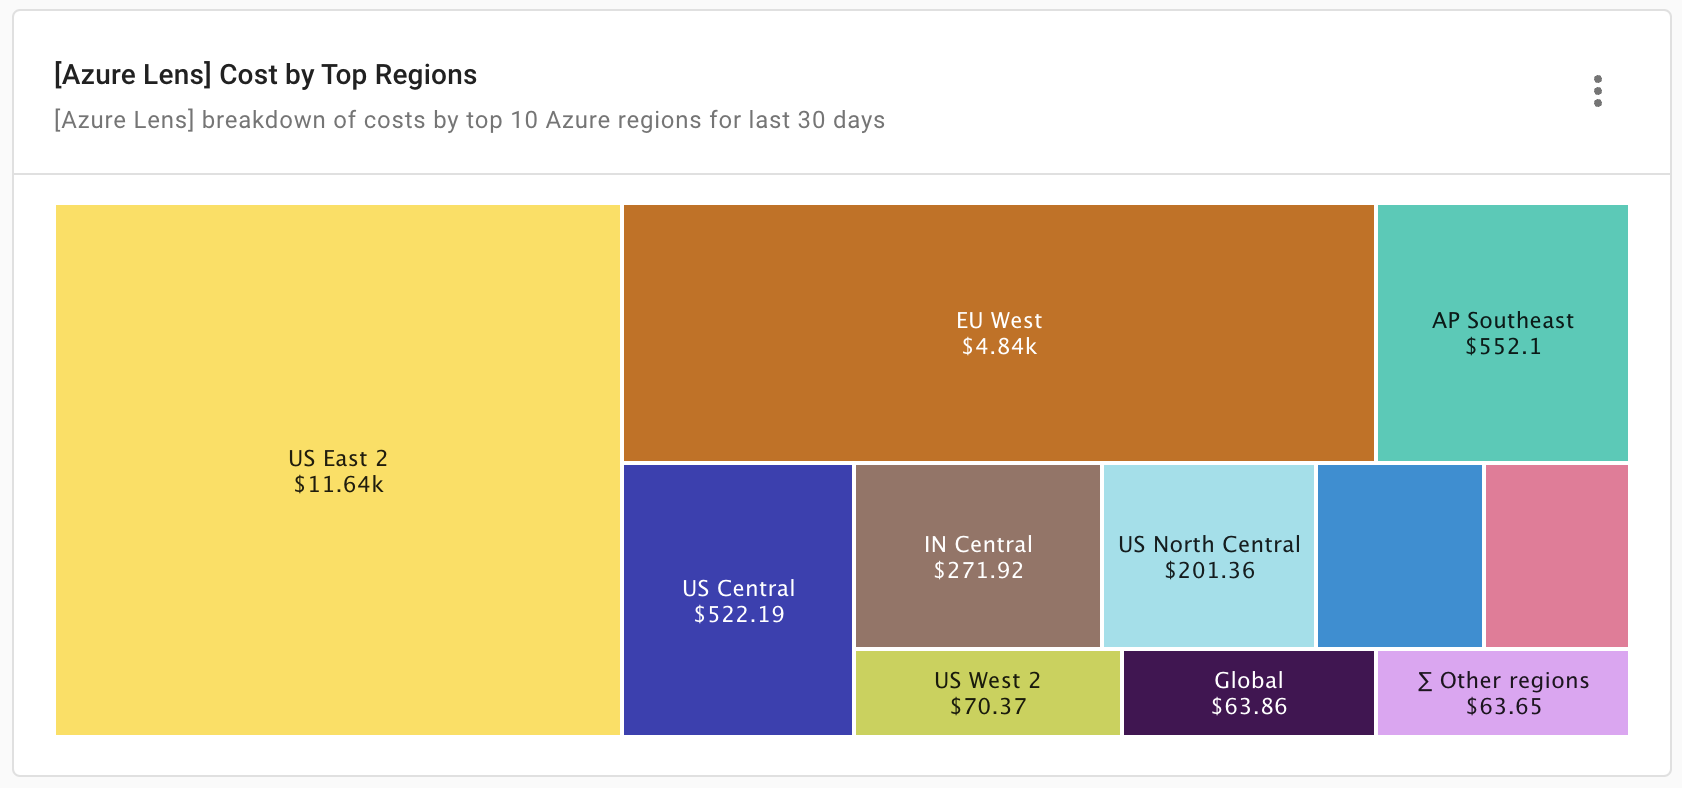
Report configuration:
- Metric: Cost
- Time Range: Last 30 days (include current day)
- Time Interval: Month
- Filter results: Provider equals
Microsoft Azure - Group by: Region
- Limit results:
- Limit by top/bottom: Region—not equals
[Region N/A]; Limit to top 10 by cost
- Limit by top/bottom: Region—not equals
Cost by Top Subscriptions
The widget shows the top Azure subscriptions by cost in the last 6 months.
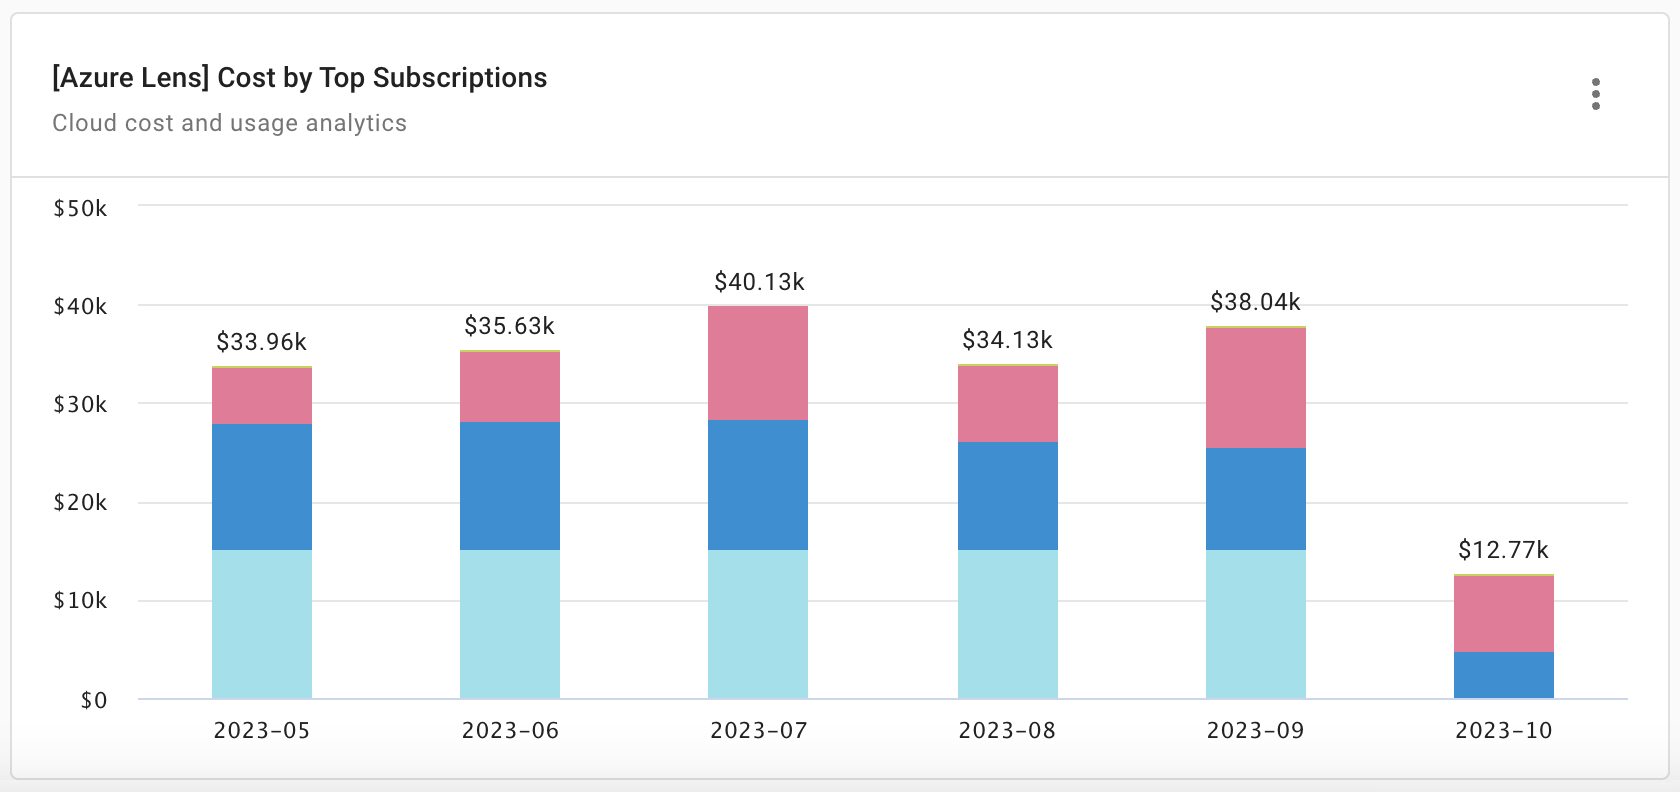
Report configuration:
- Metric: Cost
- Time Range: Last 6 months (include current month)
- Time Interval: Month
- Filter results: Provider equals
Microsoft Azure - Group by: Billing Account (Azure billing account maps to the cost details field
SubscriptionId) - Limit results:
- Limit by top/bottom: Billing Account—Limit to top 10 by cost
See also
- Cloud Analytics reports: Dimensions and labels