SQL で AWS コストスパイクを検出する
このチュートリアルでは、AWS の支出履歴を自前で保持し、それを SQL でクエリーするフローを作成します。カスタムスケジュールで毎朝フローを実行し、Date/time transform で前日の日付を計算し、AWS ノードで Cost Explorer からサービス単位の支出を取得します。さらに 3 つの Datastore ノードで日付の記録、単一の SQL 文によるスパイク検出、古い行の削除を行います。Filter と Notification ノード で、その結果を Slack アラートに変換します。
Goal and objectives
-
Goal: 外部データベースやデータウェアハウスのジョブを使わずに、「前日の支出が直近 30 日平均より 50% を超えて増加した AWS サービス」を名前付きで通知する Slack アラートを受け取れるようにします。
-
Objectives: このチュートリアルでは次の内容を学びます。
-
Datastore の Insert ノードを使ってローリングな履歴テーブルを構築する方法。
-
Datastore の Run SQL アクションで
SELECT文を書き、:nameパラメータで前のステップの値をバインドする方法。 -
フィルターや Slack メッセージで、クエリーの出力カラムを参照する方法。
-
スケジュールされた
DELETEによってテーブルサイズを抑える方法。
-
以下は完成したフローです。
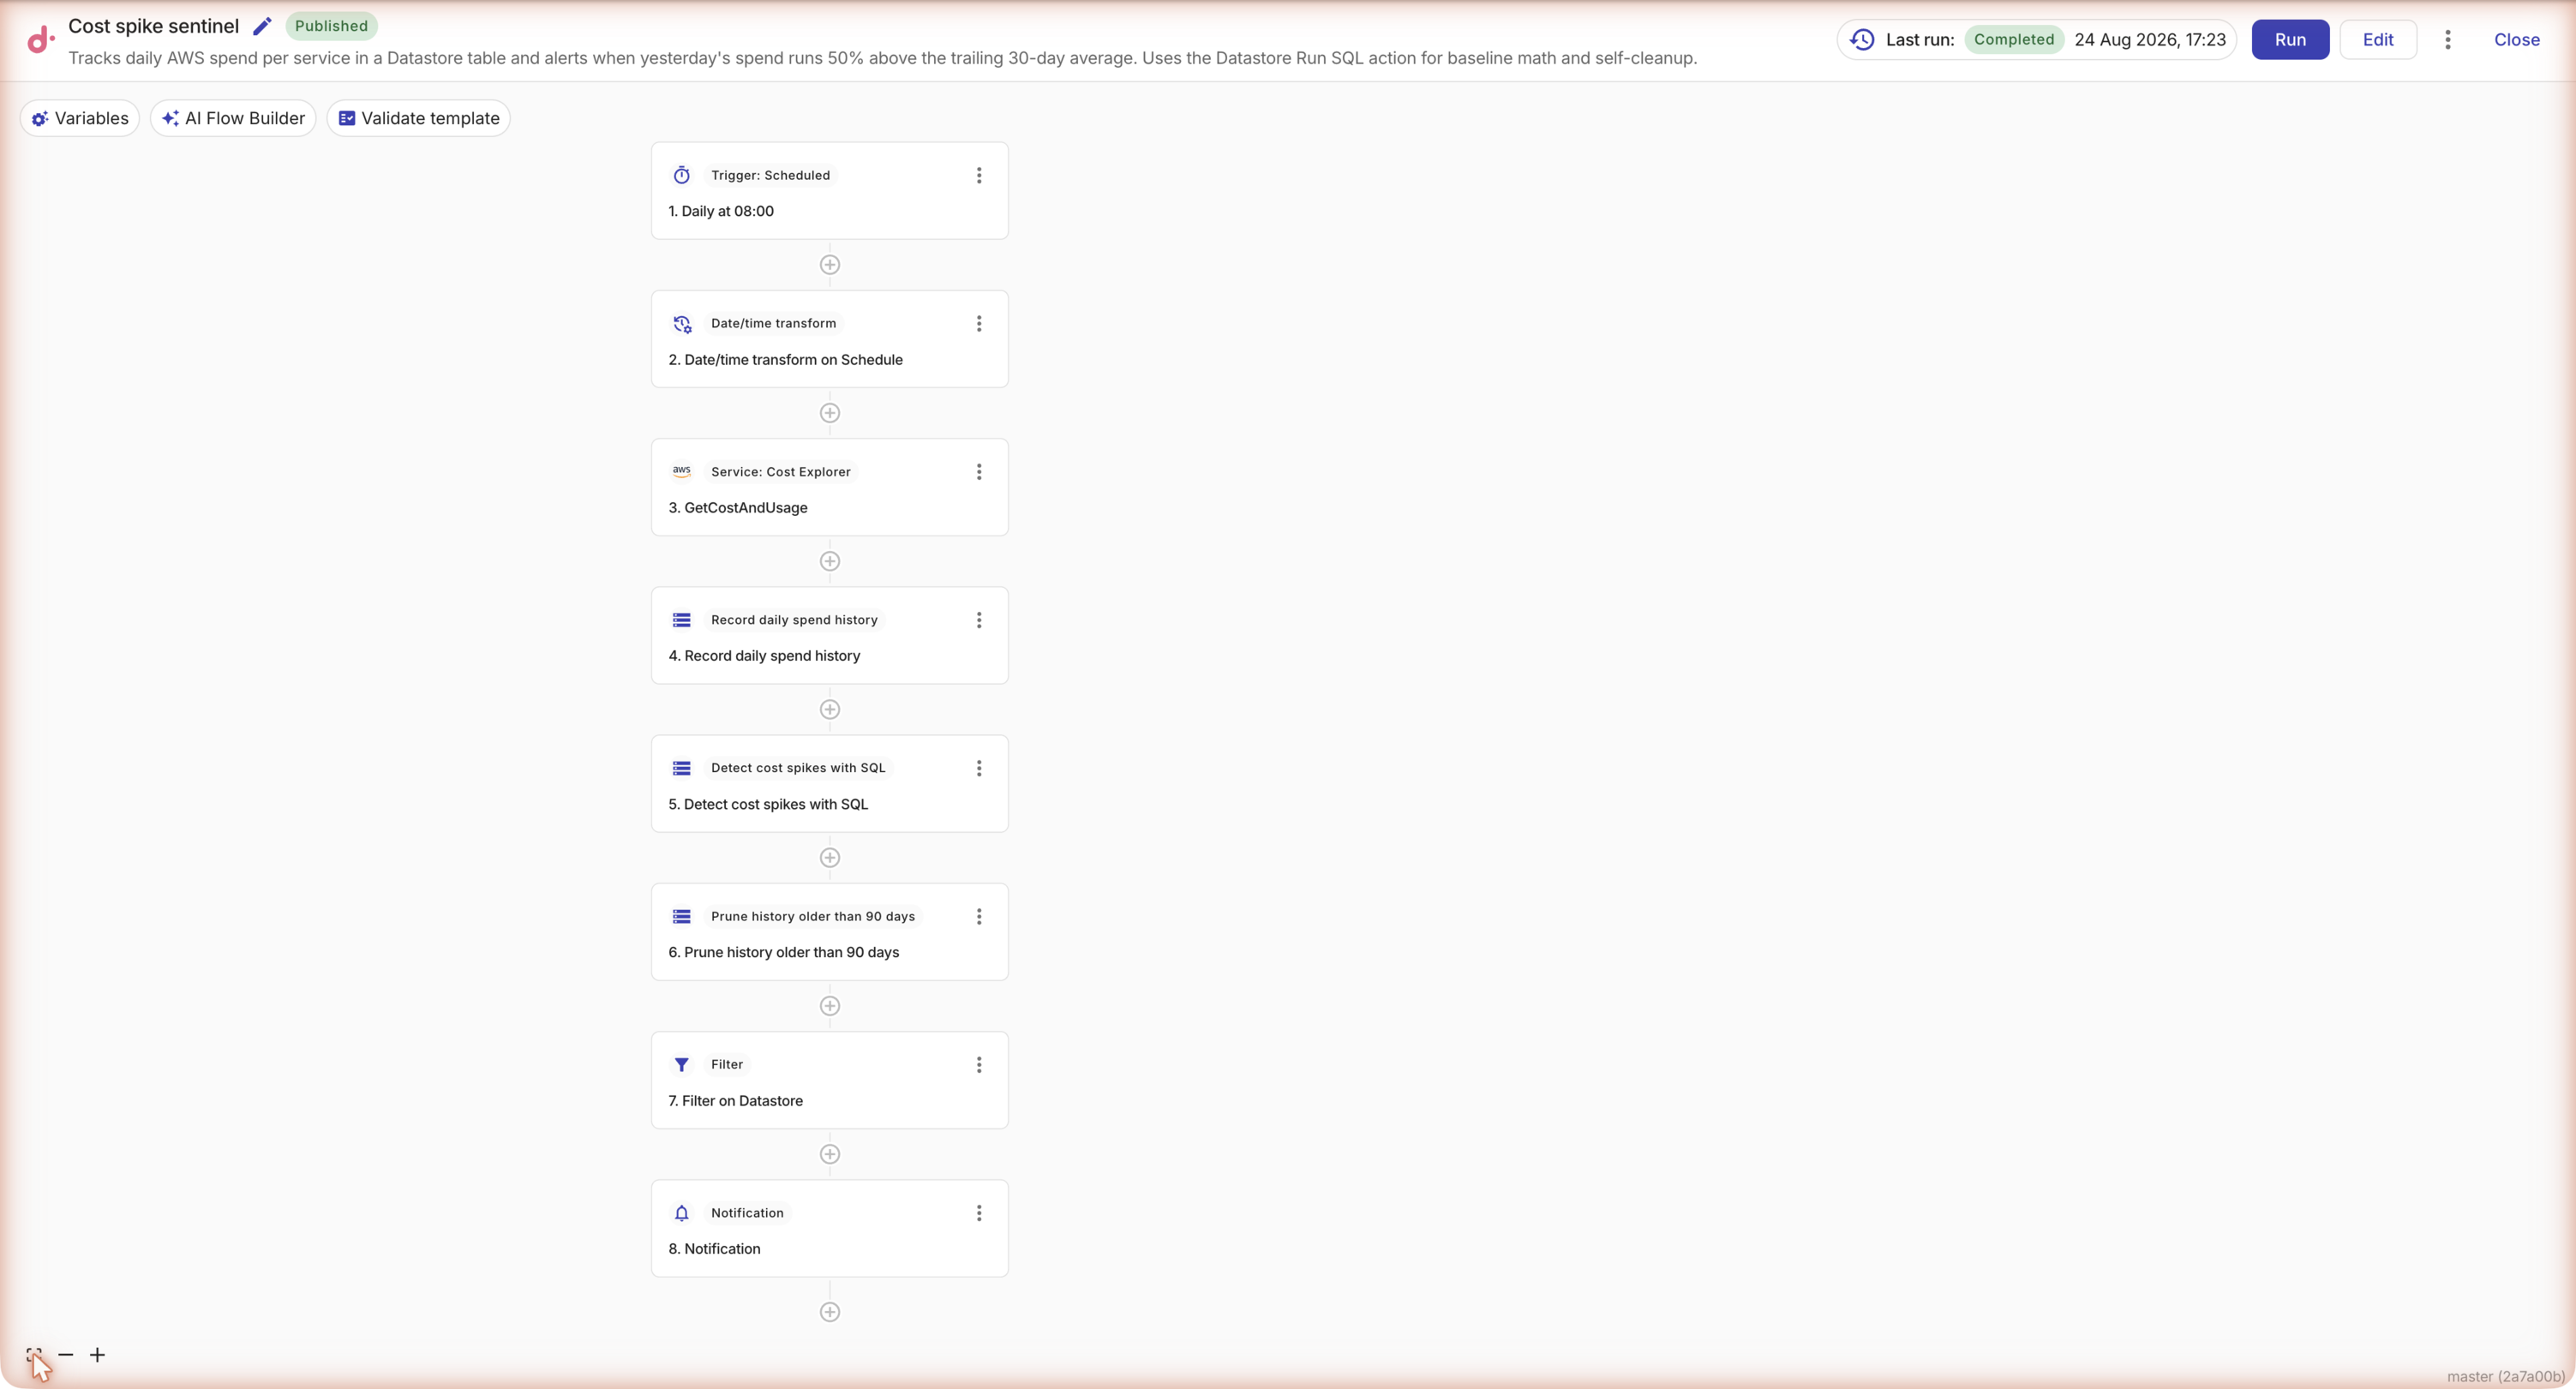
このフローの AWS への呼び出しはすべて読み取り専用です(ce:GetCostAndUsage)。書き込みが発生するのは、自身の Datastore テーブル内だけです。
Before you begin
-
DoiT アカウントに CloudFlow Editor または CloudFlow Manager の権限が付与されていることを確認してください。CloudFlow permissions を参照してください。
-
監視したい支出が発生するアカウントに対して、AWS CloudFlow 接続 を作成してください。このロールには
ce:GetCostAndUsage権限が必要です。 -
Slack を接続 し、アラートを受け取るチャンネルを特定してください。
Create the history table
このフローには、日次の支出を蓄積するテーブルが 1 つ必要です。
-
CloudFlow のランディングページで Tables を選択し、次に Create table を選択してください。
-
Table name に
daily_service_spendと入力してください。 -
次の 3 つのカラムを定義してください。
Column Data type Notes dayDate 利用日であり、サービス・日付ごとに 1 行となります。 serviceText AWS サービス名。例: AWS WAF。costText Cost Explorer は金額を文字列として返します。SQL は計算時にこれを数値にキャストします。 -
Save を選択してください。
cost をあえて Text カラムにしています。Cost Explorer は Metrics.UnblendedCost.Amount を文字列として返し、Numeric カラムは数値参照のみ受け付けます。生の文字列を保存し、SQL 内でキャストする(cost::numeric)ことで、Insert ノードをシンプルに保てます。
Create the flow
-
DoiT コンソール にサインインし、トップナビゲーションのメガメニューから Automation and operations を選択し、CloudFlow を選択してください。
-
Create flow を選択し、
Cost spike sentinelなどの名前と説明を追加してください。
Configure the schedule trigger
-
Scheduled トリガーを追加してください。
-
頻度を Daily に設定し、開始日を選択して、実行時間とタイムゾーンを指定してください。前日の利用分はその時点でほぼ確定しているため、早朝の実行が適しています。
Compute yesterday's date
Cost Explorer には日付が必要であり、後で使用する SQL にも同じ日付が必要です。1 つの transform で両方を生成します。
-
トリガーの後に Date/time transform ノードを追加してください。
-
Input をトリガーの
startTimeに設定してください。 -
Subtract 変換を追加し、
1Day を指定し、出力名をyesterdayTsとしてください。 -
直前のステップに対して Format 変換をチェーンし、パターンを
YYYY-MM-DD、出力名をyesterdayとしてください。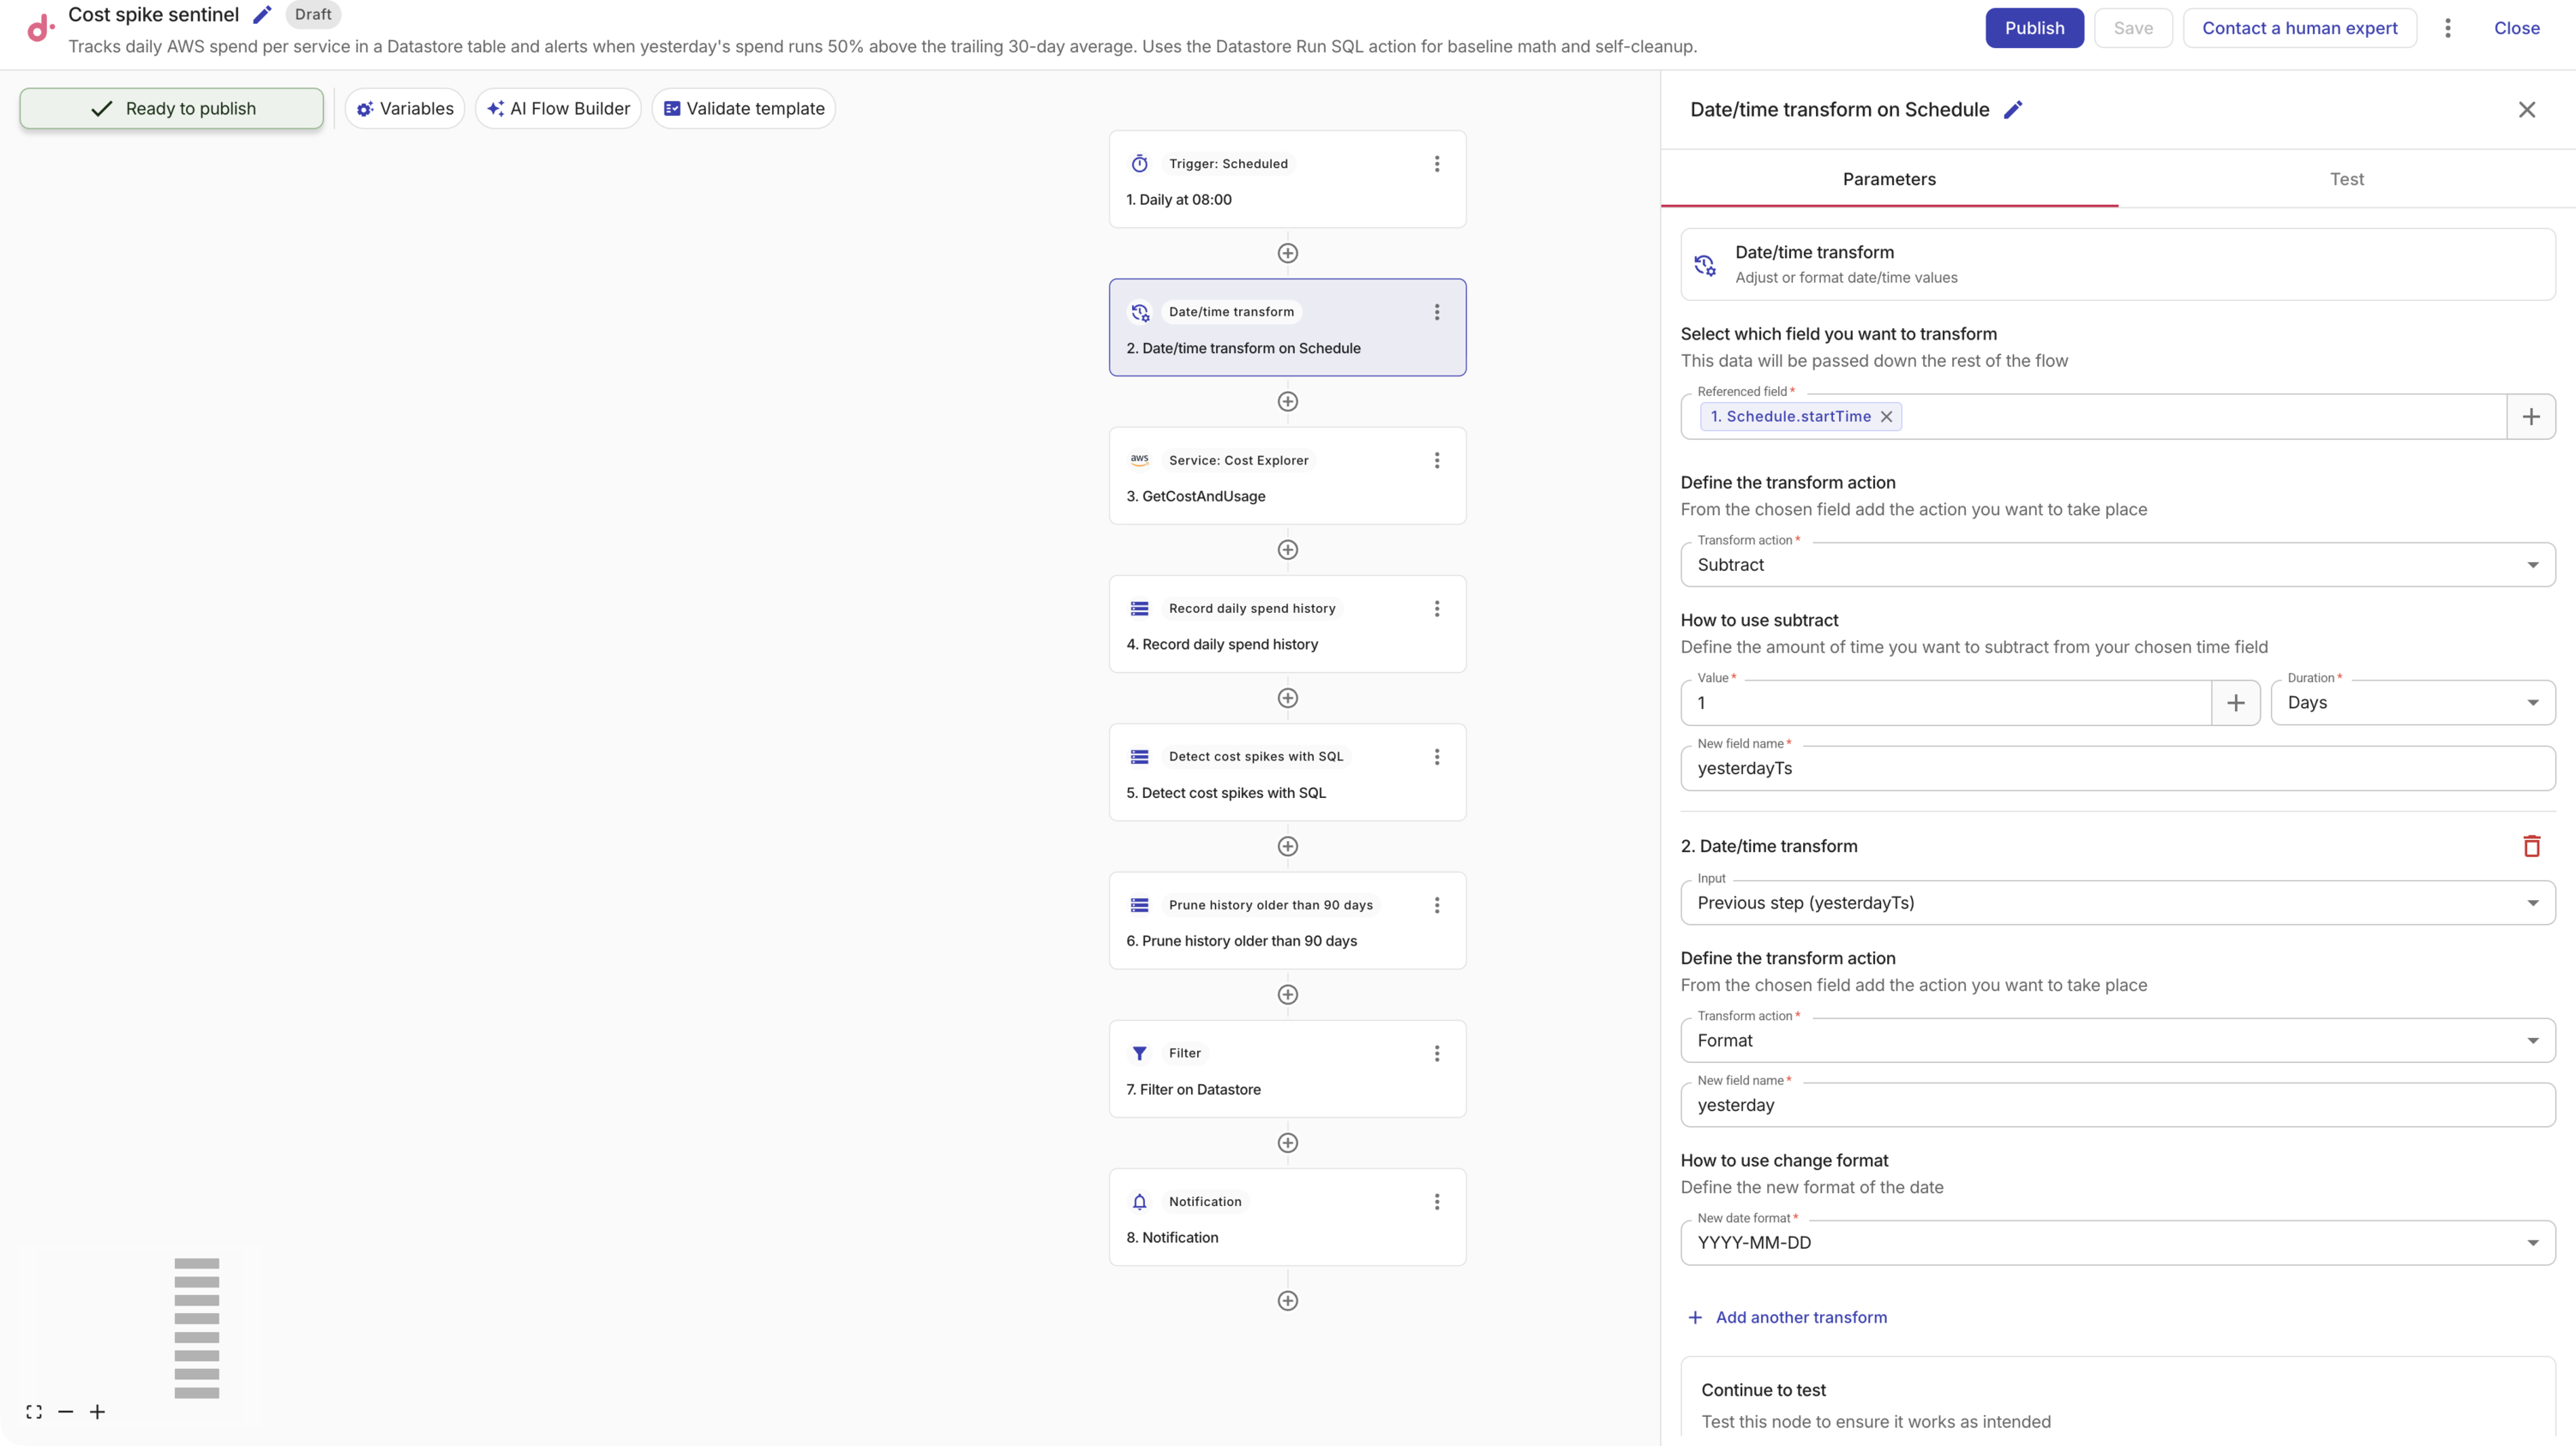
これでフローには yesterday という文字列ができ、後続のすべてのノードから参照できます。
Fetch yesterday's spend per service
-
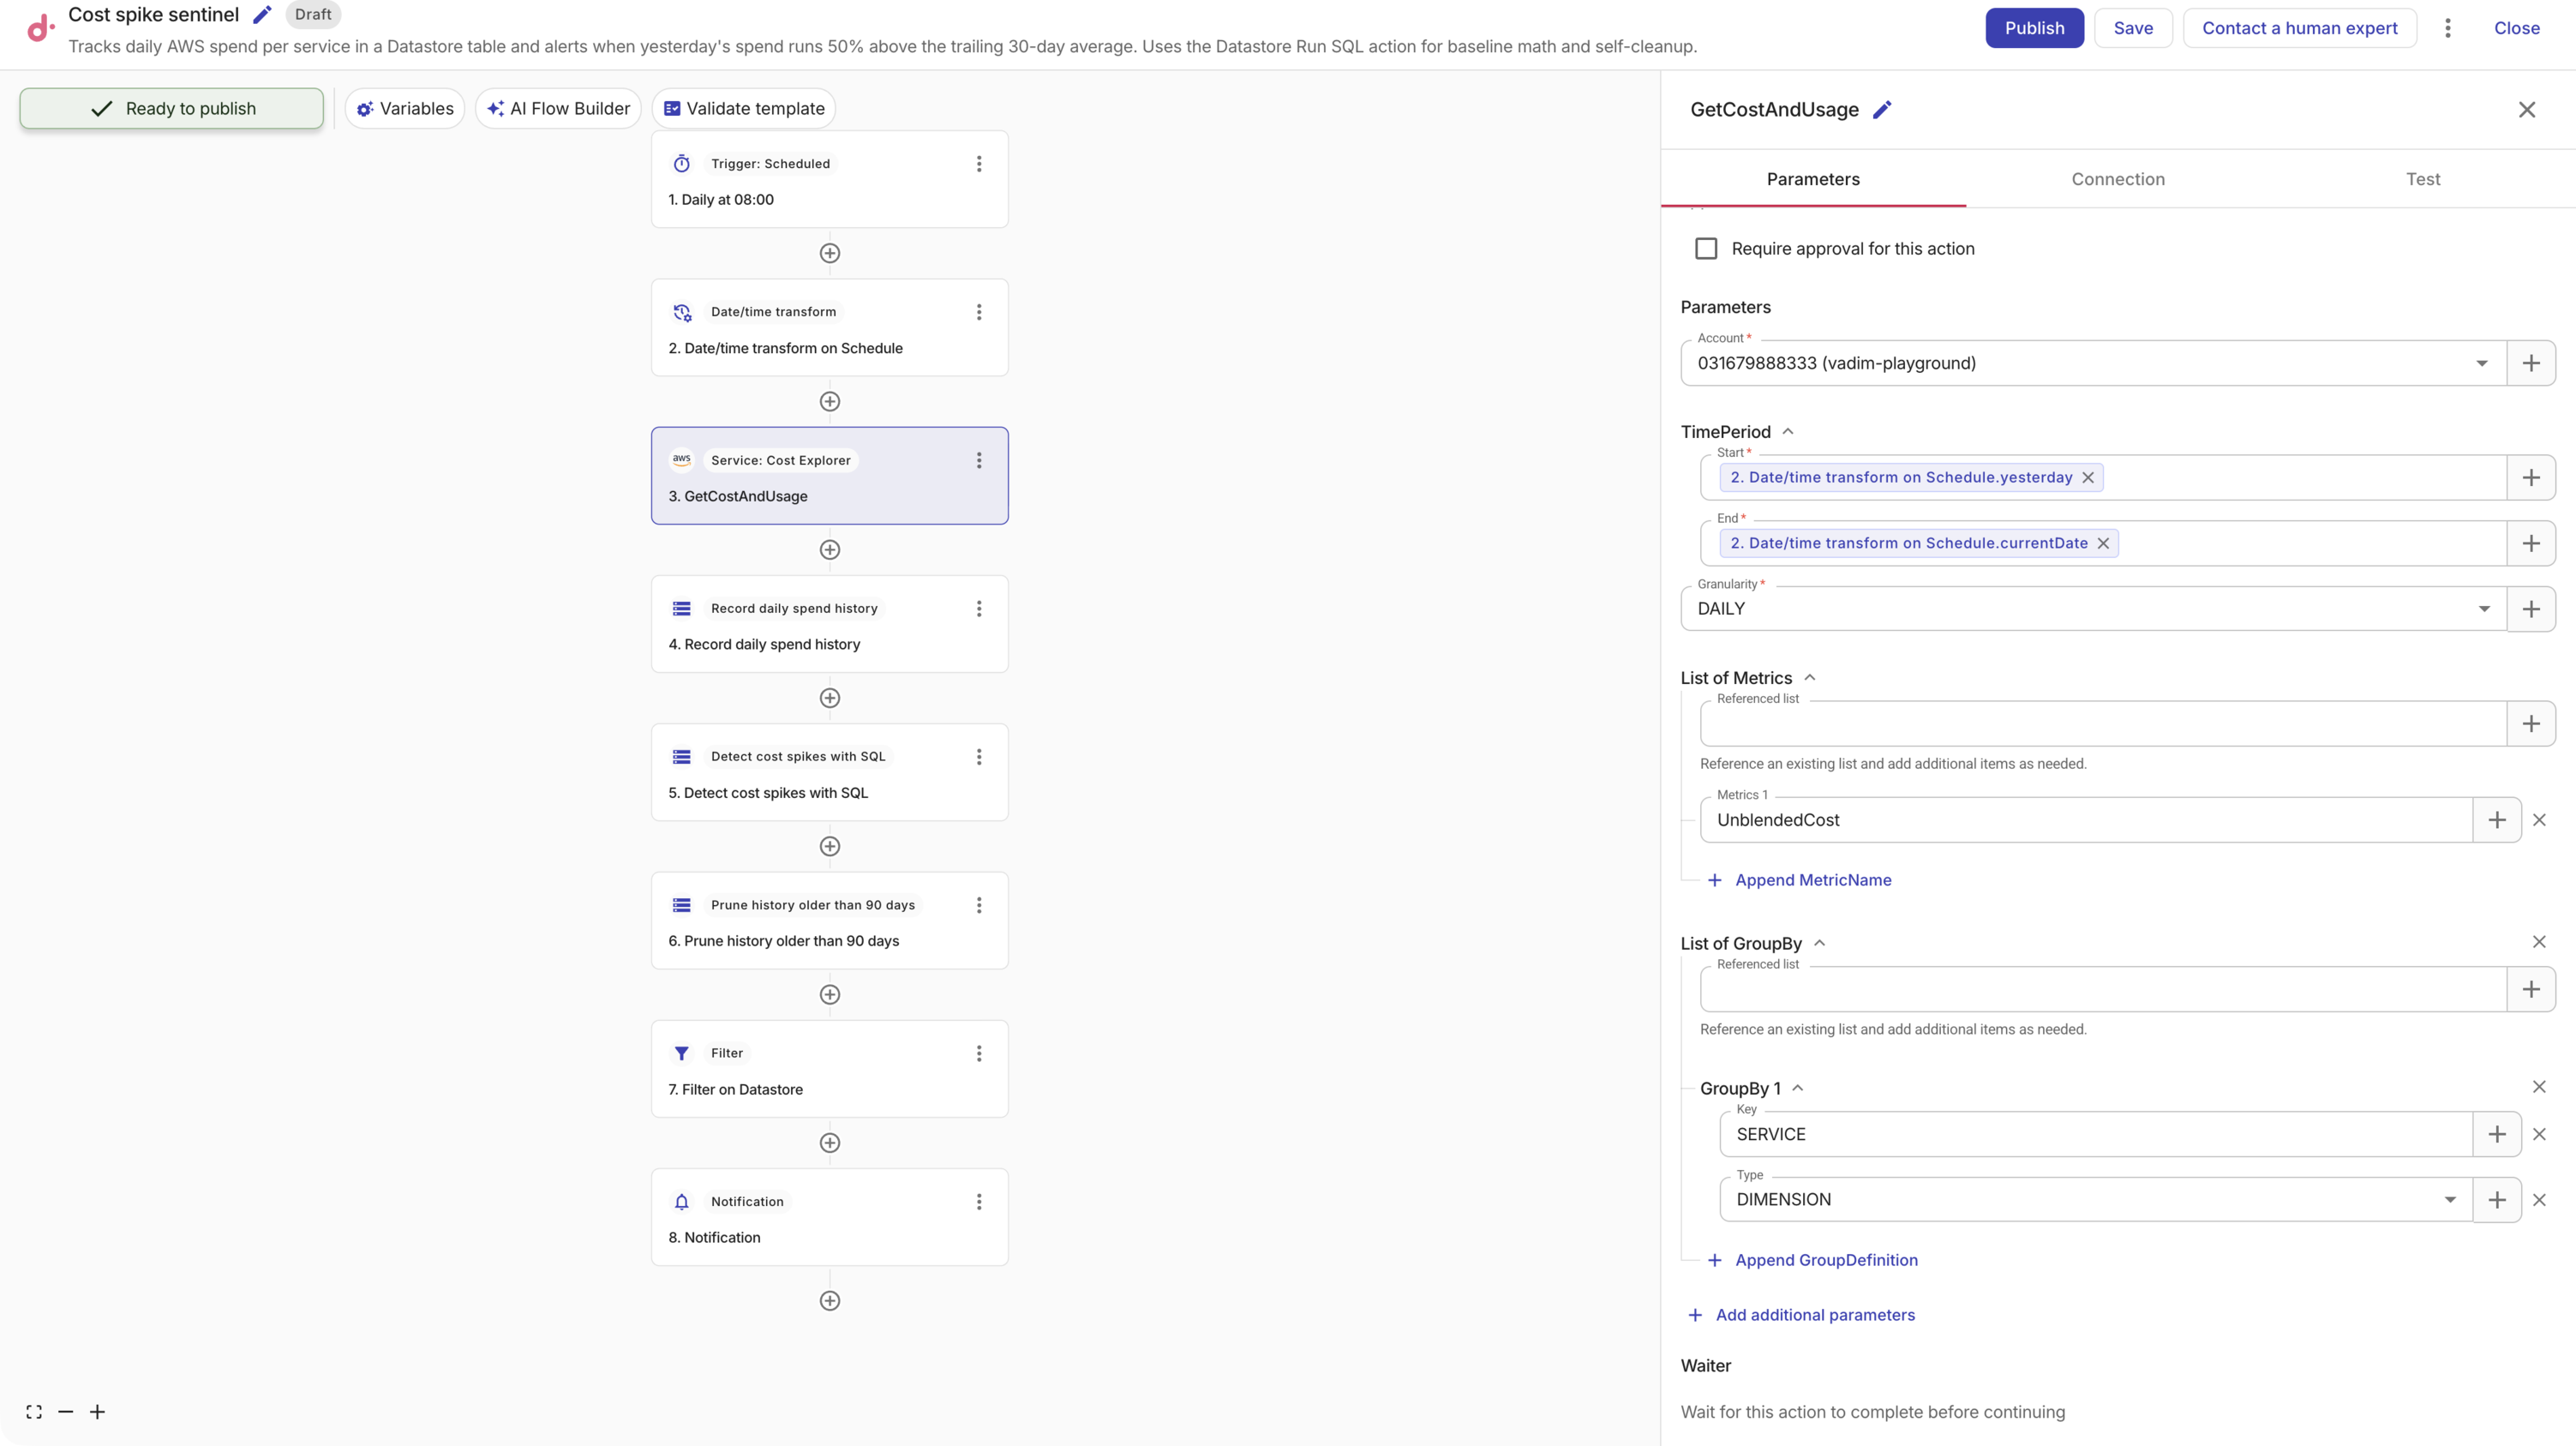
AWS ノードを追加し、Cost Explorer サービスと
GetCostAndUsageオペレーションを選択し、AWS 接続およびアカウントを選択してください。 -
パラメータを設定してください。
-
TimePeriod → Start: Date/time transform の
yesterdayを参照します。 -
TimePeriod → End: トリガーの
currentDateを参照します。Cost Explorer はEndを排他的として扱うため、ちょうど 1 日分が返されます。 -
Granularity:
DAILY -
Metrics 1:
UnblendedCost -
GroupBy 1: Key
SERVICE、TypeDIMENSION
-
-
Test タブを開き、Save as test data を選択したまま Run test を選択してください。レスポンスには
ResultsByTime[0].Groupsが含まれ、サービスごとに 1 エントリあり、次のノードでこの情報をテーブルにマッピングします。
Record the day in the table
-
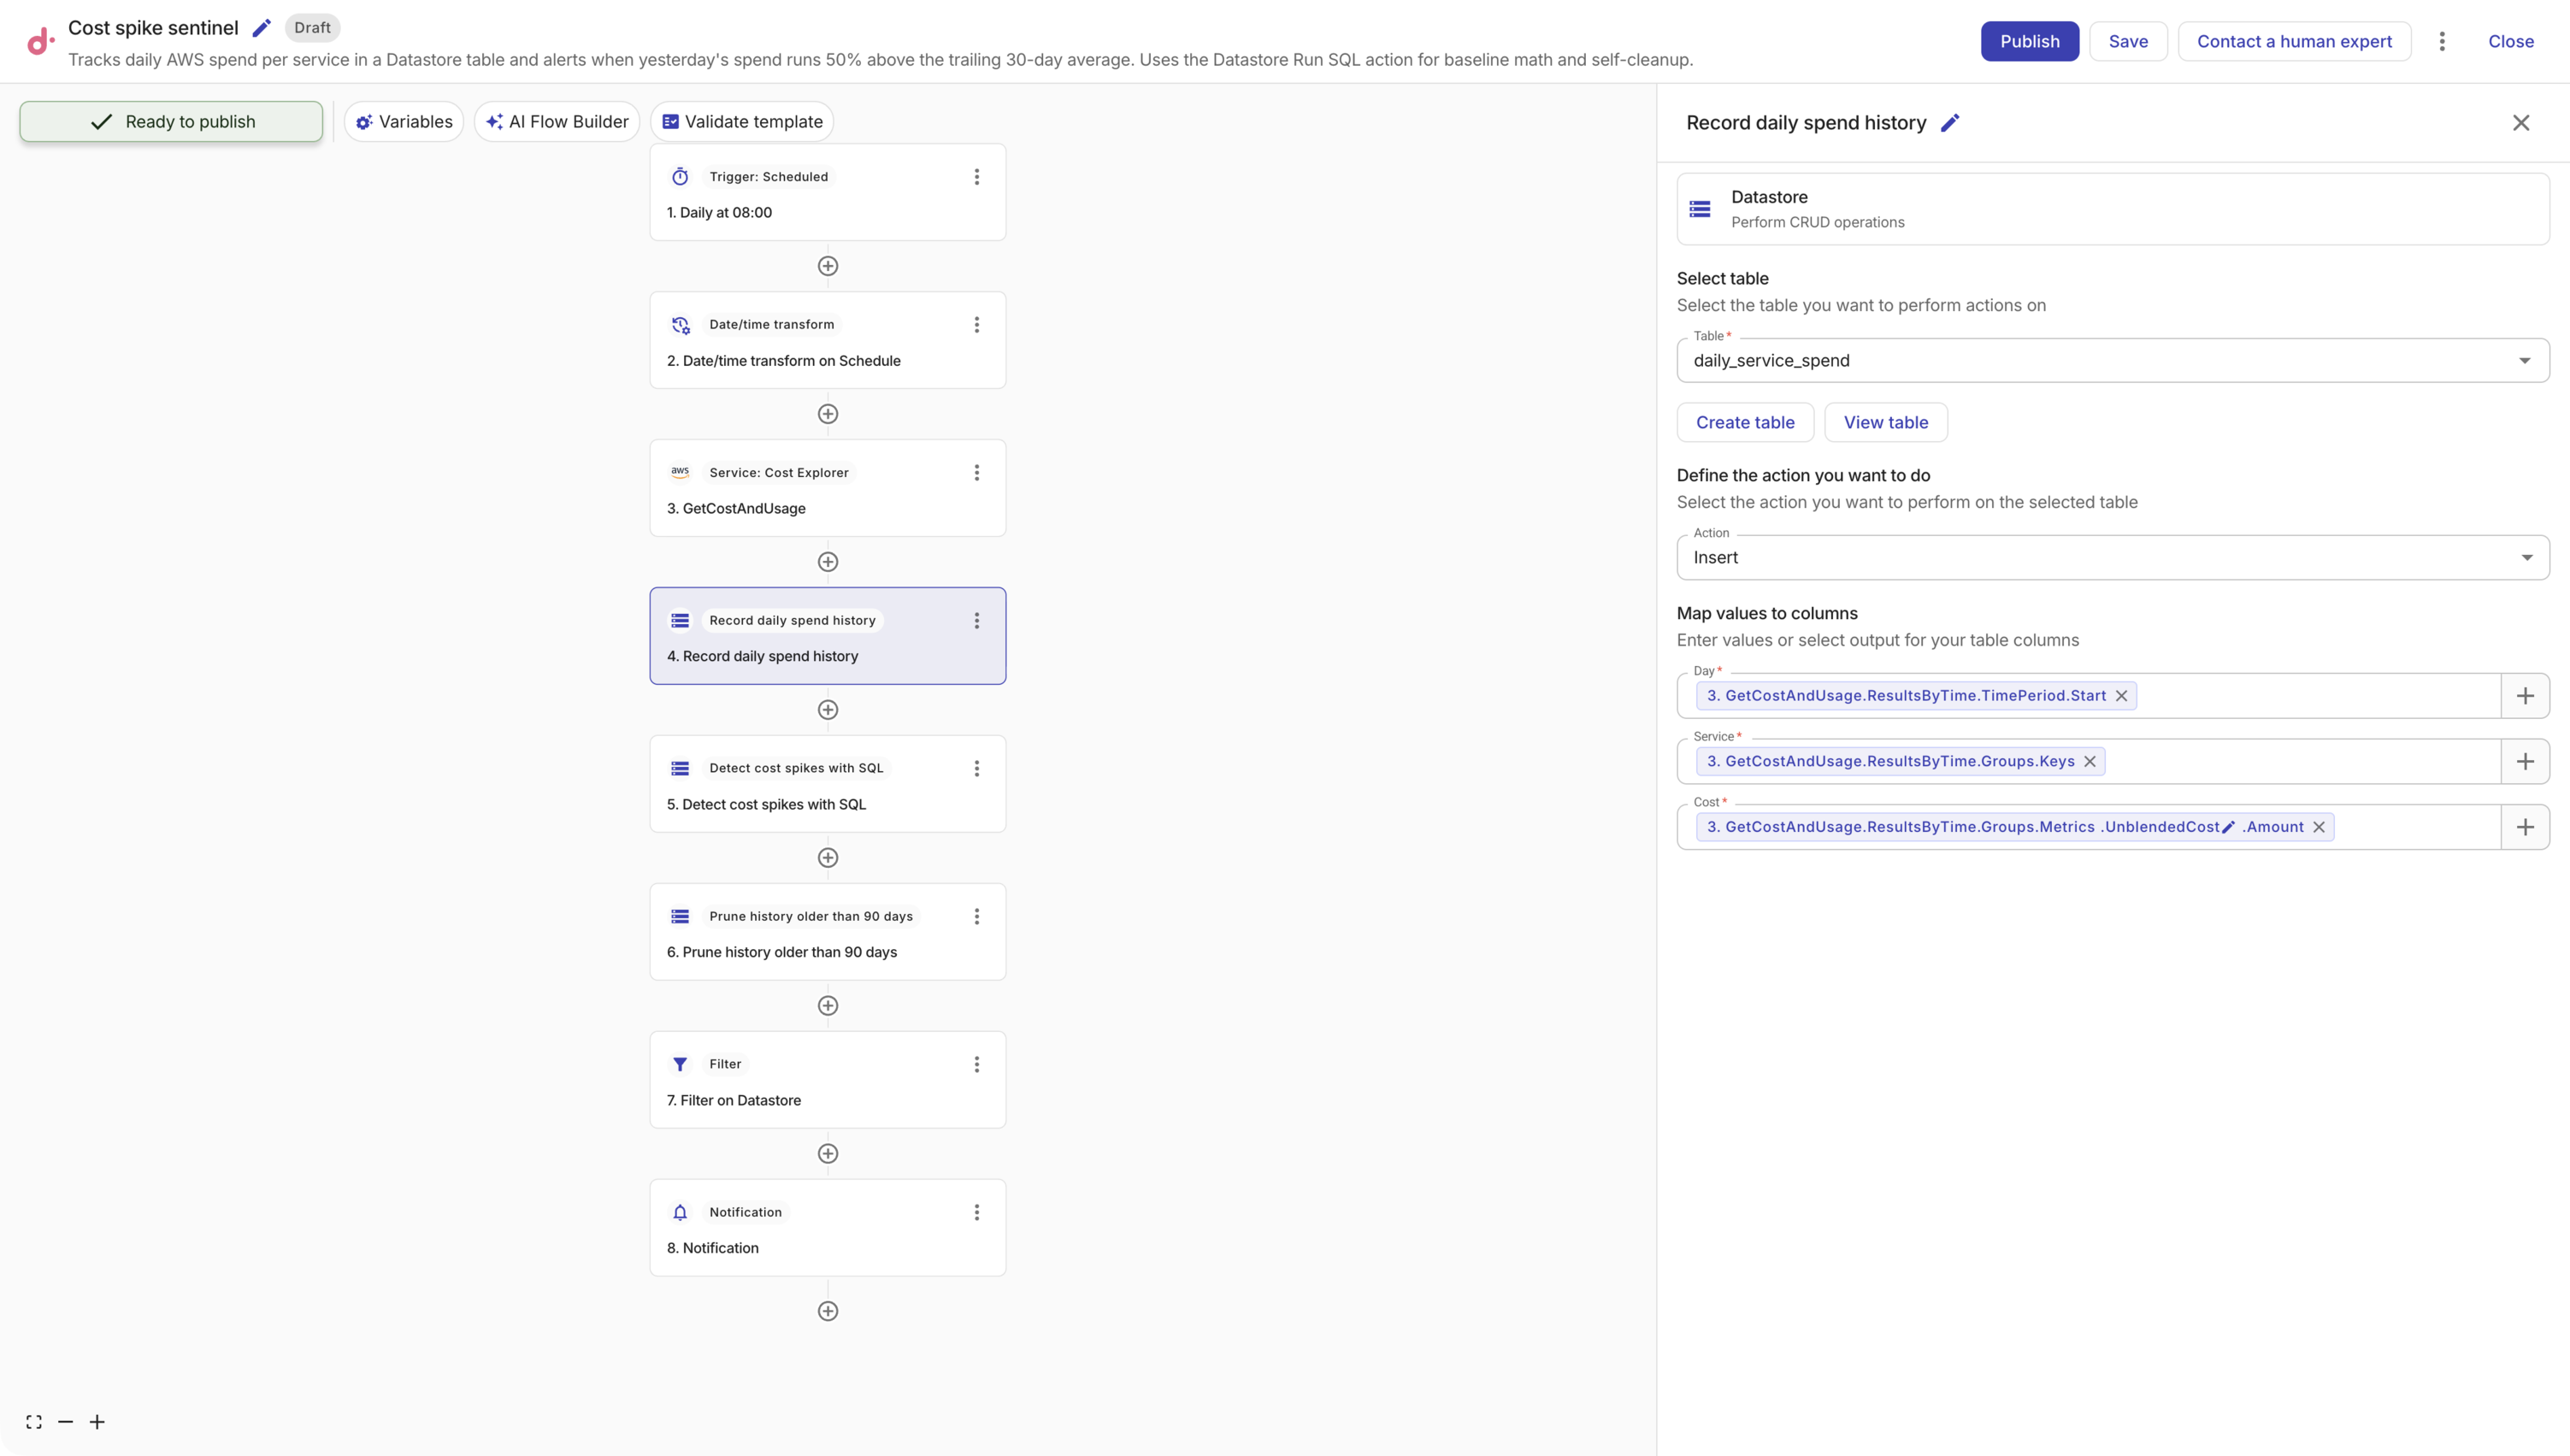
Datastore ノードを追加し、
daily_service_spendテーブルを選択し、Insert アクションをそのまま使用してください。 -
各カラムを Cost Explorer の出力にマッピングしてください。このノードはグループごとに自動的に 1 行を挿入します。
-
Day:
ResultsByTime.TimePeriod.Start -
Service:
ResultsByTime.Groups.Keys -
Cost:
ResultsByTime.Groups.Metricsを選択し、マップキーとしてUnblendedCostを入力し、Amountを選択します。
-
3 つのカラムはいずれも同じノードを参照します。1 つのノードのパラメータが参照できるのは、トリガー以外のステップが 1 つだけのため、日付は Date/time transform ではなく Cost Explorer のレスポンスから取得しています。
Detect spikes with SQL
ここで分析を行うノードを設定します。前日と、それ以前のすべての日付をテーブル内で比較します。
-
2 つ目の Datastore ノードを追加し、同じテーブルを選択して、アクションを Run SQL に設定してください。
-
次のステートメントを入力してください。
WITH baseline AS (SELECT service, AVG(cost::numeric) AS avg_costFROM daily_service_spendWHERE day < :yesterday::dateAND day >= :yesterday::date - 30GROUP BY service)SELECT s.service,ROUND(s.cost::numeric, 2) AS yesterday_cost,ROUND(b.avg_cost, 2) AS avg_cost,ROUND(s.cost::numeric / NULLIF(b.avg_cost, 0), 2) AS spike_ratioFROM daily_service_spend sJOIN baseline b ON b.service = s.serviceWHERE s.day = :yesterday::dateAND s.cost::numeric > 1.5 * b.avg_costORDER BY spike_ratio DESCこの共通テーブル式は、前日より前の 30 日間におけるサービスごとの平均コストを算出し、メインクエリーは前日の行とその平均を結合します。
WHERE句では、その平均より 50% を超えて高いサービスのみを残します。NULLIFを使うことで、履歴がすべて 0 のサービスでゼロ除算が起きるのを防いでいます。どちらの日付境界も重要です。下限がない場合、平均はテーブル内のすべての行を対象にしてしまい、履歴が蓄積されるにつれて比較ウィンドウが暗黙的に広がってしまいます。
-
Bind parameters で Add parameter を選択し、名前を
yesterdayとしてください。次に Add additional parameters を選択し、yesterdayチェックボックスをオンにして確定してください。 -
表示される Yesterday フィールドで、Date/time transform の
yesterdayを参照してください。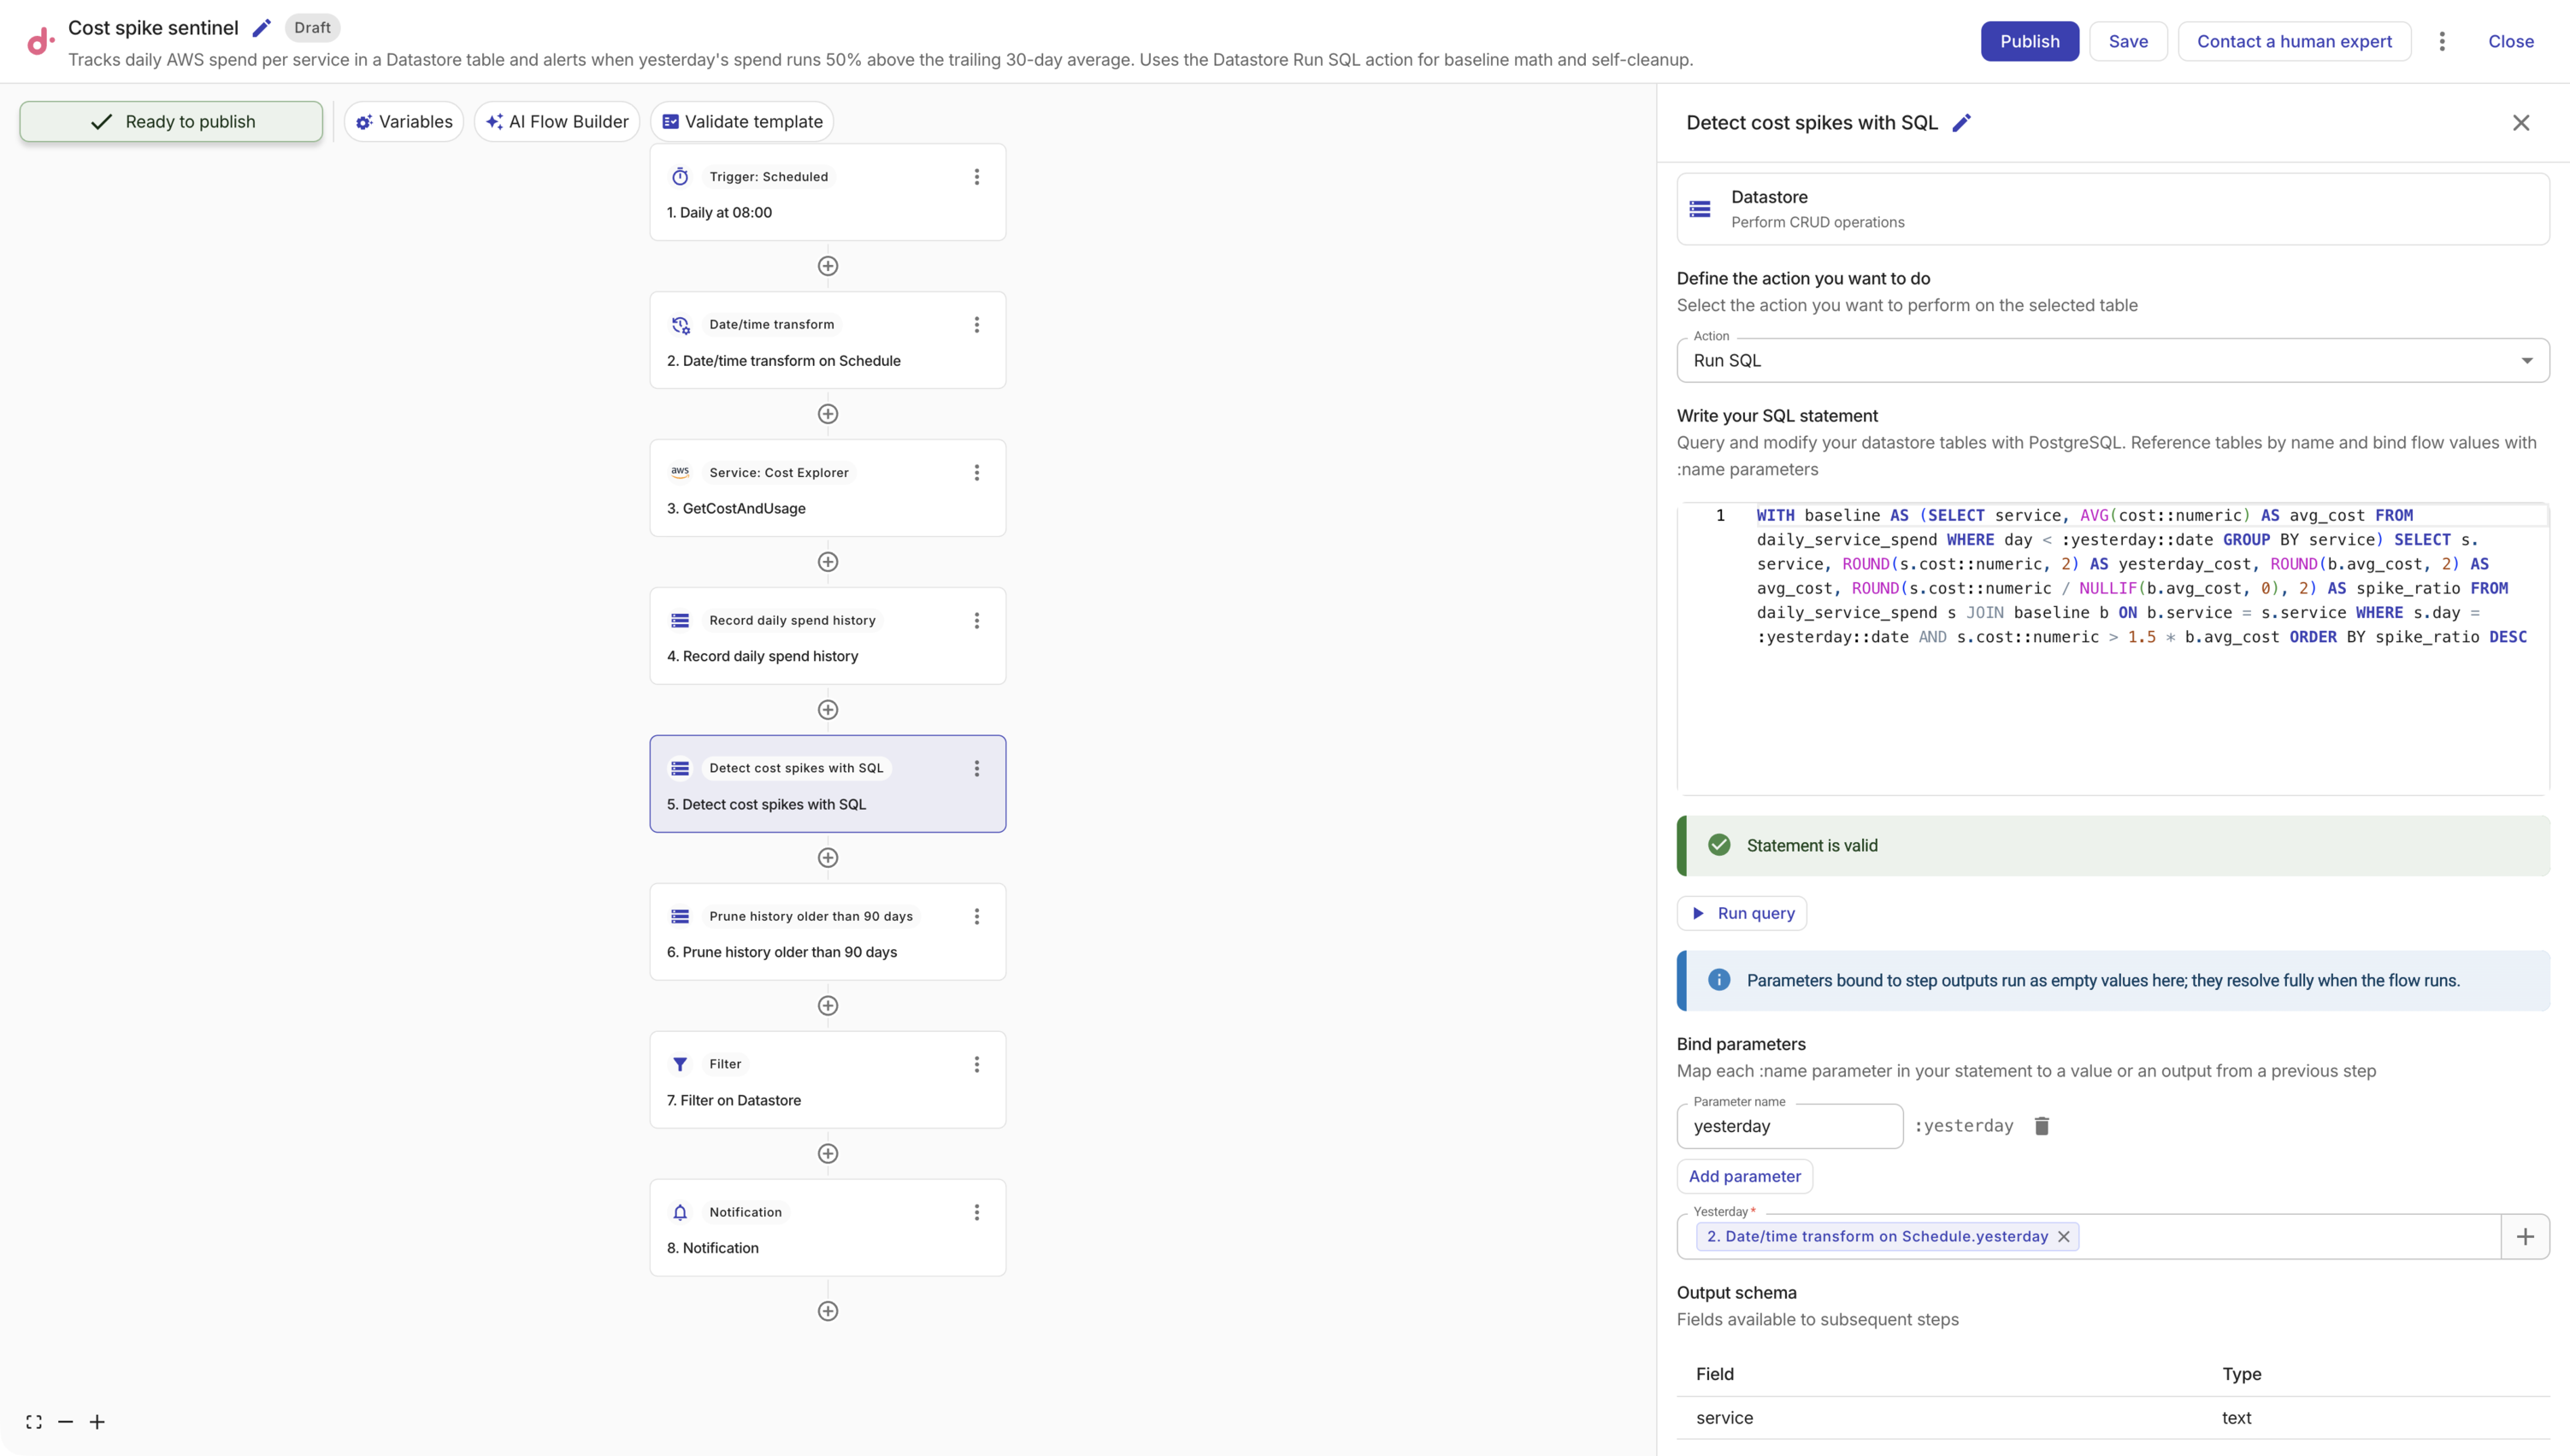
-
Run query を選択して検証してください。ステートメントが有効になると、Output schema にクエリーが返すカラム
service、yesterday_cost、avg_cost、spike_ratioが表示されます。フィルターと Slack メッセージはこれらの名前を参照します。
ステップ出力にバインドされたパラメータは、エディタ内で Run query を選択したときには空値として解決されます。実際のフロー実行時に完全に解決されます。
Prune old history
このステップがない場合、テーブルは無制限に成長してしまいます。ここでは 1 つのステートメントで履歴を 90 日に制限します。これは 30 日の比較ウィンドウよりも意図的に長くしてあり、アラートの内容を検証したいときに参照できる履歴が残るようにしています。
-
同じテーブルに対して 3 つ目の Datastore ノードを追加し、アクションを Run SQL にしてください。
-
次のステートメントを入力してください。
DELETE FROM daily_service_spend WHERE day < :yesterday::date - 90 -
前のノードと同じ方法で
yesterdayのバインドパラメータを追加し、再度 Date/time transform を参照してください。
このノードは Filter の前に配置し、スパイクがない日も含めて、すべての実行で pruning が行われるようにしてください。
Filter to real spikes
-
Filter ノードを追加してください。
-
Field をスパイク検出ノードの出力に設定してください。
-
条件として
spike_ratio>1.5を追加してください。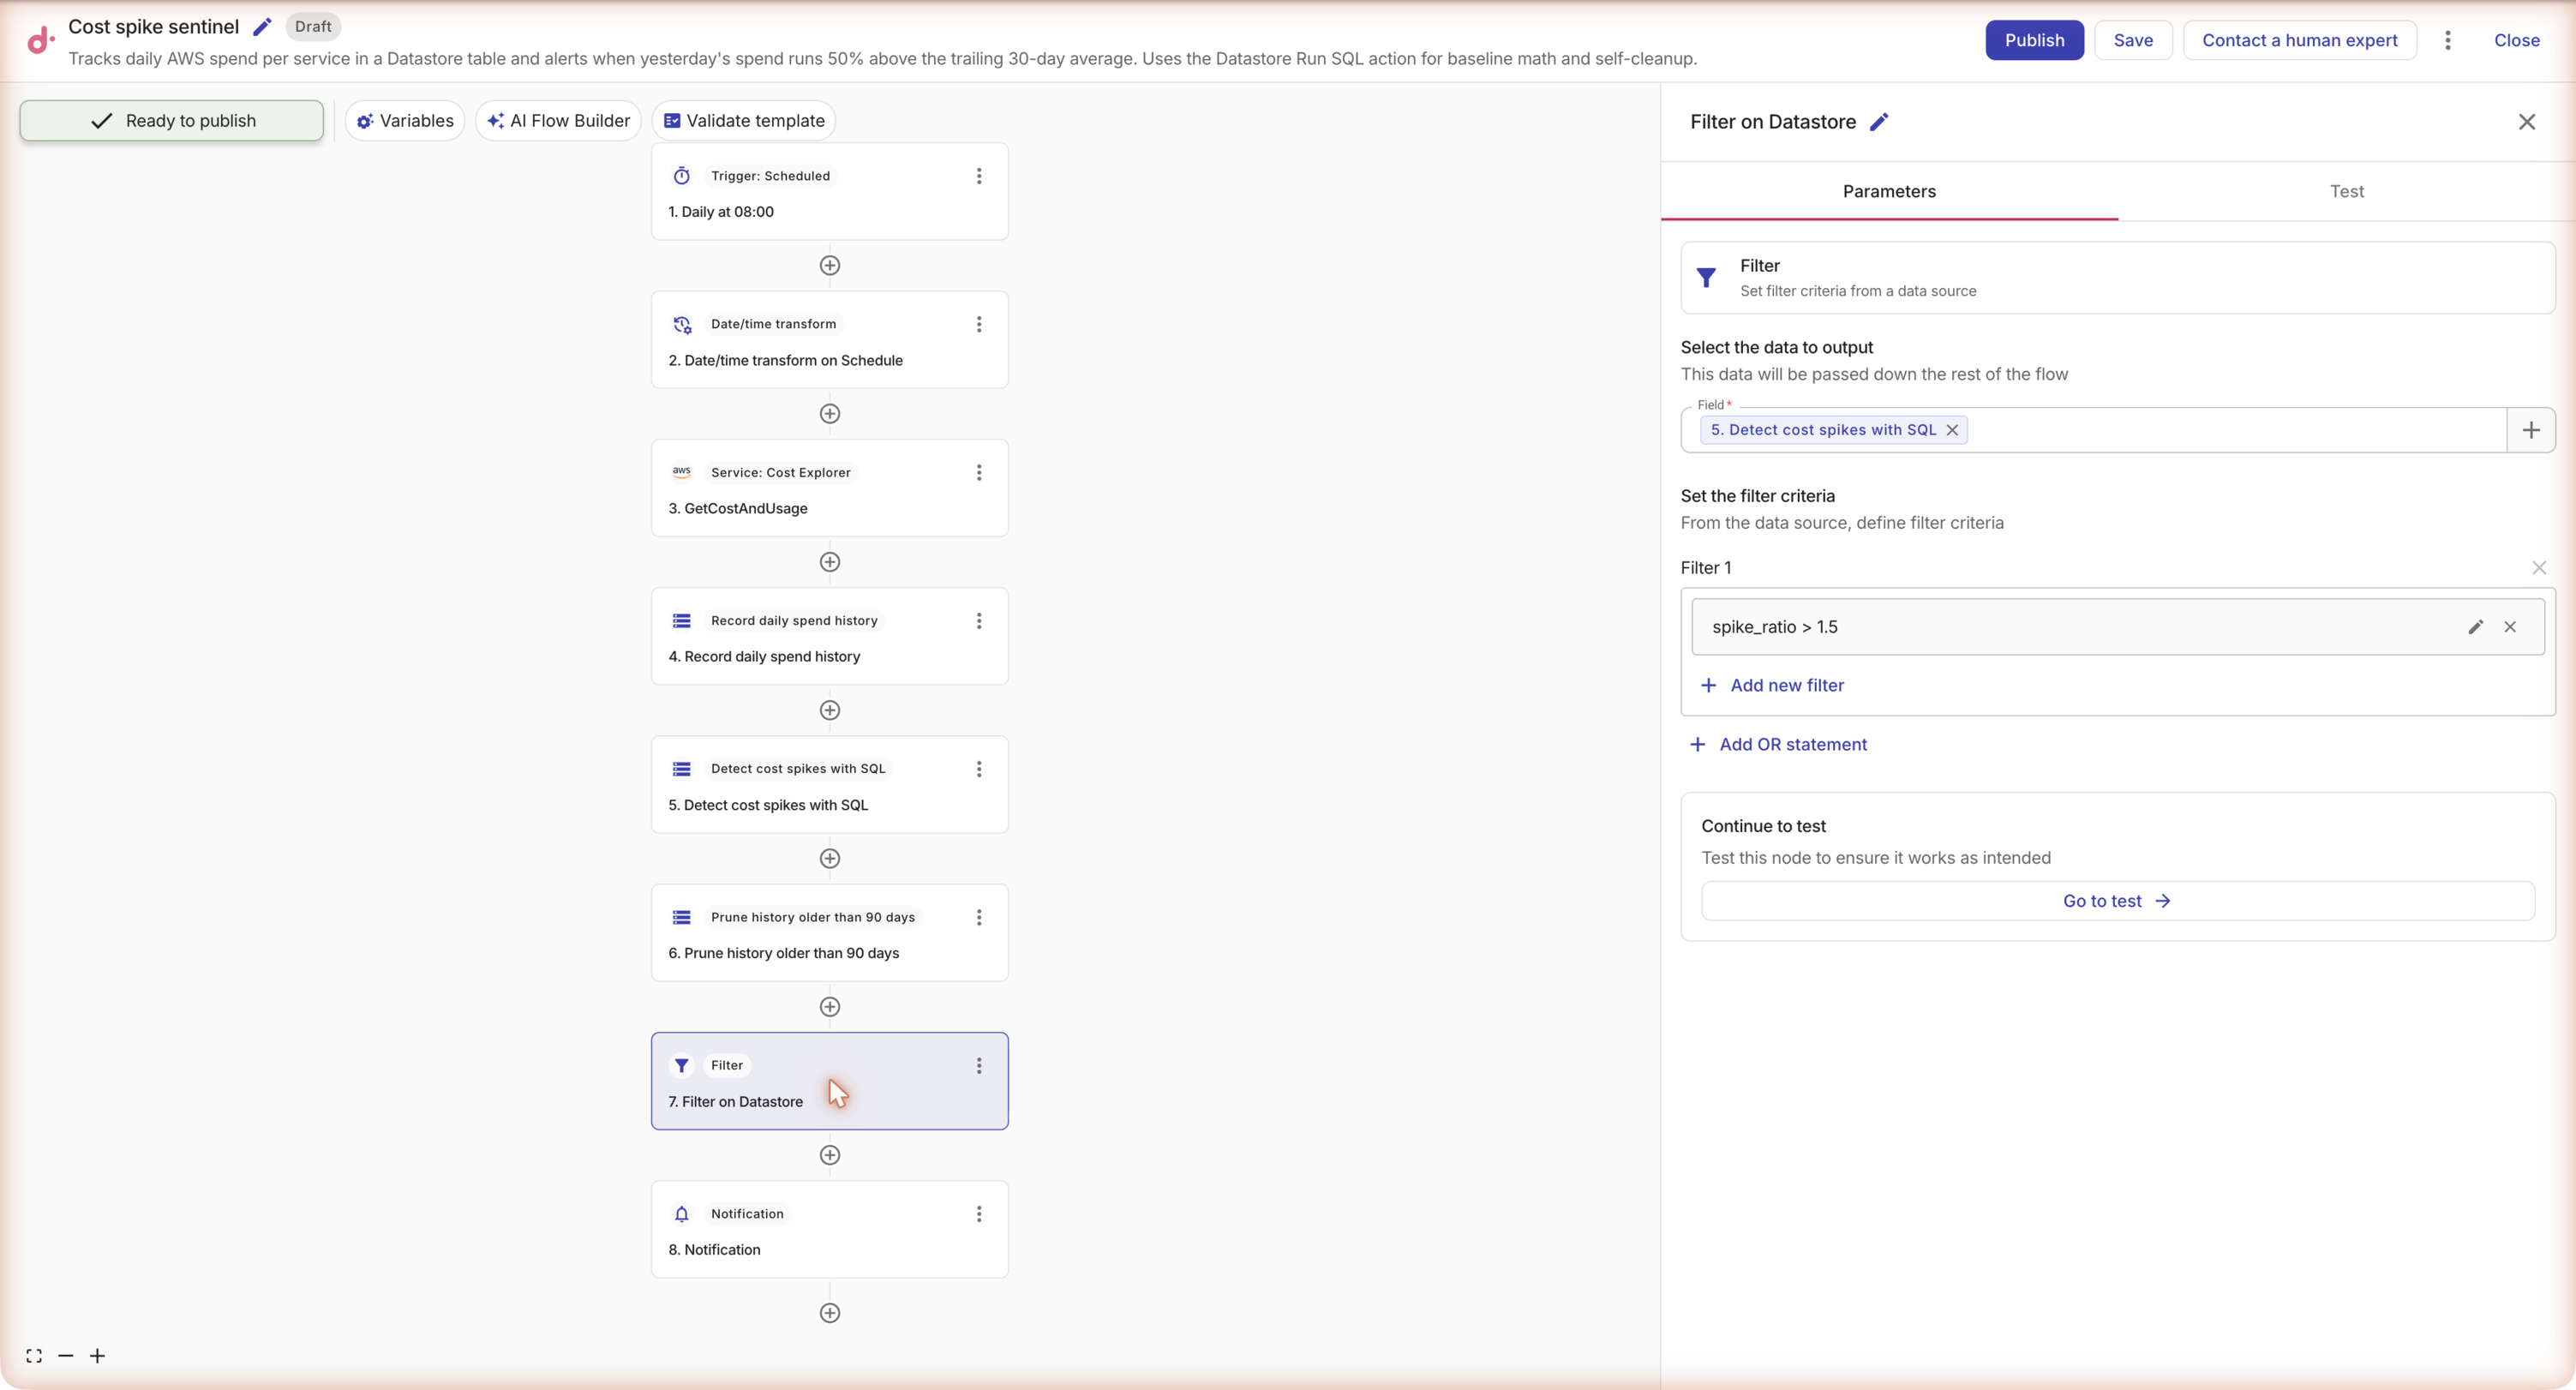
SQL ですでにこの閾値を適用していますが、この Filter が「報告すべきものがあるかどうか」をフローに伝える役割を果たします。
Send the alert
-
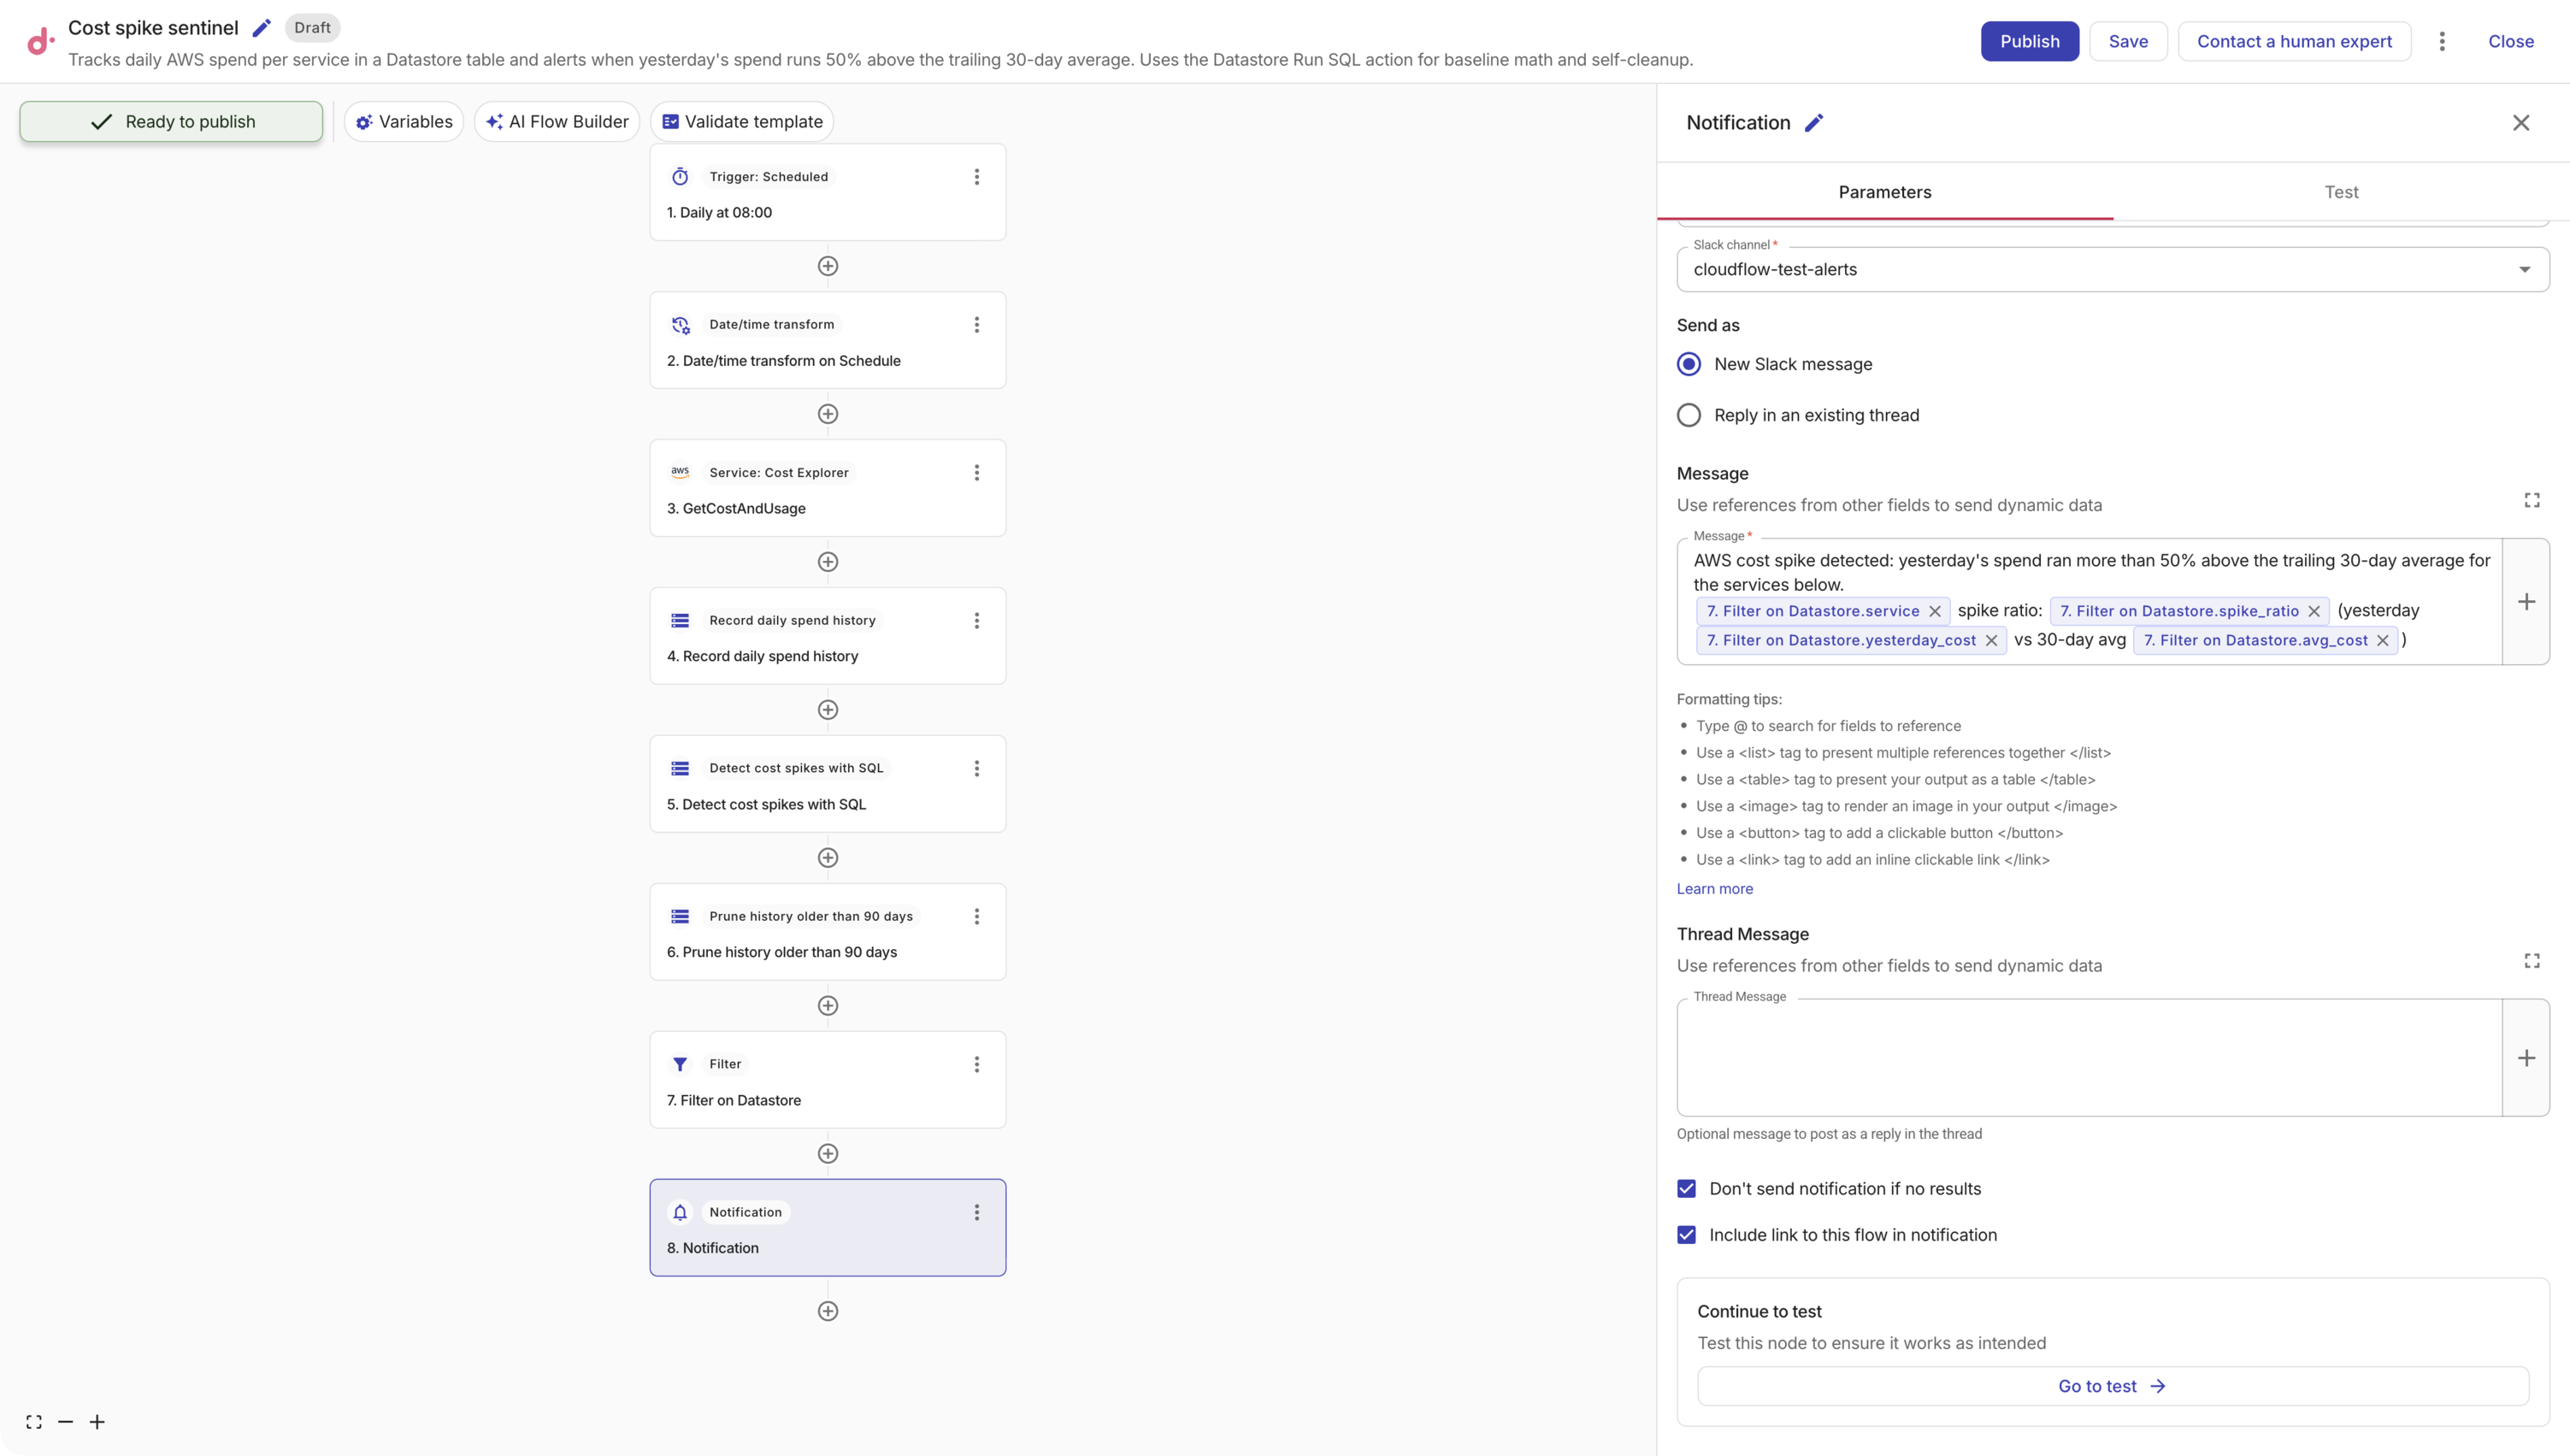
Notification ノードを追加し、プロバイダーとして Slack を選択してください。
-
アラートを受信するチャンネルを選択してください。
-
メッセージ本文を作成し、
@を入力して Filter のフィールドを参照してください。例えば次のようにします。AWS cost spike detected: yesterday's spend ran more than 50% above the trailing 30-day average for the services below.@service spike ratio: @spike_ratio (yesterday @yesterday_cost vs 30-day avg @avg_cost) -
Don't send notification if no results を選択してください。これを有効にしない場合、スパイクがなかった日でも空の値を含むメッセージが投稿されてしまいます。
Publish and verify
-
Publish を選択してください。
-
Run を選択してフローを手動でトリガーし、実行詳細を開いてすべてのステップが完了していることを確認してください。
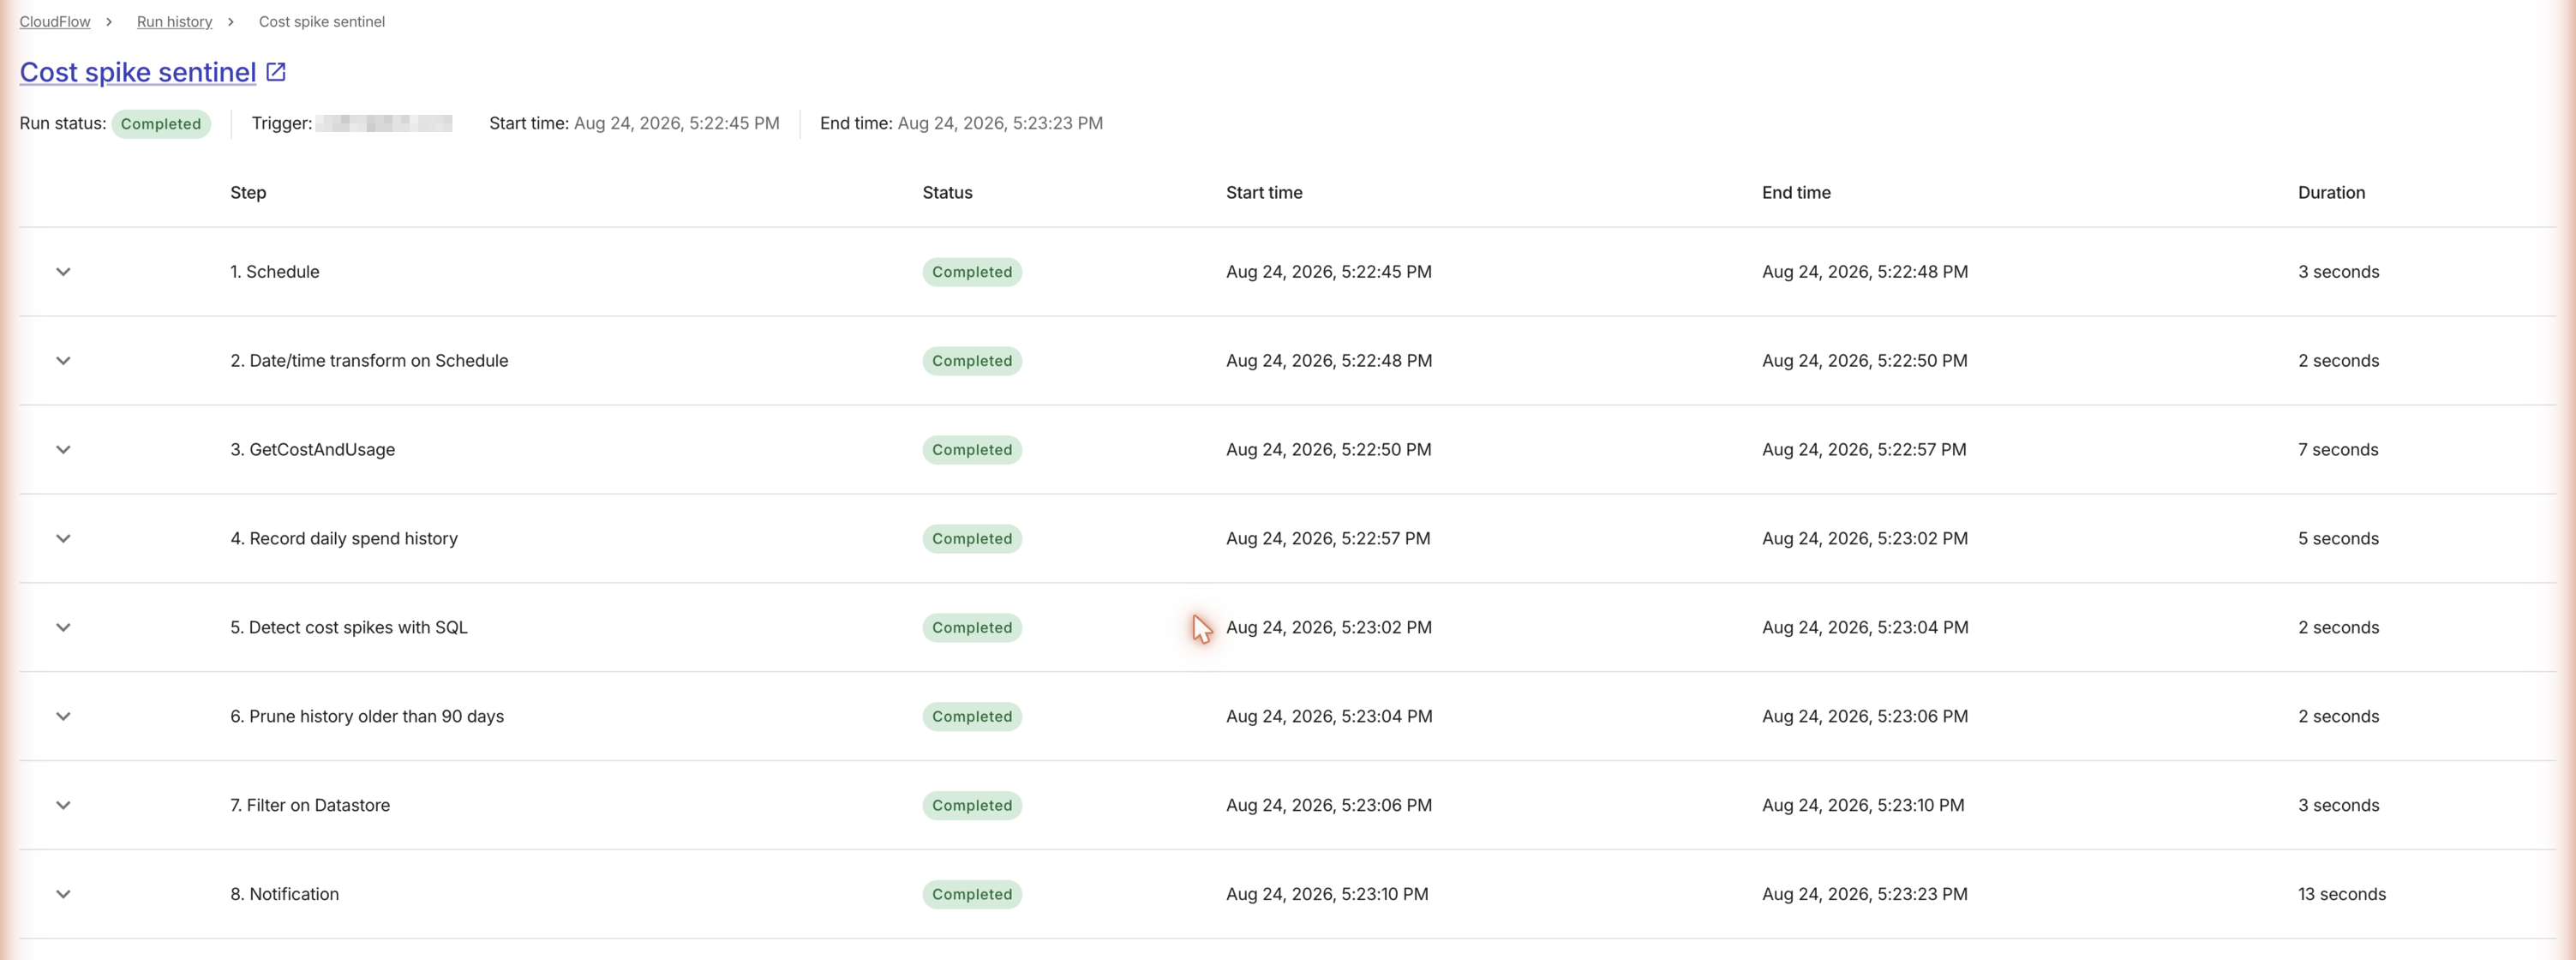
-
スパイク検出ステップを展開し、返された行を確認してください。最初の実行時点ではテーブルに 1 日分のデータしかないため、ベースラインは空であり、どのサービスもそれを上回ることはできません。これは想定どおりです。
-
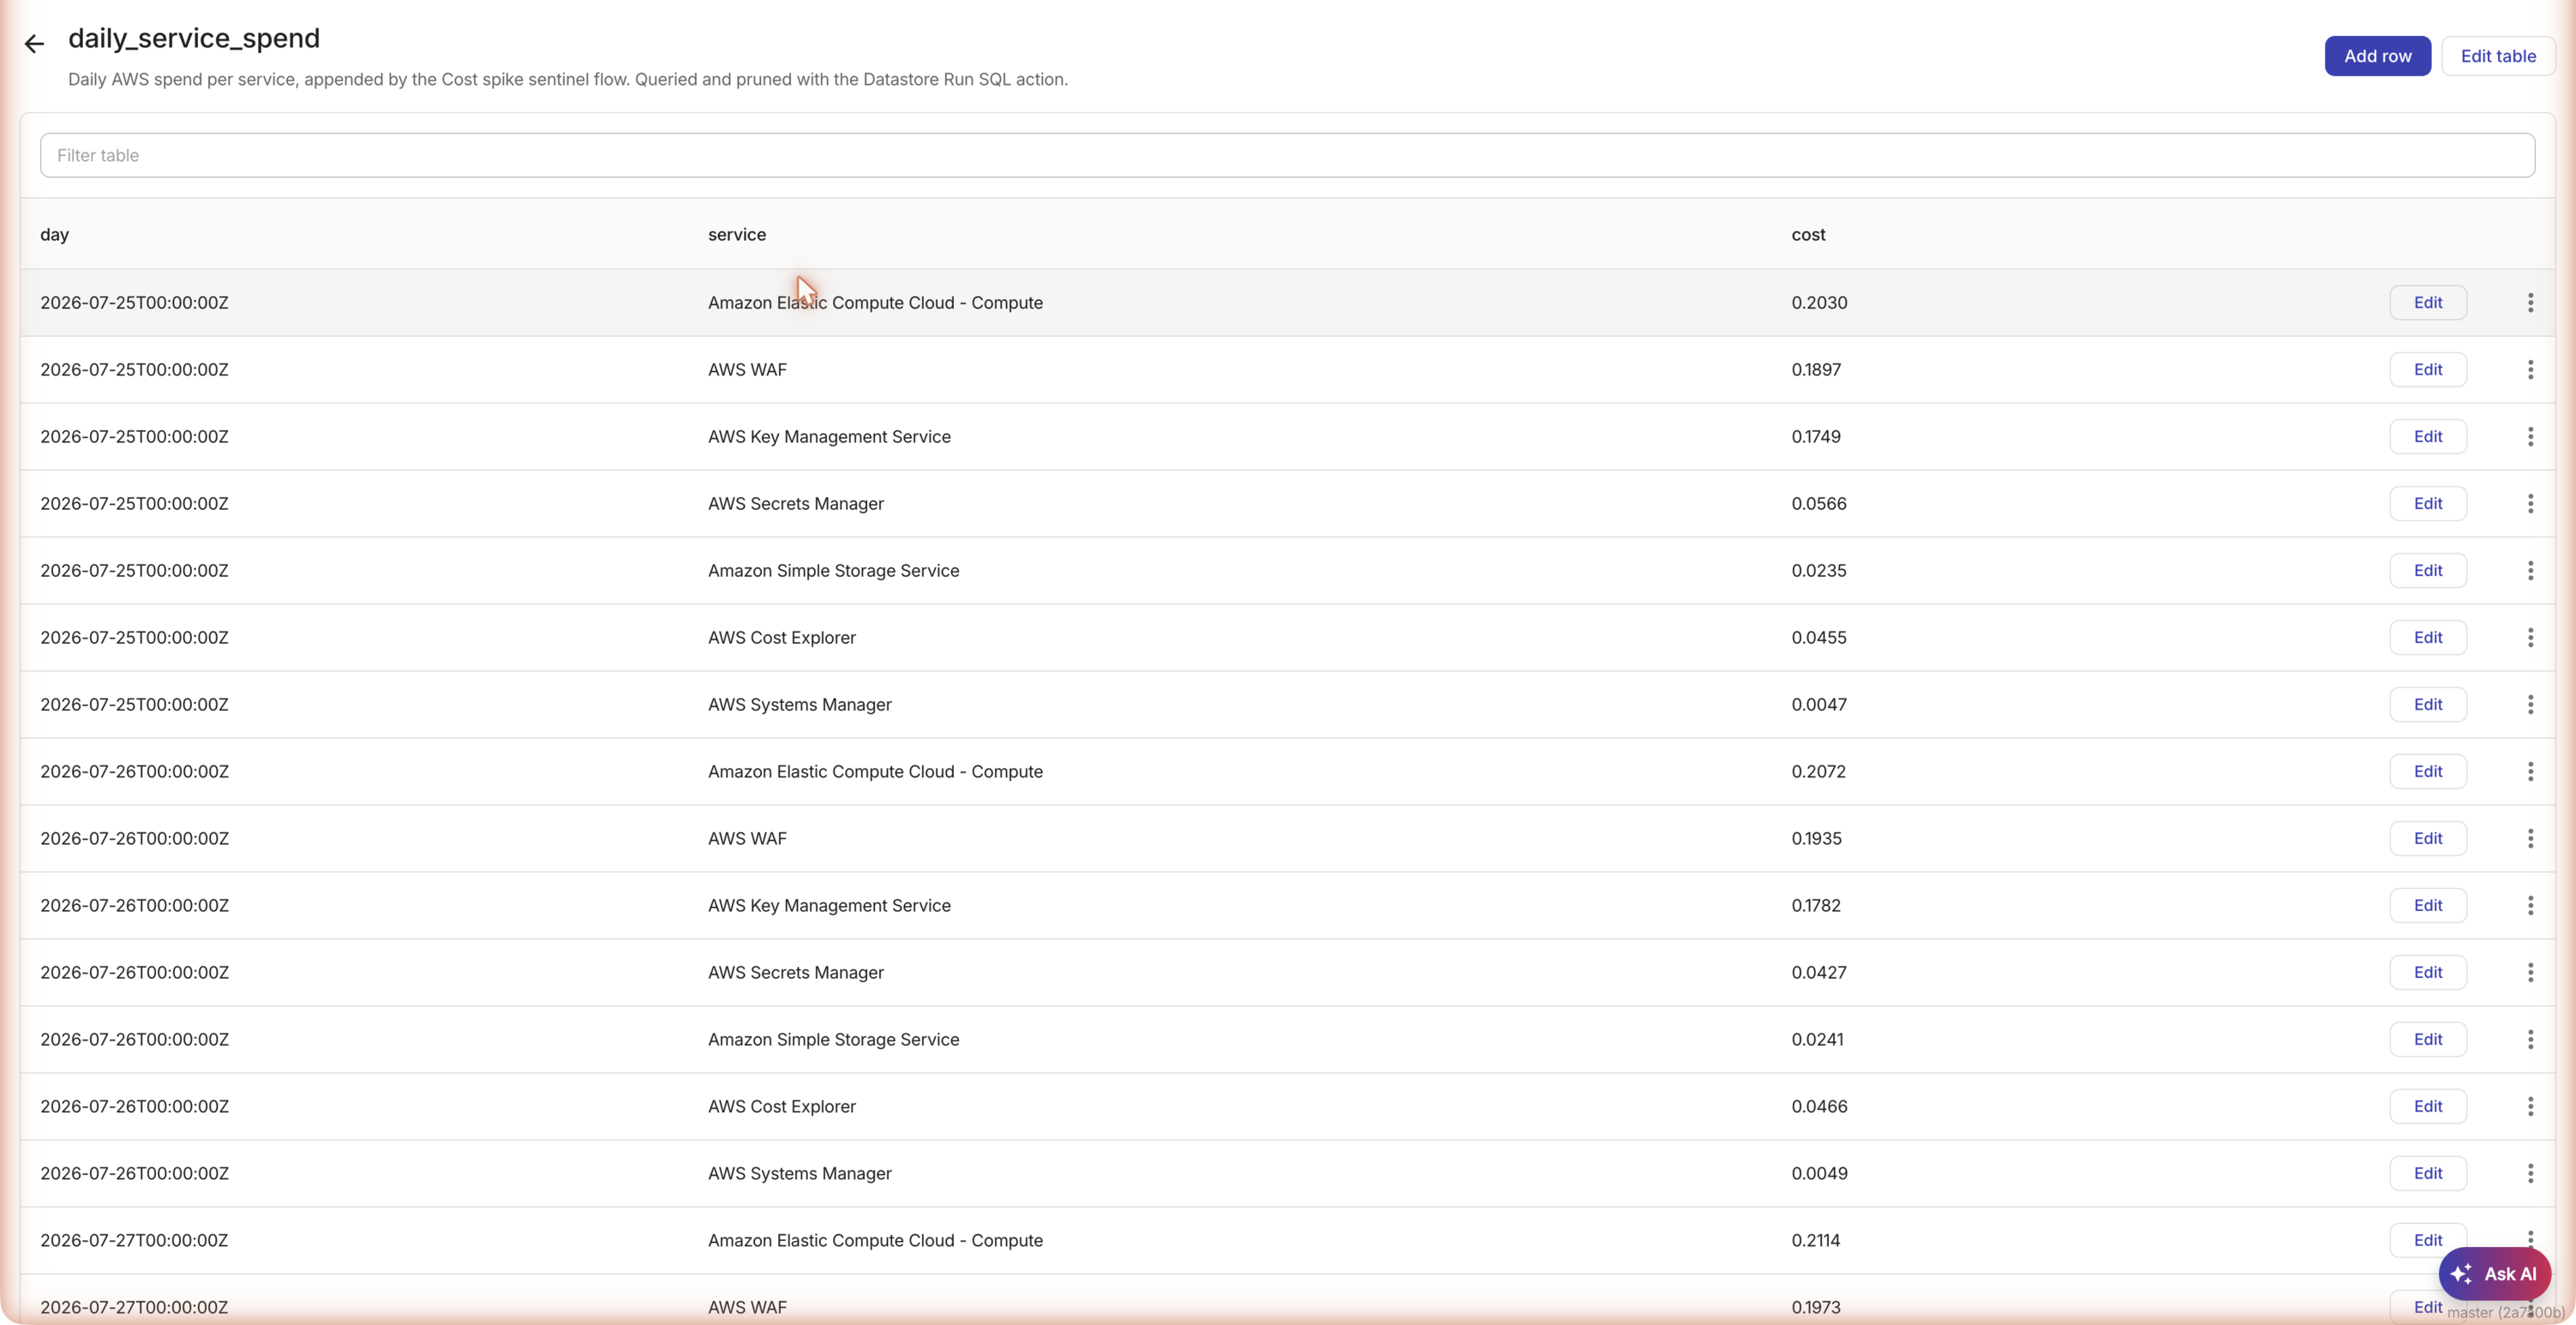
Tables タブからテーブルを開き、前日の行が書き込まれていることを確認してください。
数日経つとベースラインに意味が出てきて、このフローは実際の外れ値に対してアラートを出し始めます。スパイクが閾値を超えると、Slack メッセージにはサービス名、スパイク比、その裏にある 2 つの金額が表示されます。
AWS cost spike detected: yesterday's spend ran more than 50% above the trailing
30-day average for the services below.
Amazon Elastic Compute Cloud - Compute, AWS WAF spike ratio: 1.87, 1.8
(yesterday 0.37, 0.32 vs 30-day avg 0.2, 0.18)
パターンを調整する
このフローの形は、時間の経過とともに監視したいあらゆる対象に一般化できます。スケジュールに従って測定値を記録し、SQL で集計し、外れ値にアラートを出し、履歴を削除していきます。次のようなバリエーションも試す価値があります。
-
サービスではなくアカウントを監視するために、Cost Explorer を
SERVICEではなくLINKED_ACCOUNTでグループ化します。 -
ベースラインに
HAVING COUNT(*) >= 7句を追加し、アラートをトリガーできるようになる前に、サービスに 1 週間分の履歴が必要となるようにします。 -
乗数を
1.5からより厳しい値に変更するか、平均ではなくMAX(cost)と比較するようにします。 -
サービスごとの閾値を保持する第 2 のテーブルを用意してそれに結合し、ノイズの多いサービスには独自の乗数を適用できるようにします。