Customize report display
Cloud Analytics supports report display customization, such as color themes, font sizes, and number formatting.
Display settings
Display settings let you control how a Cloud Analytics report looks without changing the underlying data. You can apply a color theme, adjust font sizes for chart labels, and choose how numbers are formatted.
Display settings are stored per user. Your preferences do not affect other users.
Required permission
- Cloud Analytics Read Only, Cloud Analytics User, or Cloud Analytics Admin
Change report display settings
To change the display settings for a chart report:
-
Sign in to the DoiT console, select Reporting and analytics > Reports from the top navigation mega menu.
-
Open an existing report or create a new one.
-
On the chart, select the Display Settings icon (
). -
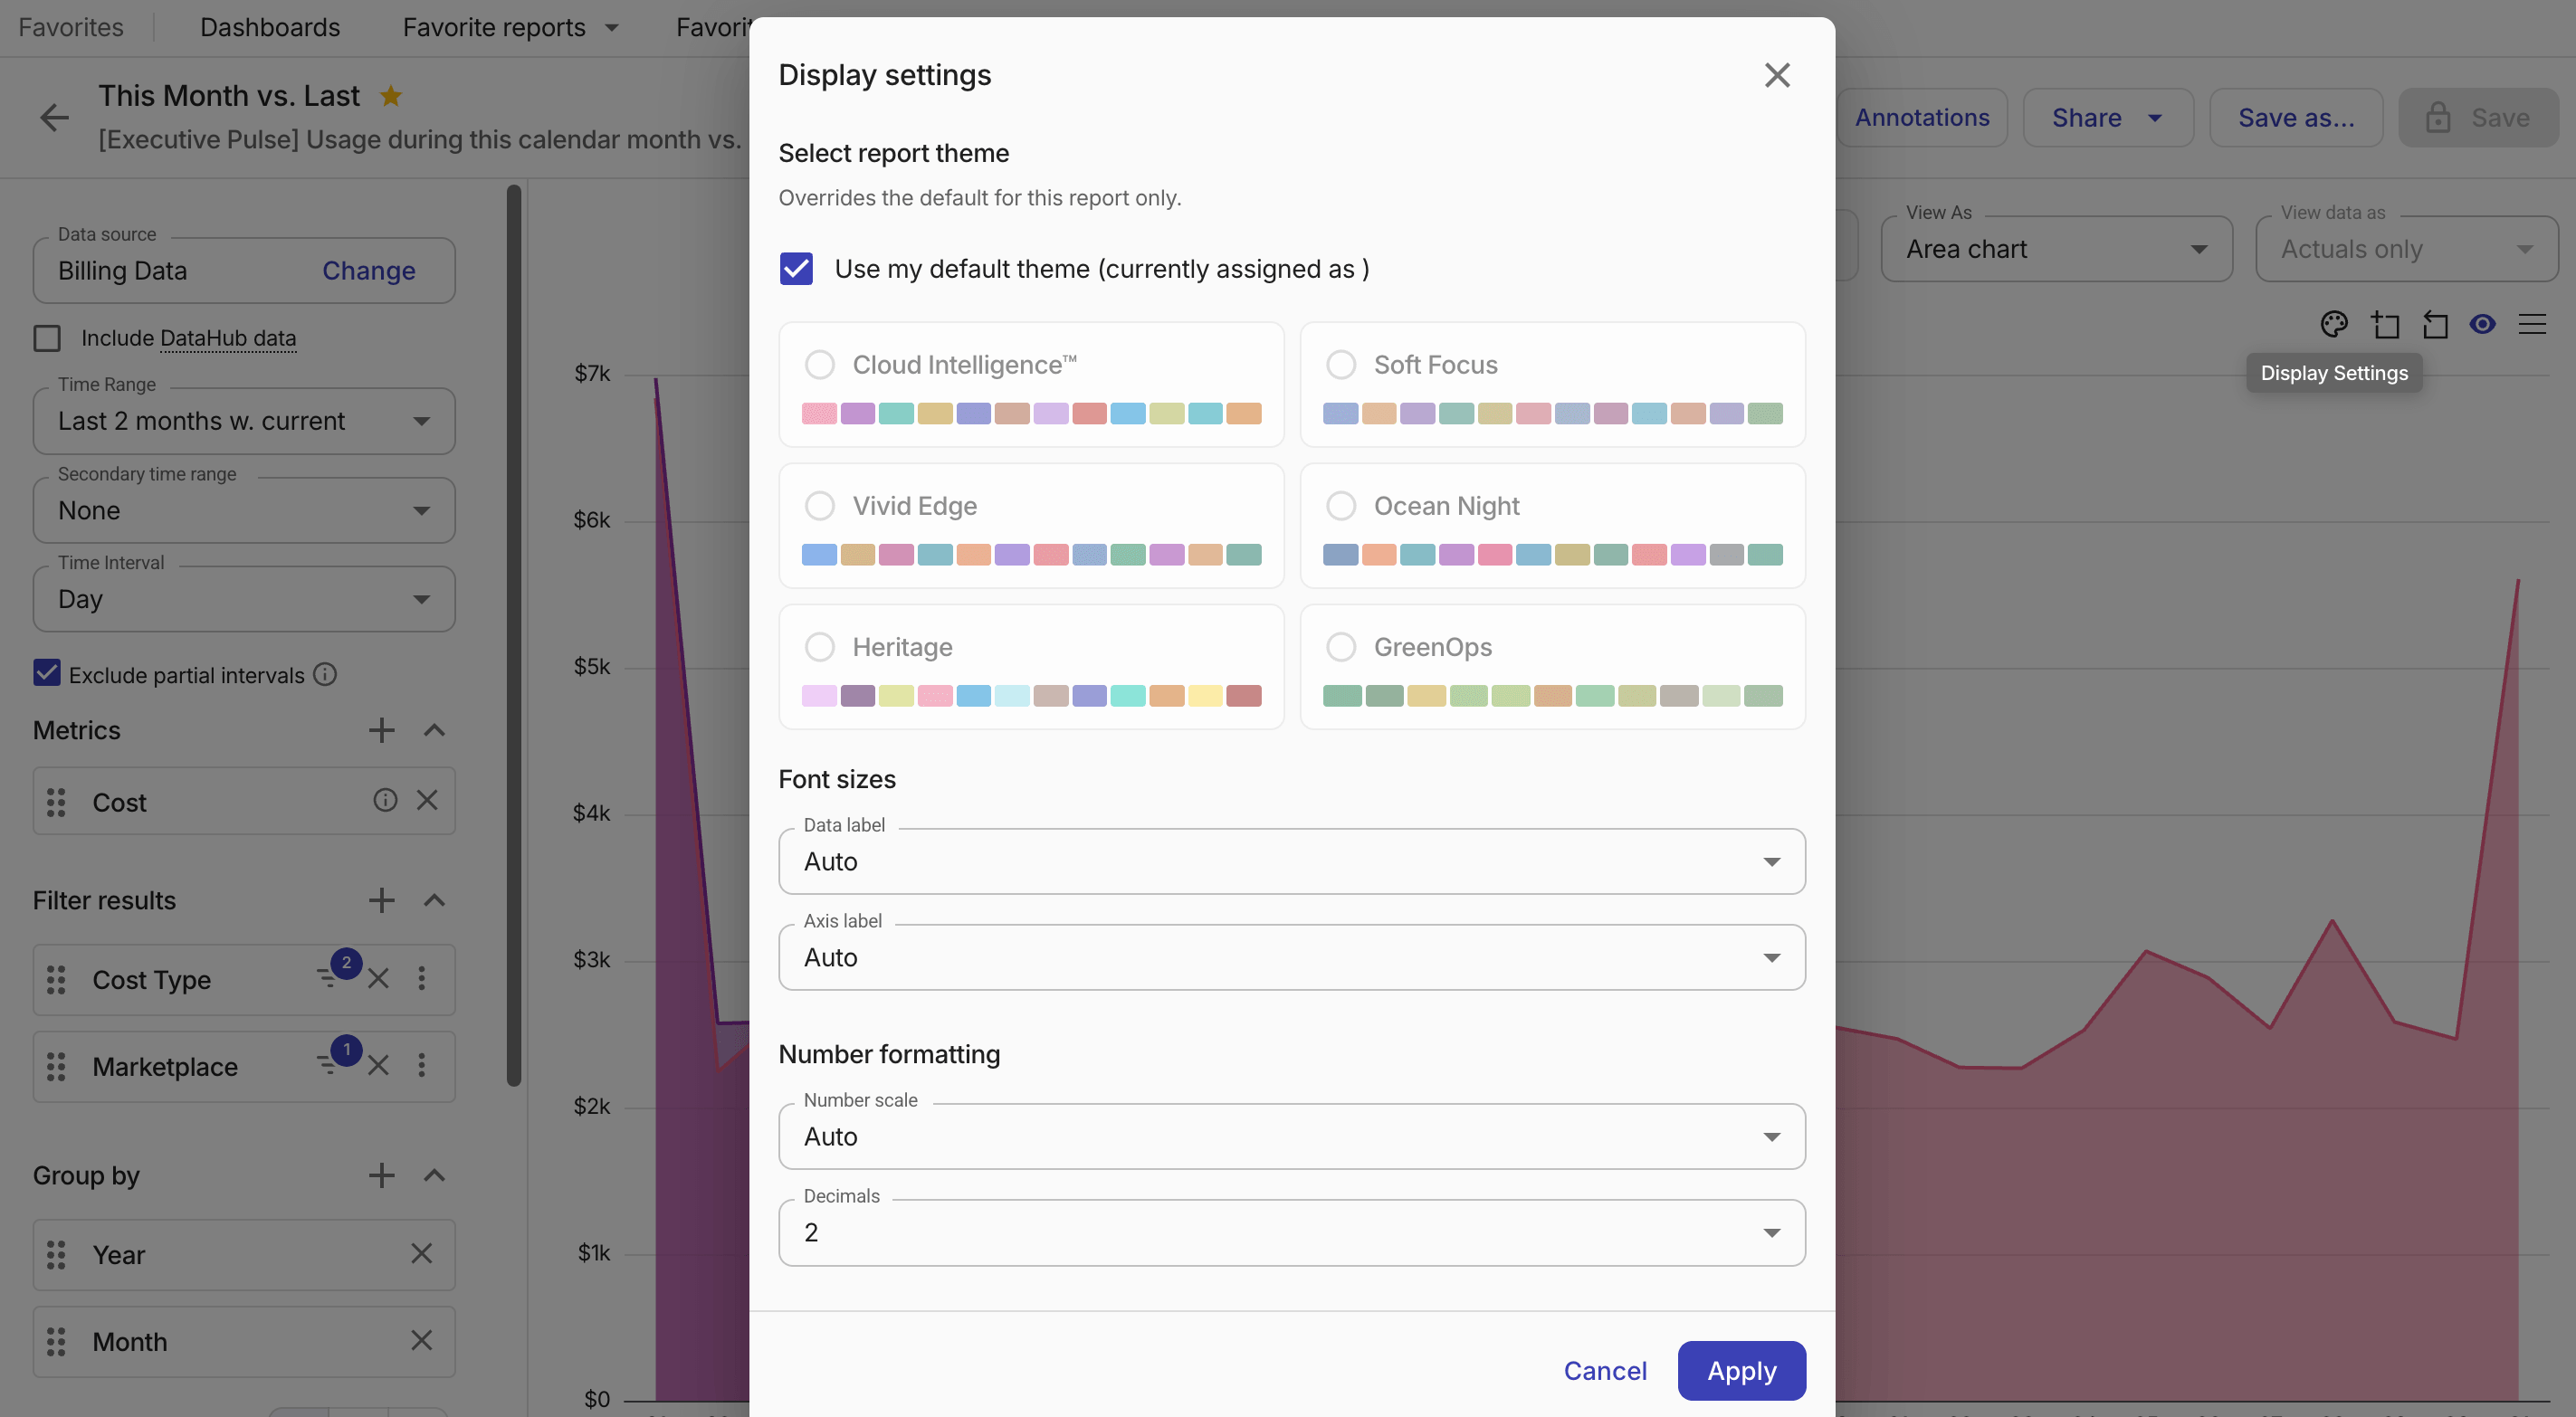
View and adjust color themes, font sizes, and number formatting.
-
Select report theme: The color theme for chart series (bars, lines, areas, and other visual elements). You can choose a preset or a custom theme. Per-report theme selections override your default theme for that report only.
-
Preset themes: Each preset provides separate palettes for light and dark mode, applied automatically based on your console theme.
- Cloud Intelligence™: The default color palette, designed for accessibility across color-vision types.
- Heritage (Accessible): The previous default palette, with a few colors adjusted to be easier to tell apart across color-vision types.
- Soft Focus: Muted, low-contrast tones.
- Vivid Edge: High-saturation, bold colors.
- Ocean Night: Deep blues and warm accent colors.
-
Custom themes: These are color themes created by you or other users in your organization. See Create a custom theme.
-
-
Font sizes: The font size of data labels and axis labels.
Auto(default): The console determines the font size based on chart complexity and viewport.Small,Medium,Large: Fixed font sizes.
-
Number formatting: How metric values appear in tables and chart labels.
-
Number scale: How large numbers are abbreviated:
Auto (default): Automatically selects the best scale for your data.Thousands (K): Abbreviates large numbers into thousands (e.g., 45.2K).Millions (M): Abbreviates large numbers into millions.Billions (B): Abbreviates large numbers into billions.Raw: Displays the full number with no abbreviation.
-
Decimals: The number of decimal places shown for metric values. Allowed values:
0to8. The default is2.
-
-
-
Select Save to apply the new settings.
Report theme settings
Report theme settings let you set a default color theme that applies to all new reports and dashboard widgets. You can also manage custom themes from the avatar menu.
Required permission
- Cloud Analytics Admin
Set your default theme
To set your default theme for new reports and dashboard widgets:
-
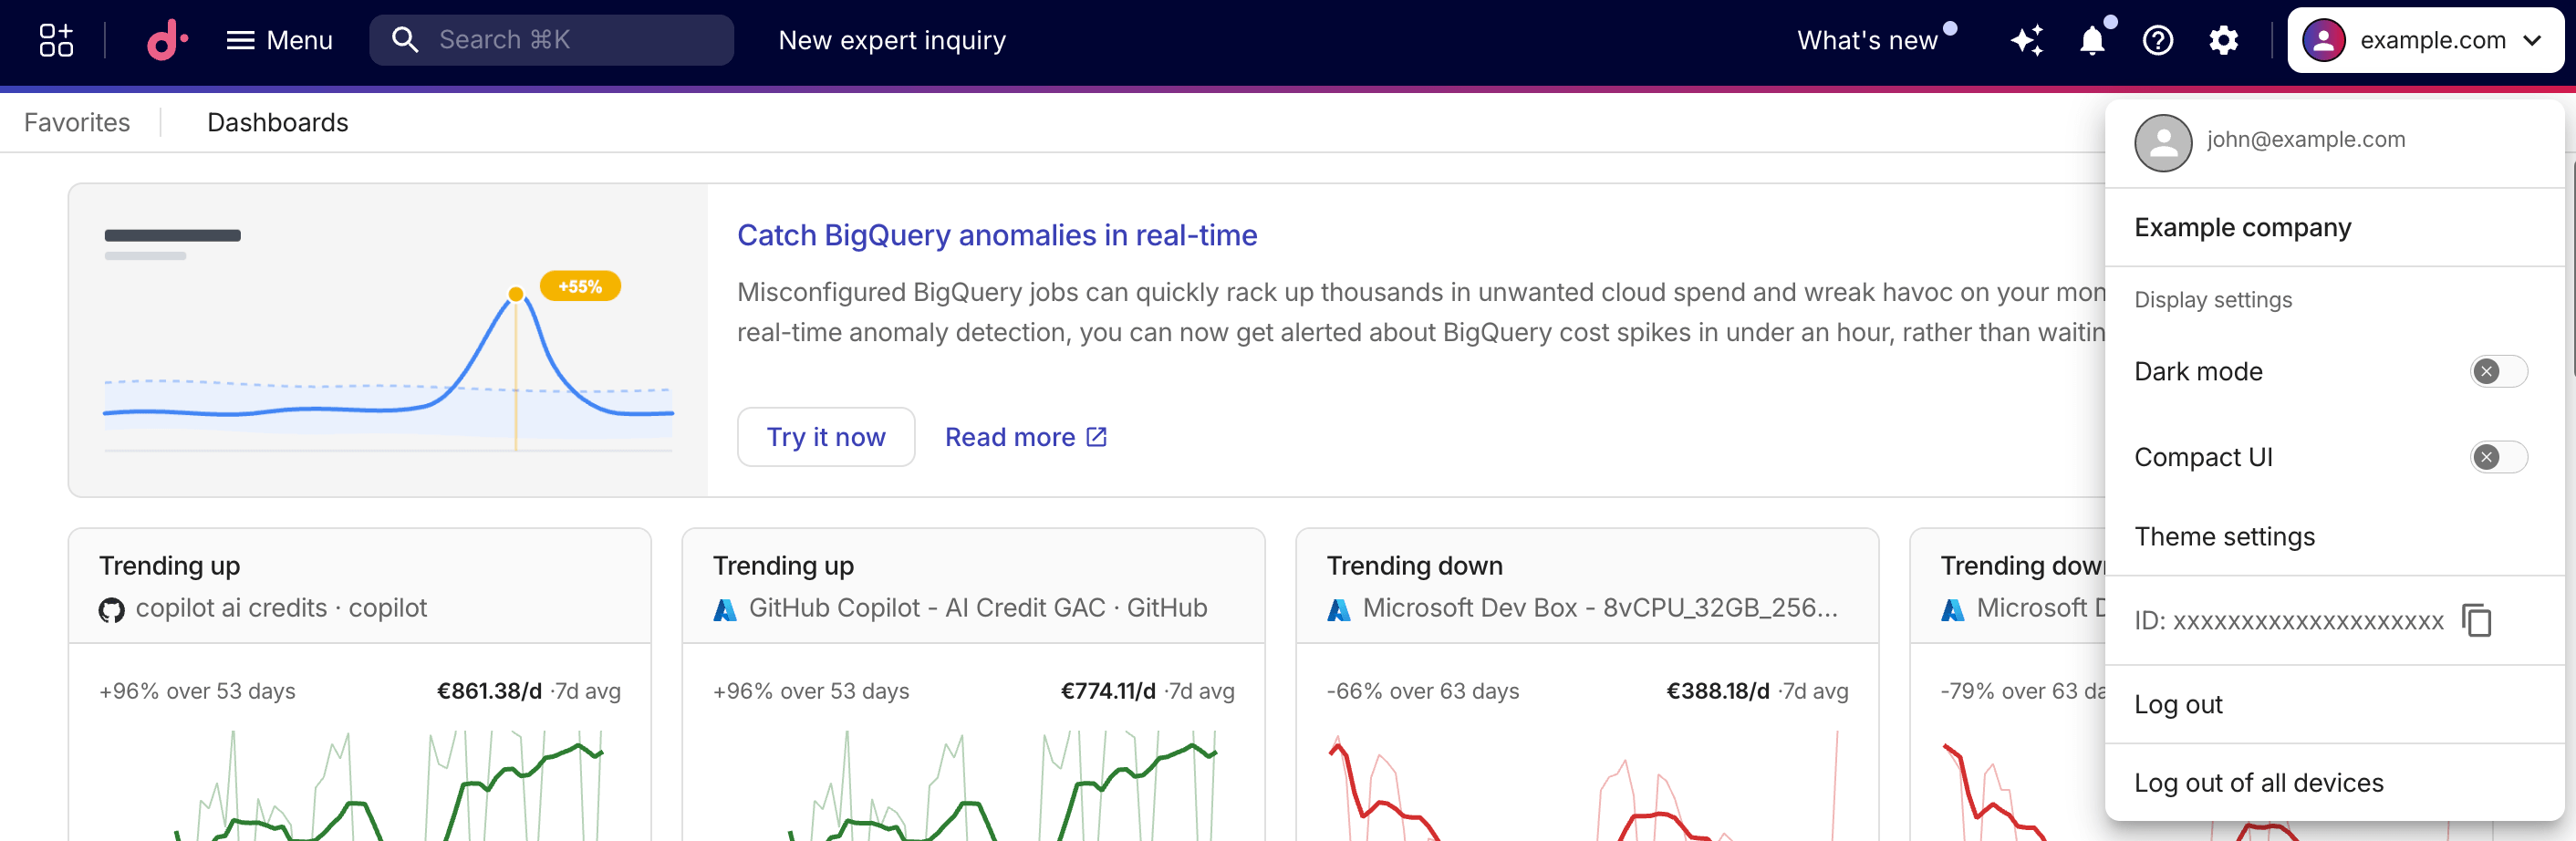
Select your avatar in the top-right corner of the console to open the avatar menu. Under Display settings, select Theme settings.
-
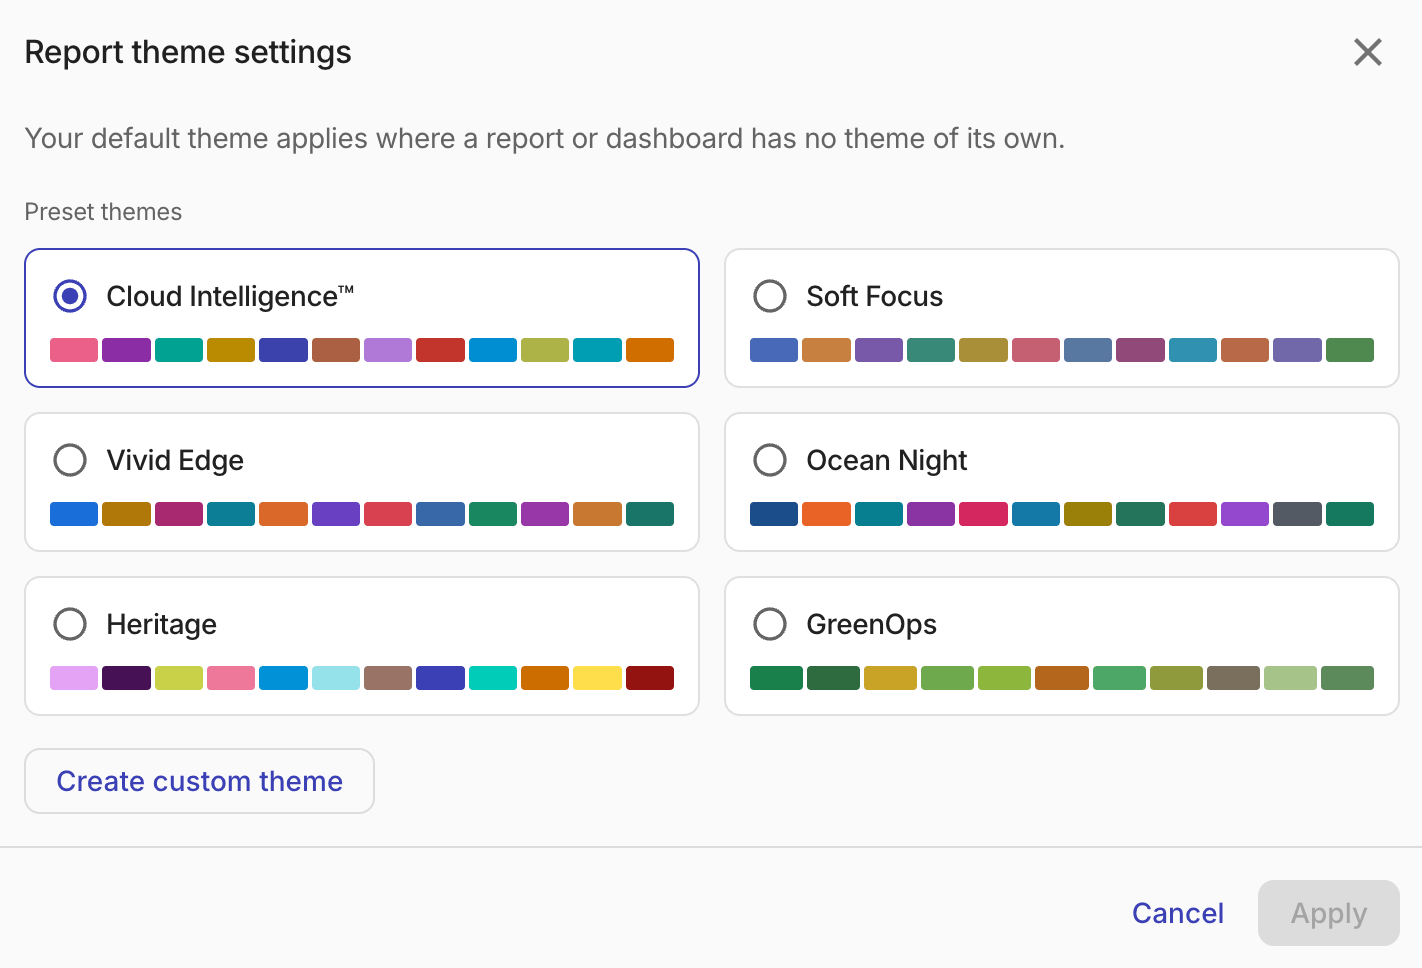
Choose a theme.
A live preview applies the selected palette to all visible charts so you can evaluate it before confirming. Report-level theme overrides are preserved during the preview.
-
Select Apply to save the new default, or Cancel to revert to the previous theme.
The default theme is stored per user. Your setting will not affect other users.
Create a custom theme
Custom themes are stored at the organization level and visible to other users in your organization.
To create a custom theme:
-
Select your avatar in the top-right corner of the console to open the avatar menu. Under Display settings, select Theme settings.
-
Select Create custom theme.
-
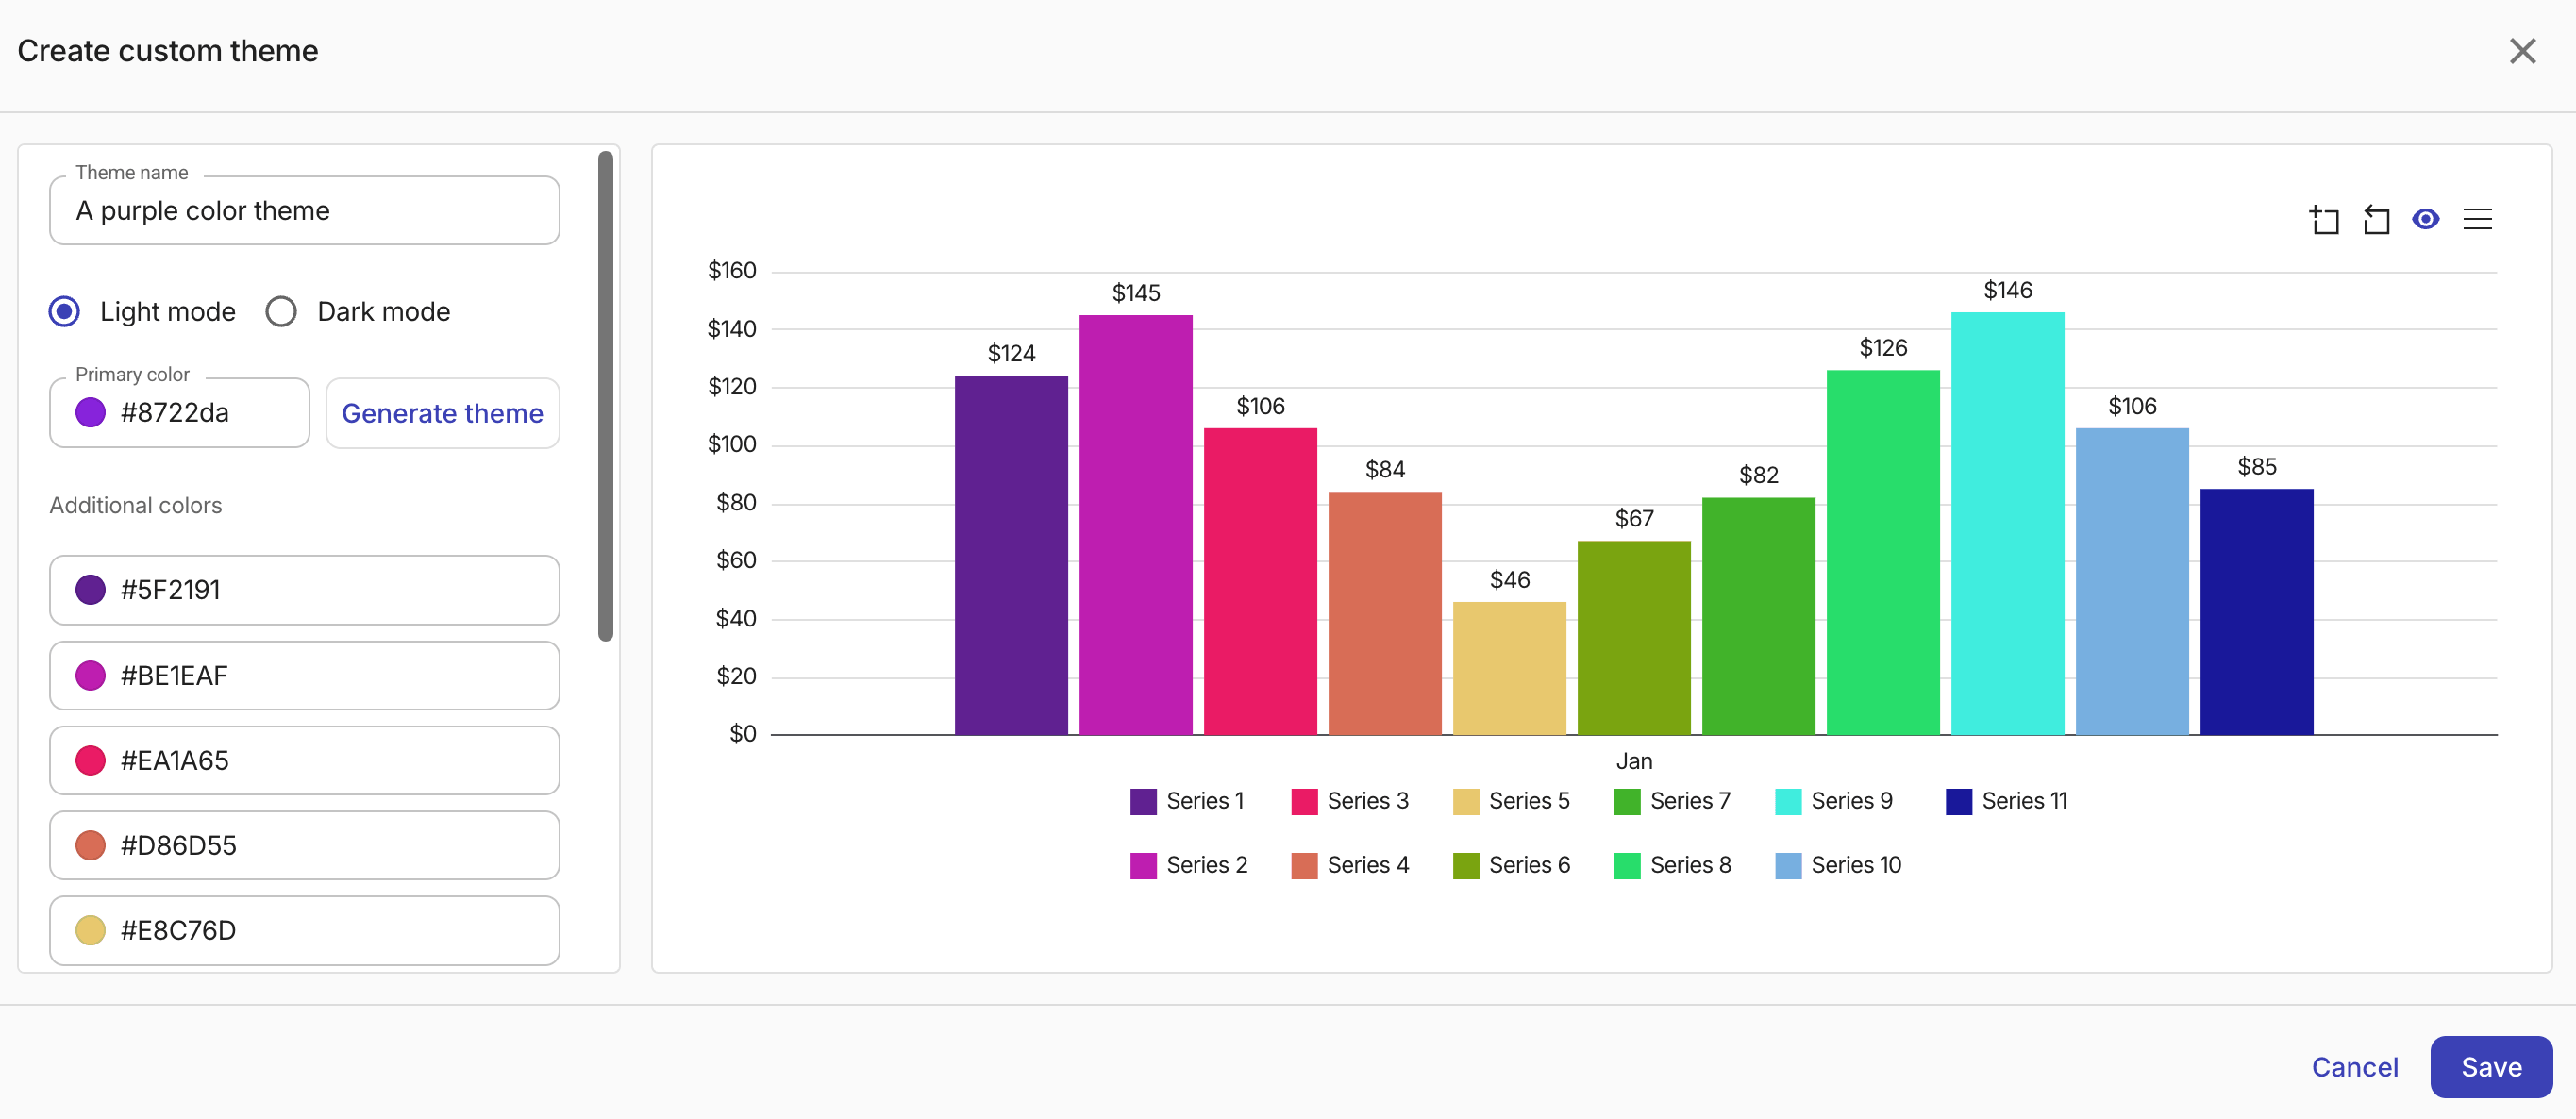
Configure the theme.
-
Enter a name for the theme.
-
Choose a primary color. You can enter a hex value directly or use the color picker.
-
Select Generate theme to create a pair of palettes based on the primary color, for light and dark mode.
-
Check the palettes using the live chart preview and manually adjust each color swatch if necessary.
-
Select Save to create the theme.
-
Edit or delete a custom theme
To edit or delete a custom theme, open Theme settings from the avatar menu, and then select the corresponding icons on the theme card.