Annotations
Adding annotations to Cloud Analytics reports allows you to capture context behind the numbers, for example, infrastructure changes, events, or anomalies, helping teams better understand trends and make informed decisions.
In the console, you can add, edit, or remove annotations either on a dedicated Annotations page or on individual report pages. You can also create annotations directly from other areas of the platform, such as cost anomaly details.
Required permissions
-
To create an annotation, you must have the Cloud Analytics Admin permission.
-
To edit an annotation, you must be its owner or have the Editor permission.
-
To delete or change permissions of an annotation, you must be its owner or have the Cloud Analytics Admin permission.
View annotations
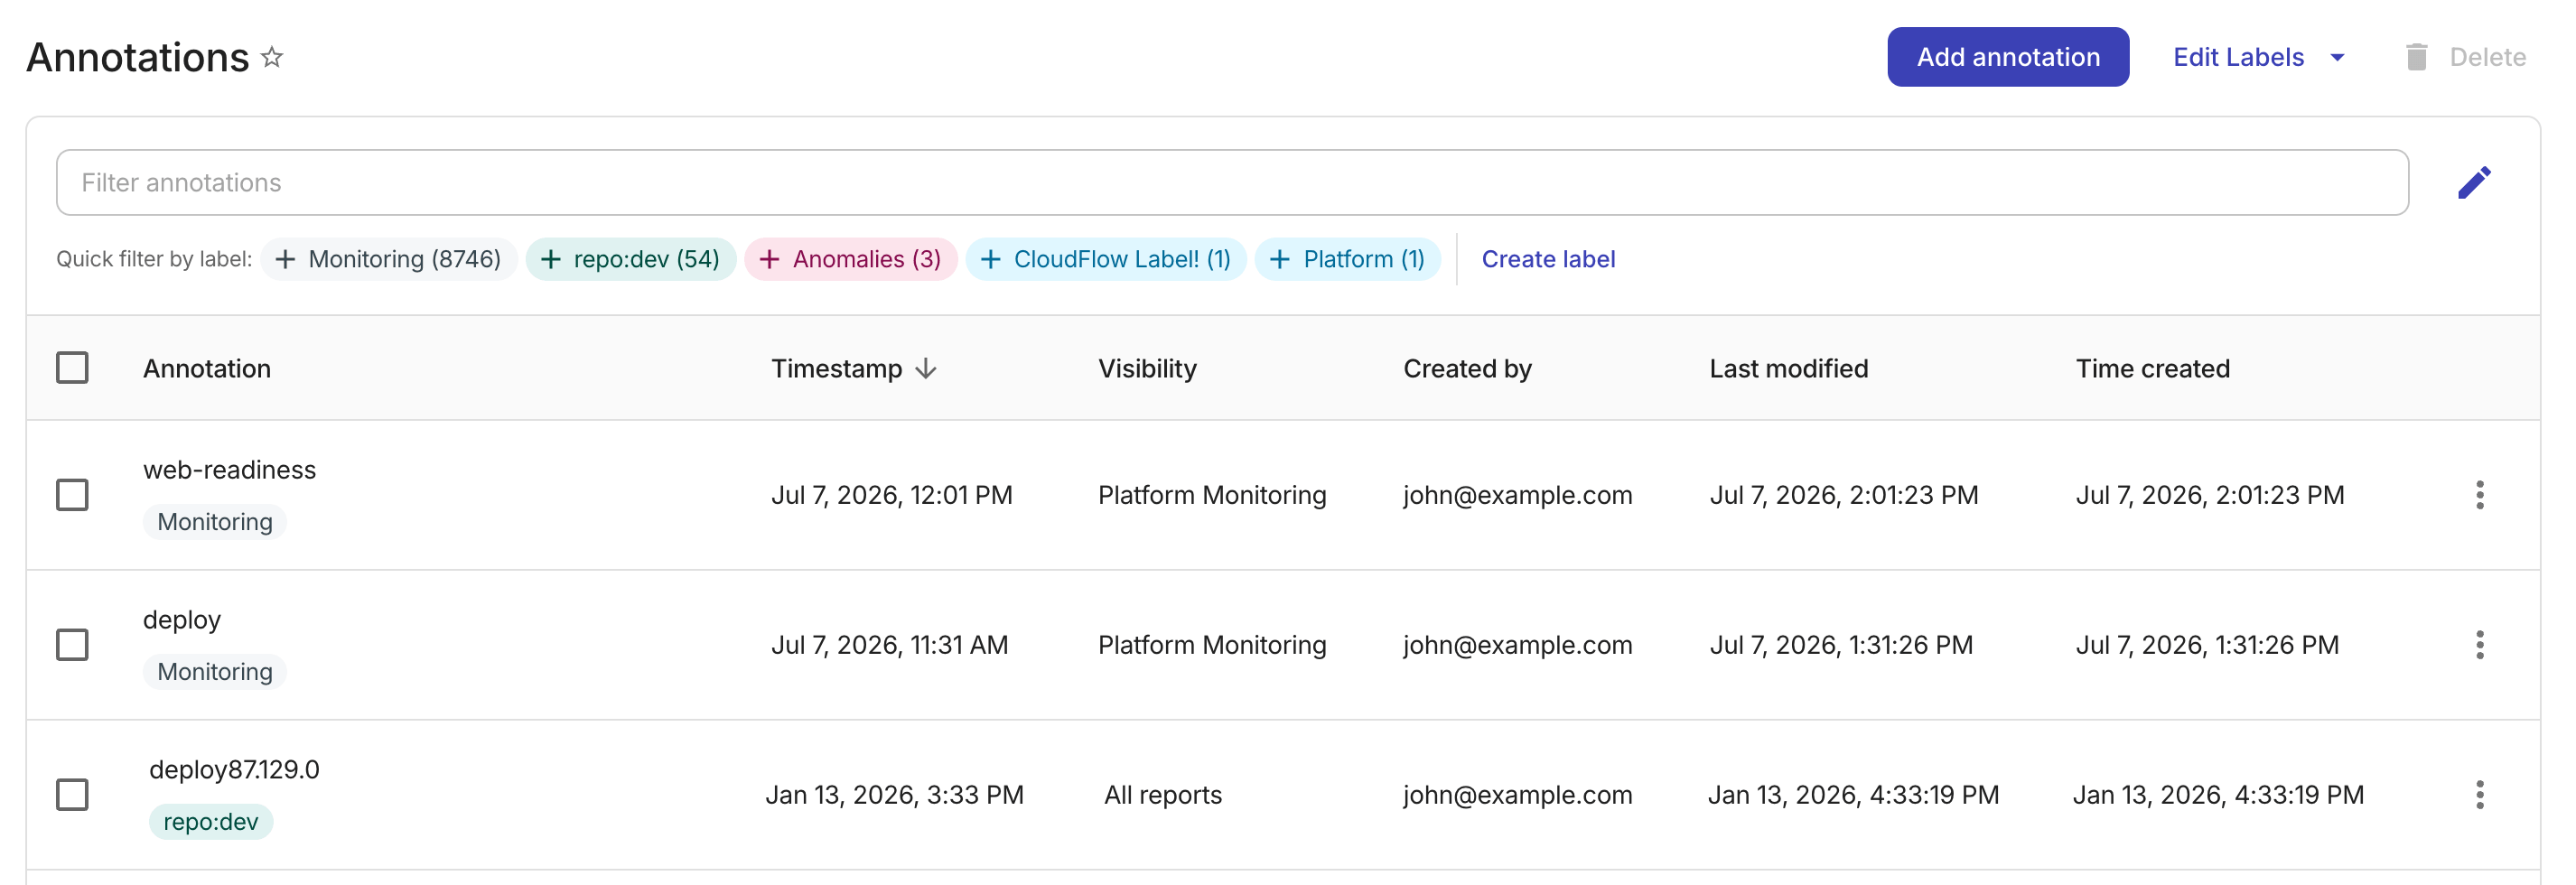
To view the existing annotations, in the DoiT console, select Reporting and analytics > Annotations from the top navigation mega menu, or select the Annotations button on the Reports page.
All the annotations are listed on the Annotations page.
Annotations side panel
The annotations side panel is available when viewing a report as a chart, a table, or a heatmap. It's not available for treemap, sankey, or trend board views.
Select the Annotations button in the report title bar to open or close the panel.
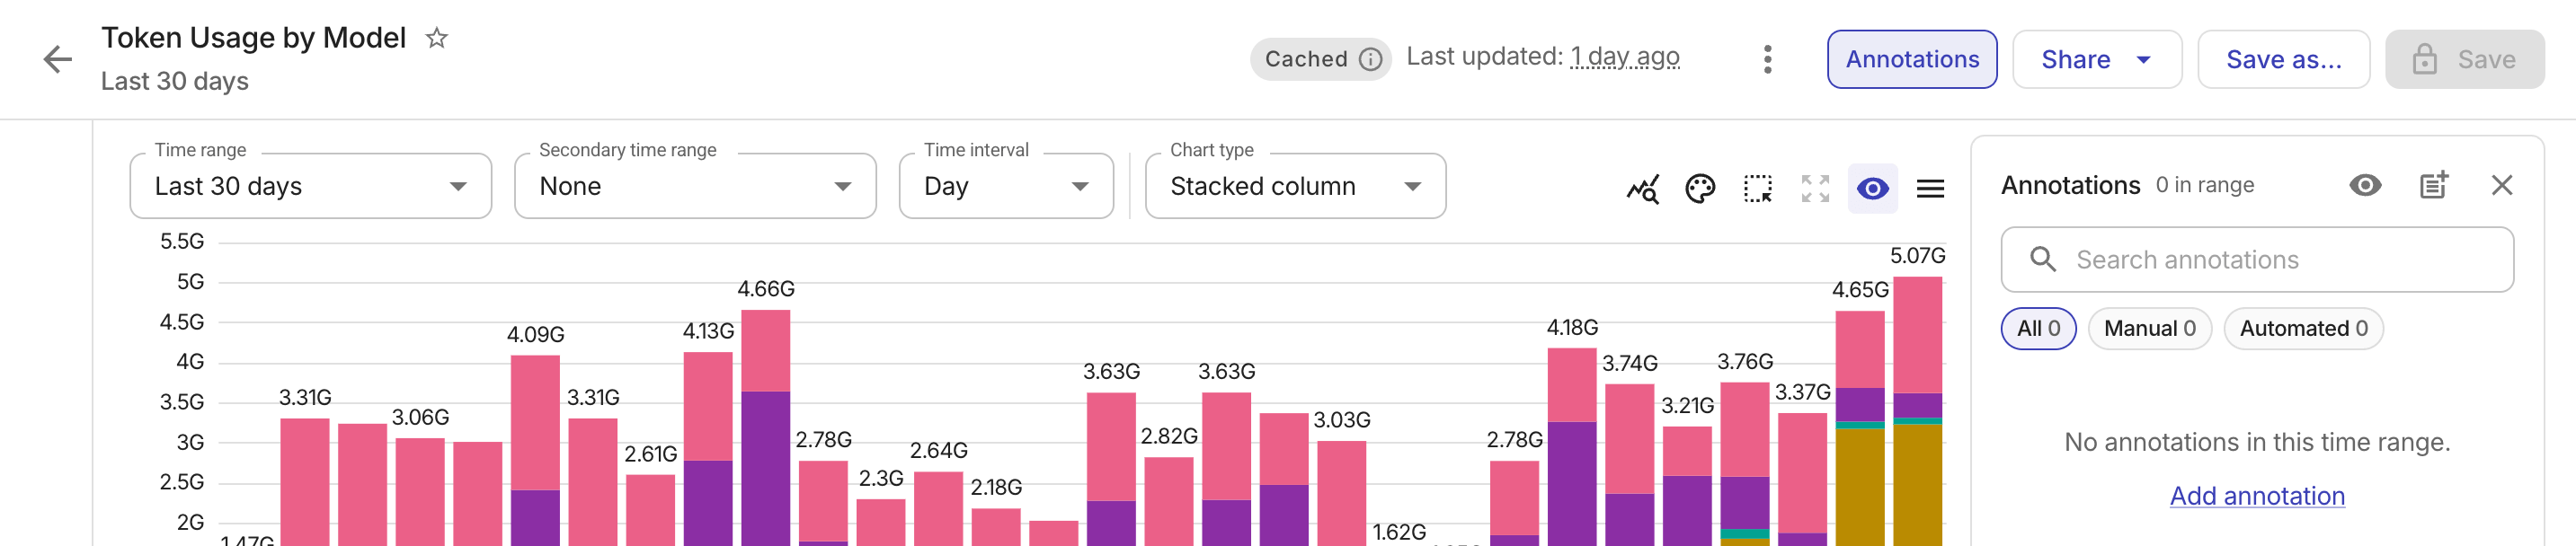
The panel header shows the total number of annotations in the current date range.
You can search for annotations by content, owner, date, or label name, or use the filter chips to narrow the list:
-
All: Show all annotations in the date range.
-
Manual: Show only annotations created in the DoiT console.
-
Automated: Show only annotations created through the Annotations API.
Annotations in the panel are grouped by time bucket (such as month, day, or hour, depending on the report's time interval) and sorted with the most recent group first.
Select an annotation row in the panel to open a detail card showing the full annotation content. From the detail card, you can edit or delete the annotation if you have the required permissions.
Add an annotation
You can start adding an annotation from various places:
-
On the Annotations page, select Add annotation in the upper-right corner.
-
On a report page:
-
Select Annotations in the title bar to open the annotations side panel and add annotations using the header icon or empty-state link.
-
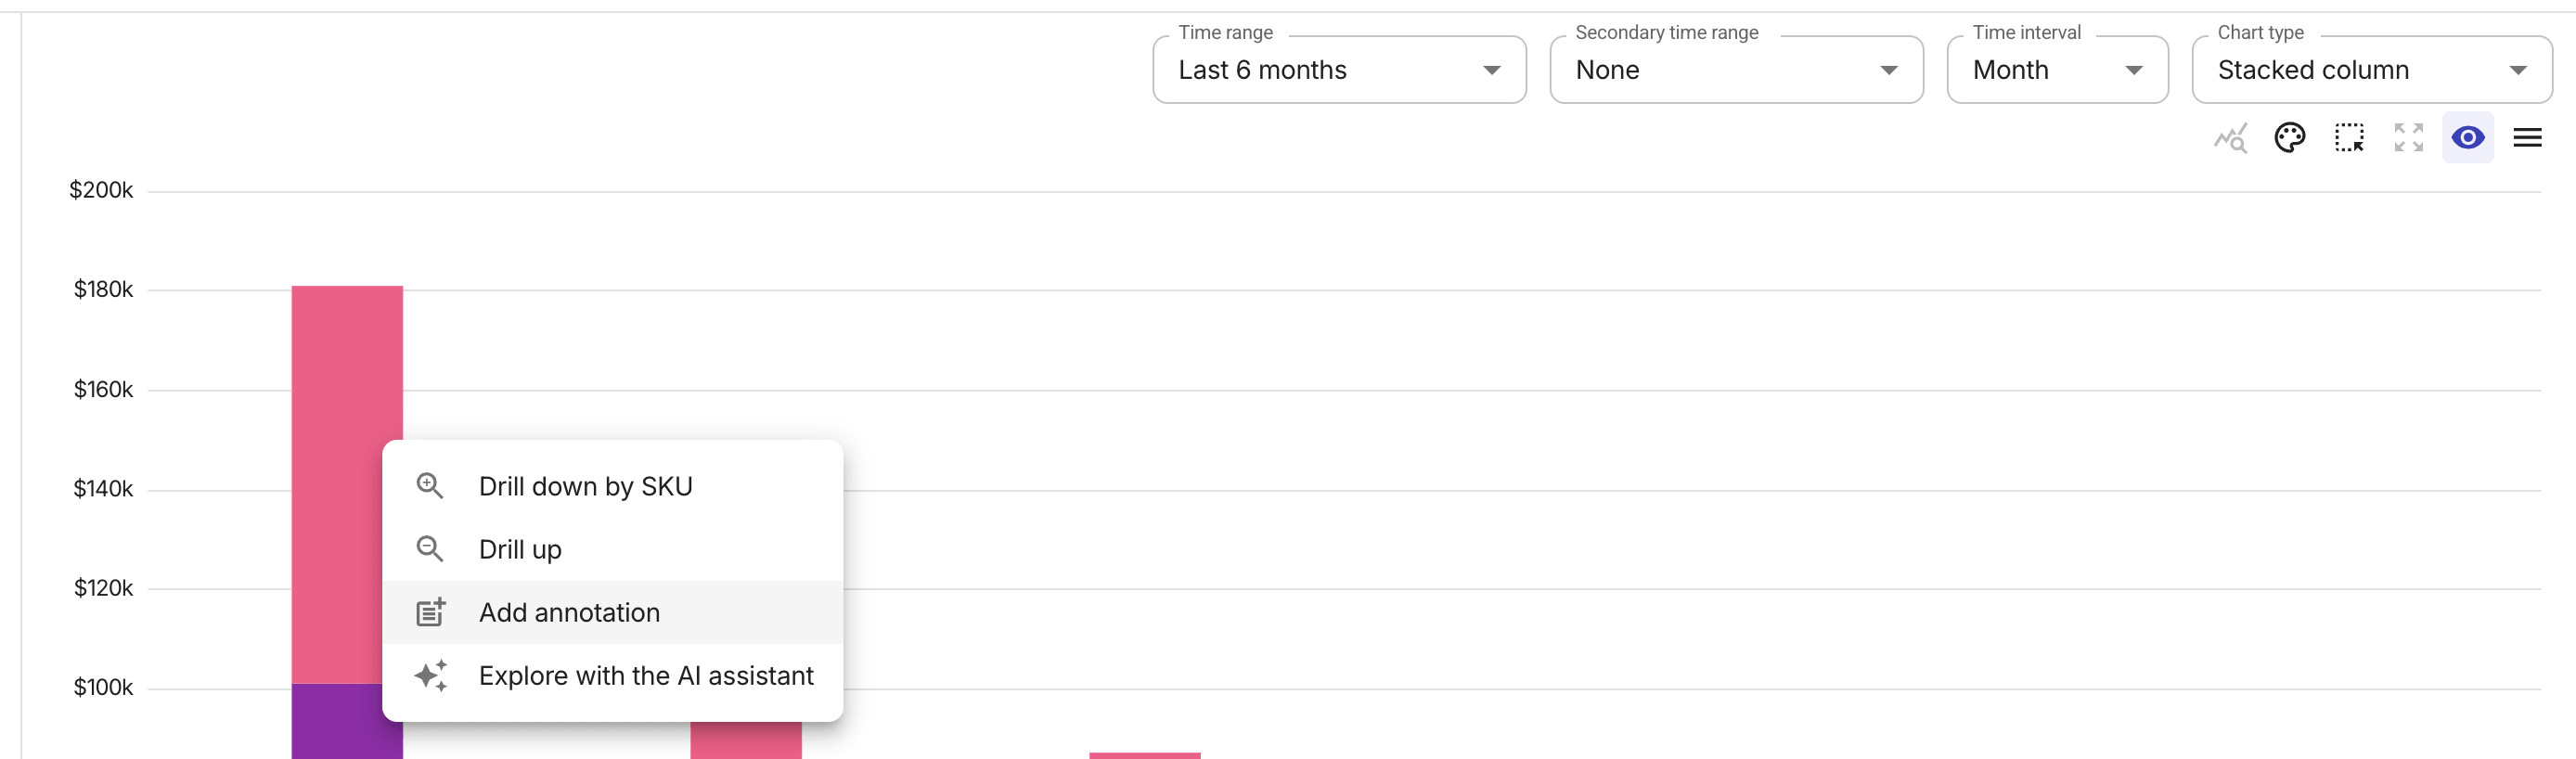
When viewing a report as a column chart (Column chart, Stacked column, Column and Line) or a trend and time-series chart (Line chart, Spline chart, Area chart, Area spline, Stacked area), right-click the chart, a column, or a data point to open the context menu, and then select Add annotation.
-
-
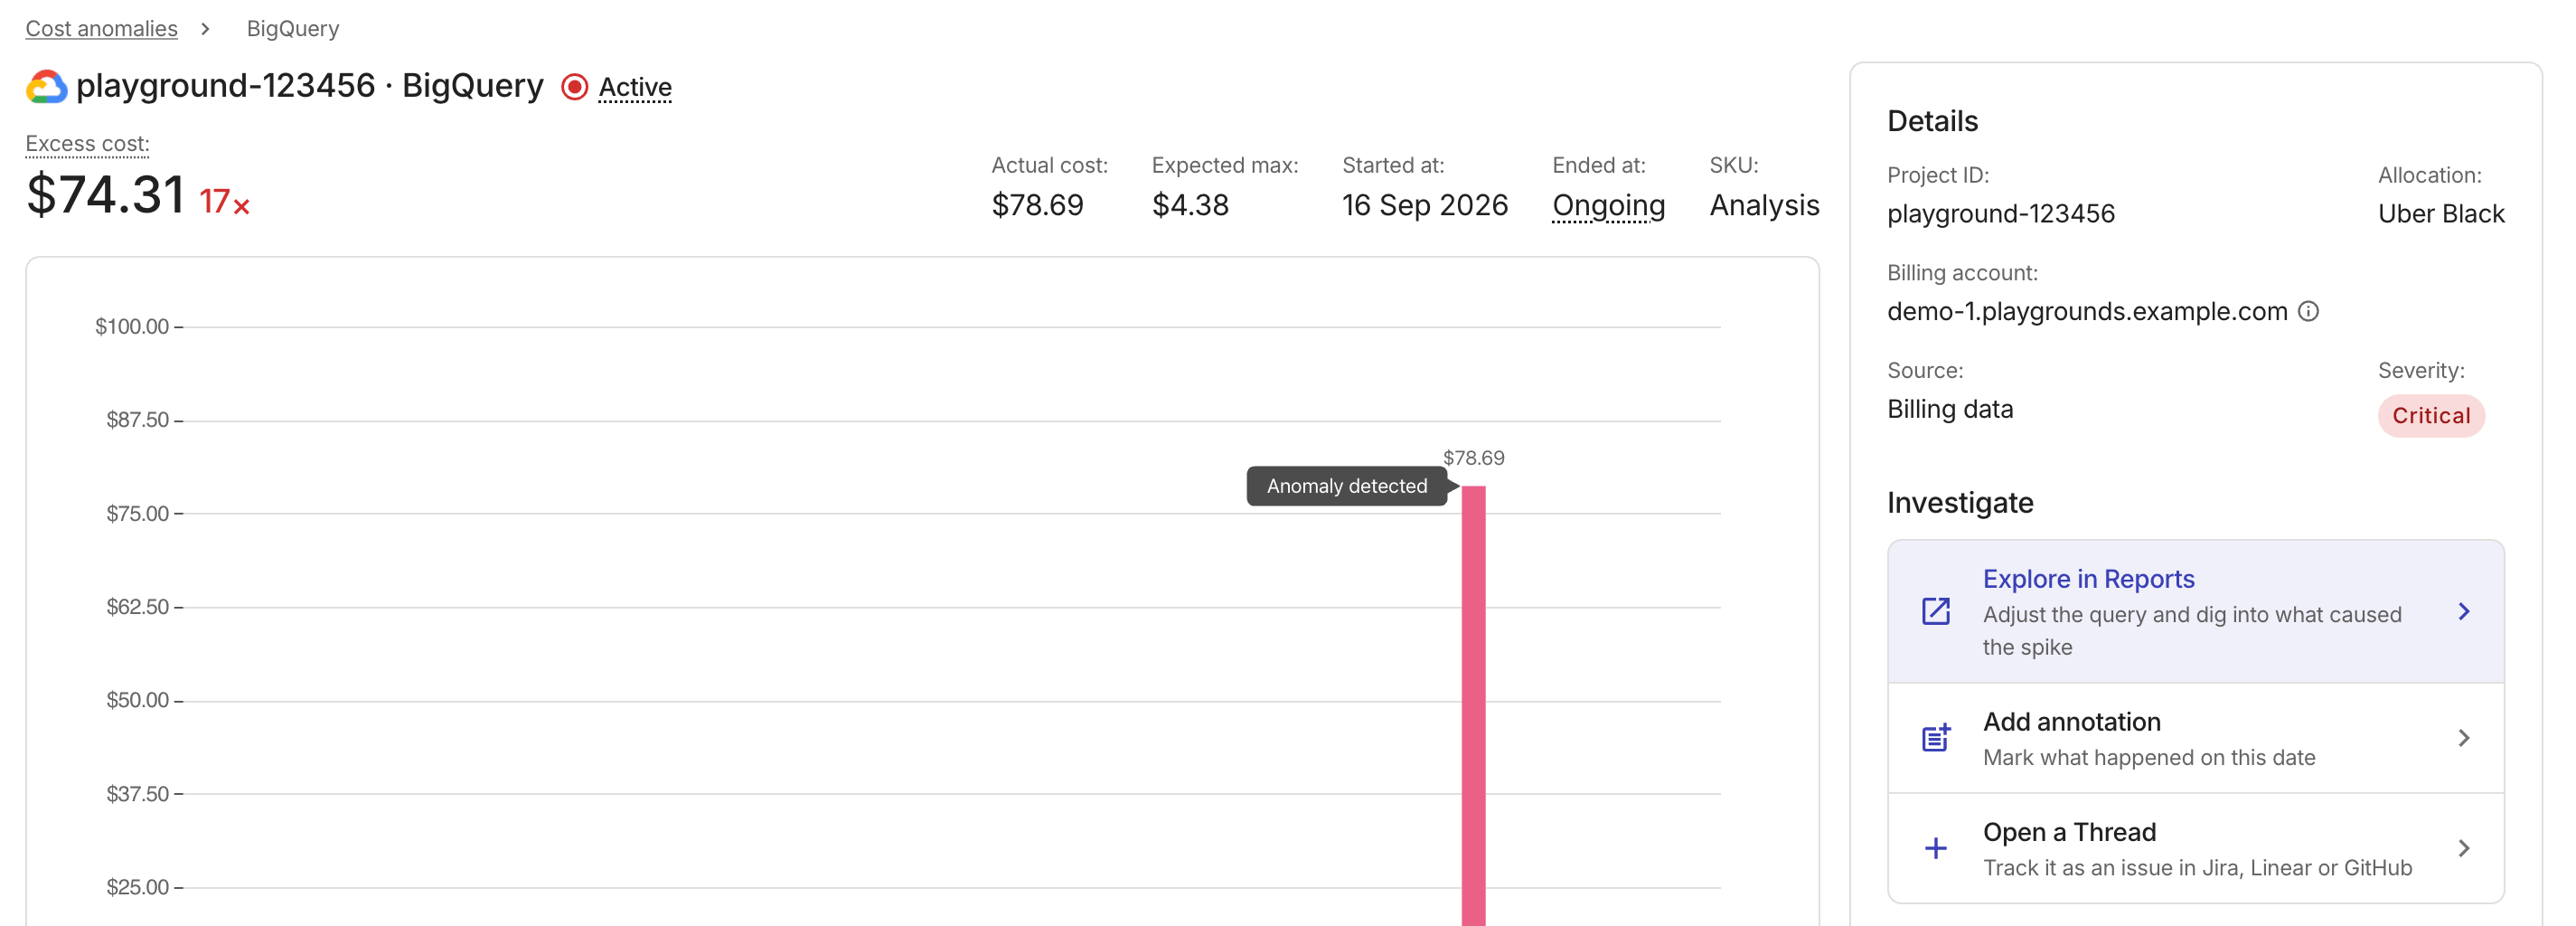
On the cost Anomaly details page, select Add annotation in the details panel to create an annotation that is pre-populated with the anomaly data.
Configure the annotation
-
Select a date and time to which the annotation will be attached.
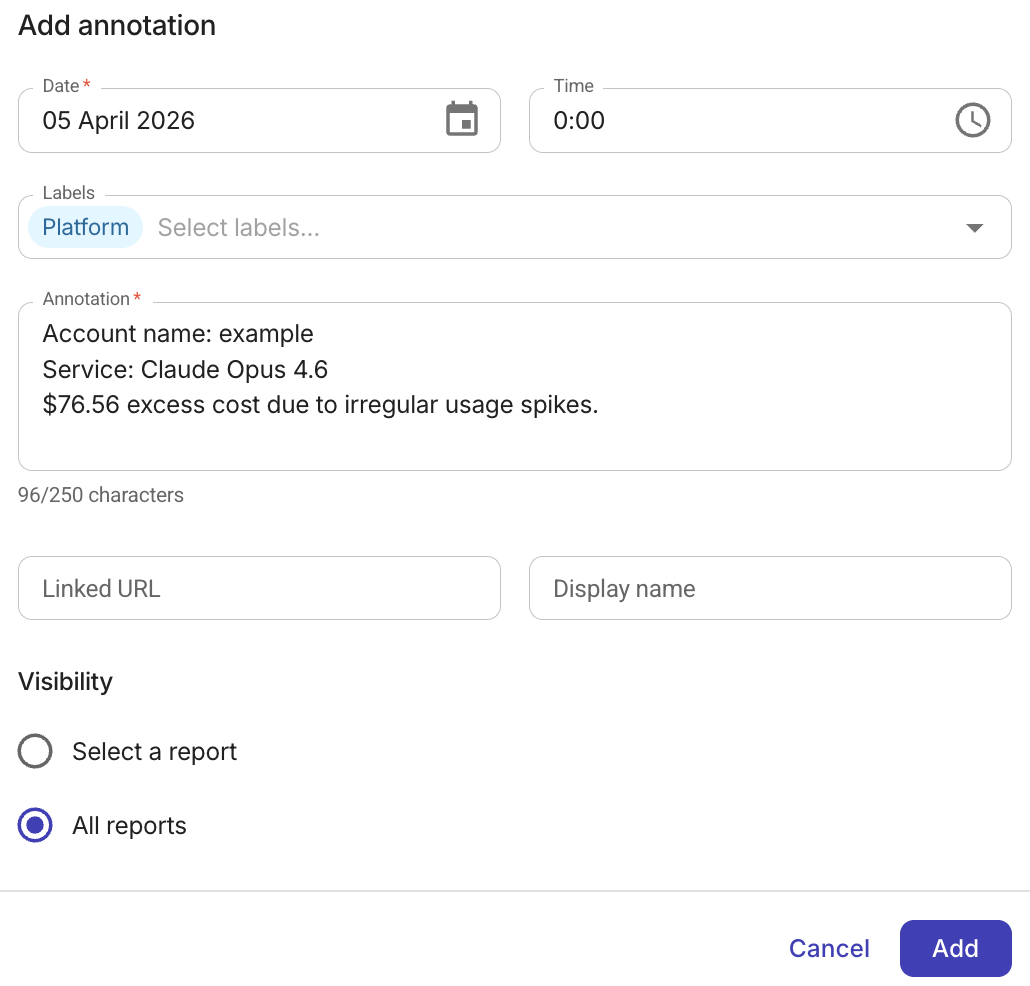
The date can be in the past, present, or future. If you do not specify a time, the system uses the current UTC hour by default.
-
(Optional) Choose a label for the annotation.
-
Enter an annotation message.
-
(Optional) Add an external URL to link additional context, such as a related incident report, runbook, or internal wiki page. You can also provide a display name for the link. The URL must include a valid scheme (e.g.,
https://) and host, and cannot exceed 2,048 characters. -
Specify the visibility of the annotation.
-
On the Annotations page, you can Select a report for the annotation or add the annotation to All reports.
-
On a report page, you can add the annotation to All reports or This report only.
-
-
Select Add. If successful, the annotation will appear on eligible reports and their dashboard widgets on the specified date.
-
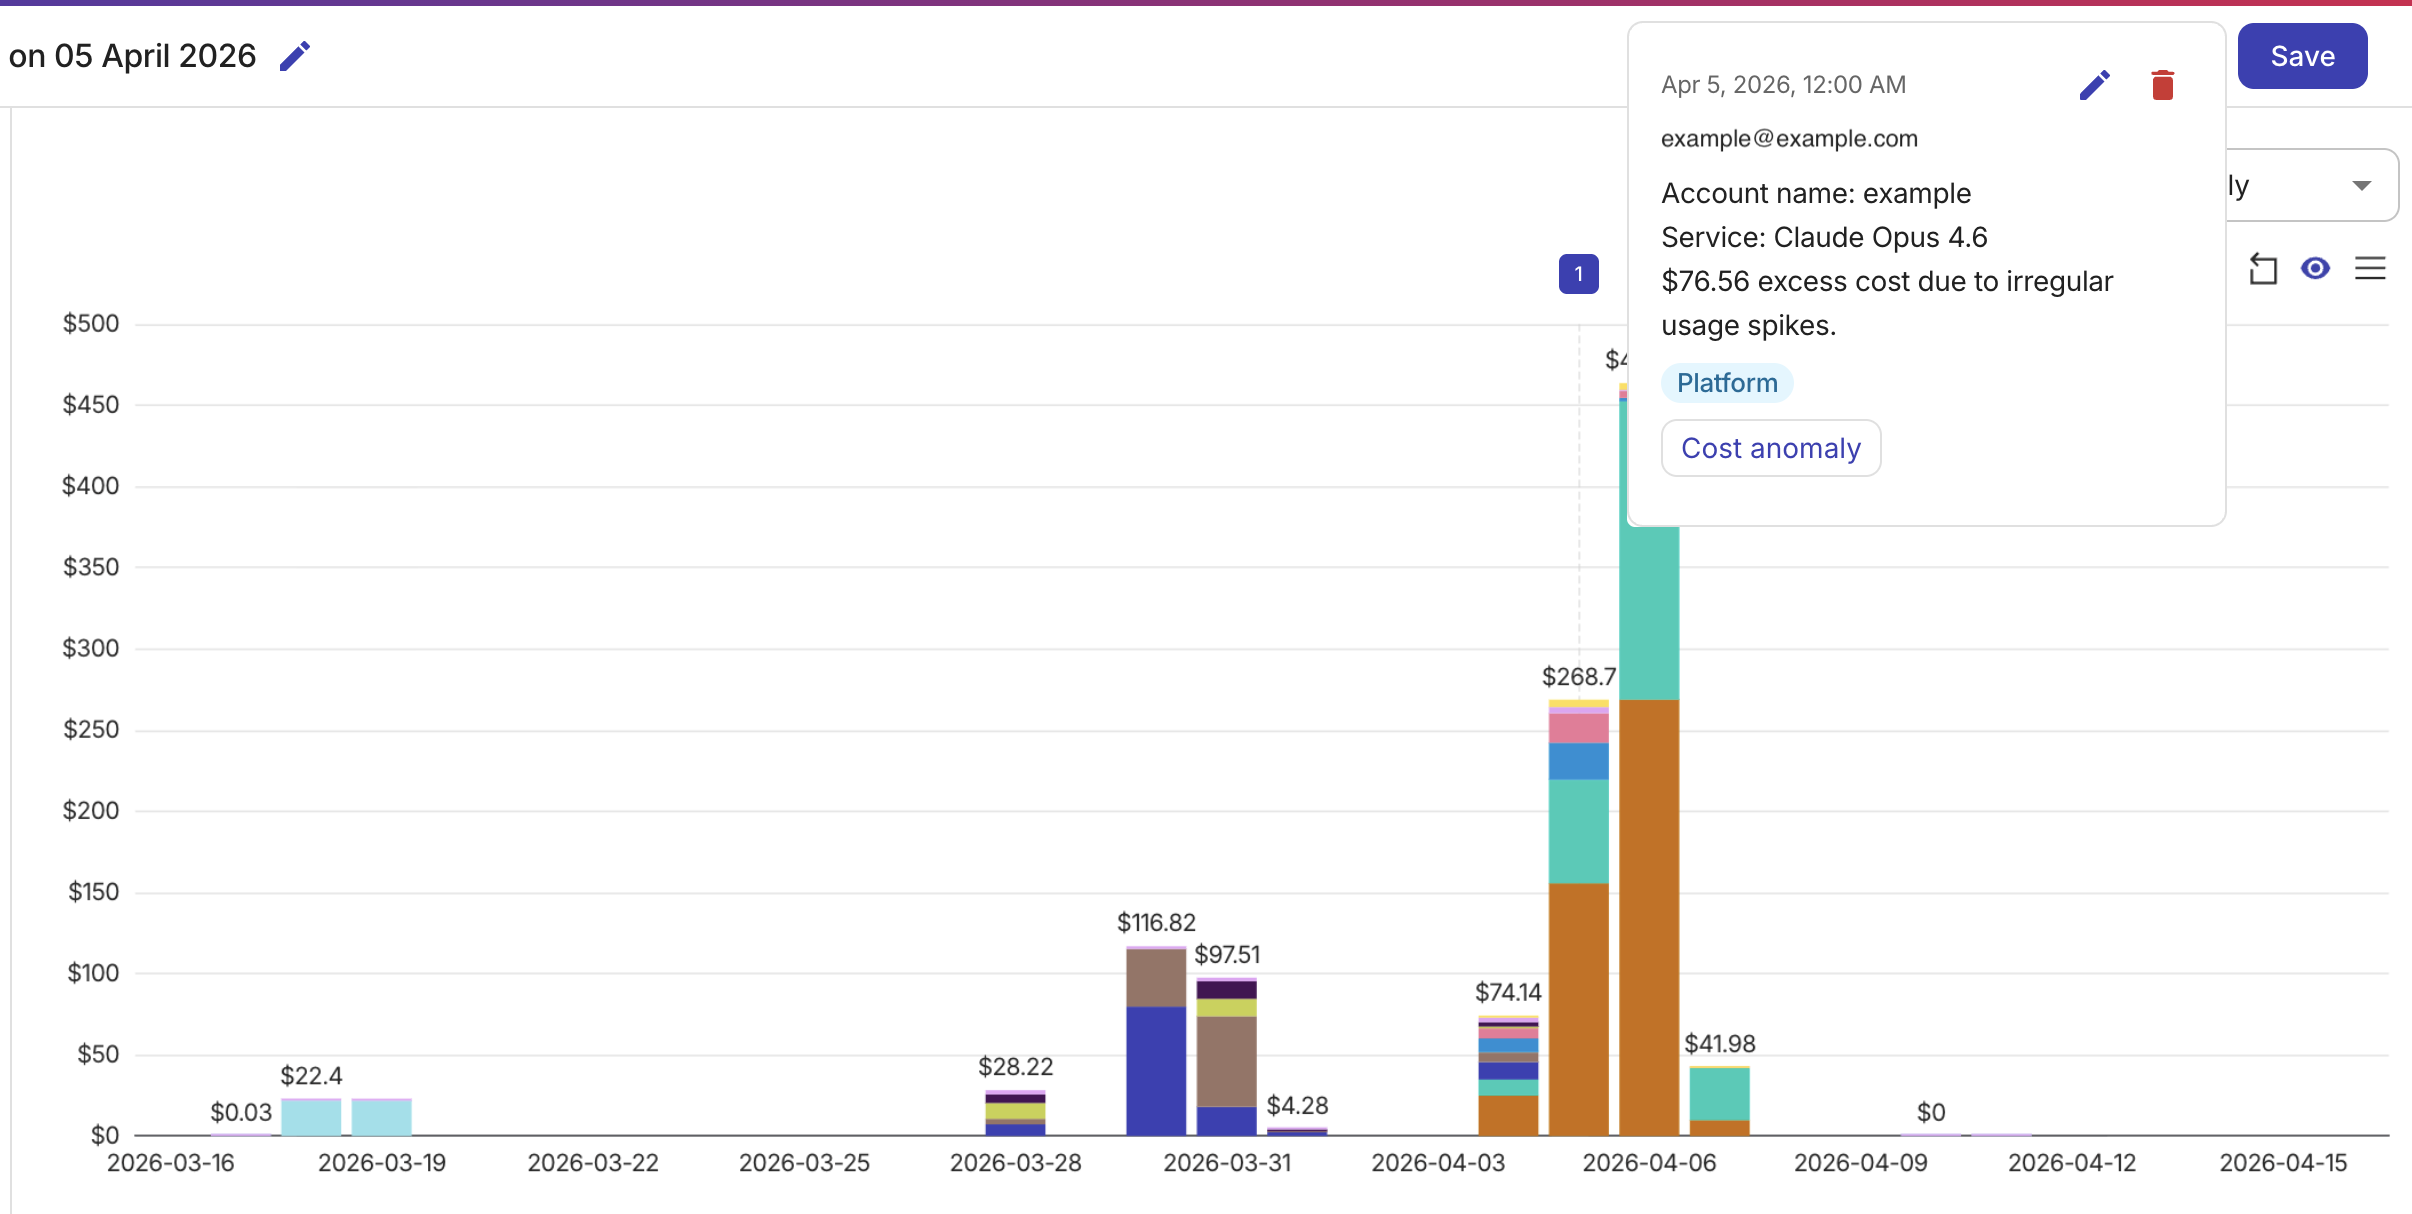
Time-series charts: Annotations appear as visual markers along the timeline.
-
Table views: Annotations are indicated in table headers when events match the date range of that column.
-
In dashboard widgets, select an annotation marker to keep its details open. To edit or delete the annotation, open the report or go to the Annotations page.
If you have included an external URL, the link is displayed on the annotation card with either the display name you provided or the URL's domain name.
When an annotation is created from another area of the platform (for example, from a cost anomaly), it includes a source link that navigates back to the originating page.
Manage annotations
Manage annotations display
You can adjust the display of annotations when viewing a report.
Open the annotations side panel, and then select the Manage annotations display icon (
) in the panel header.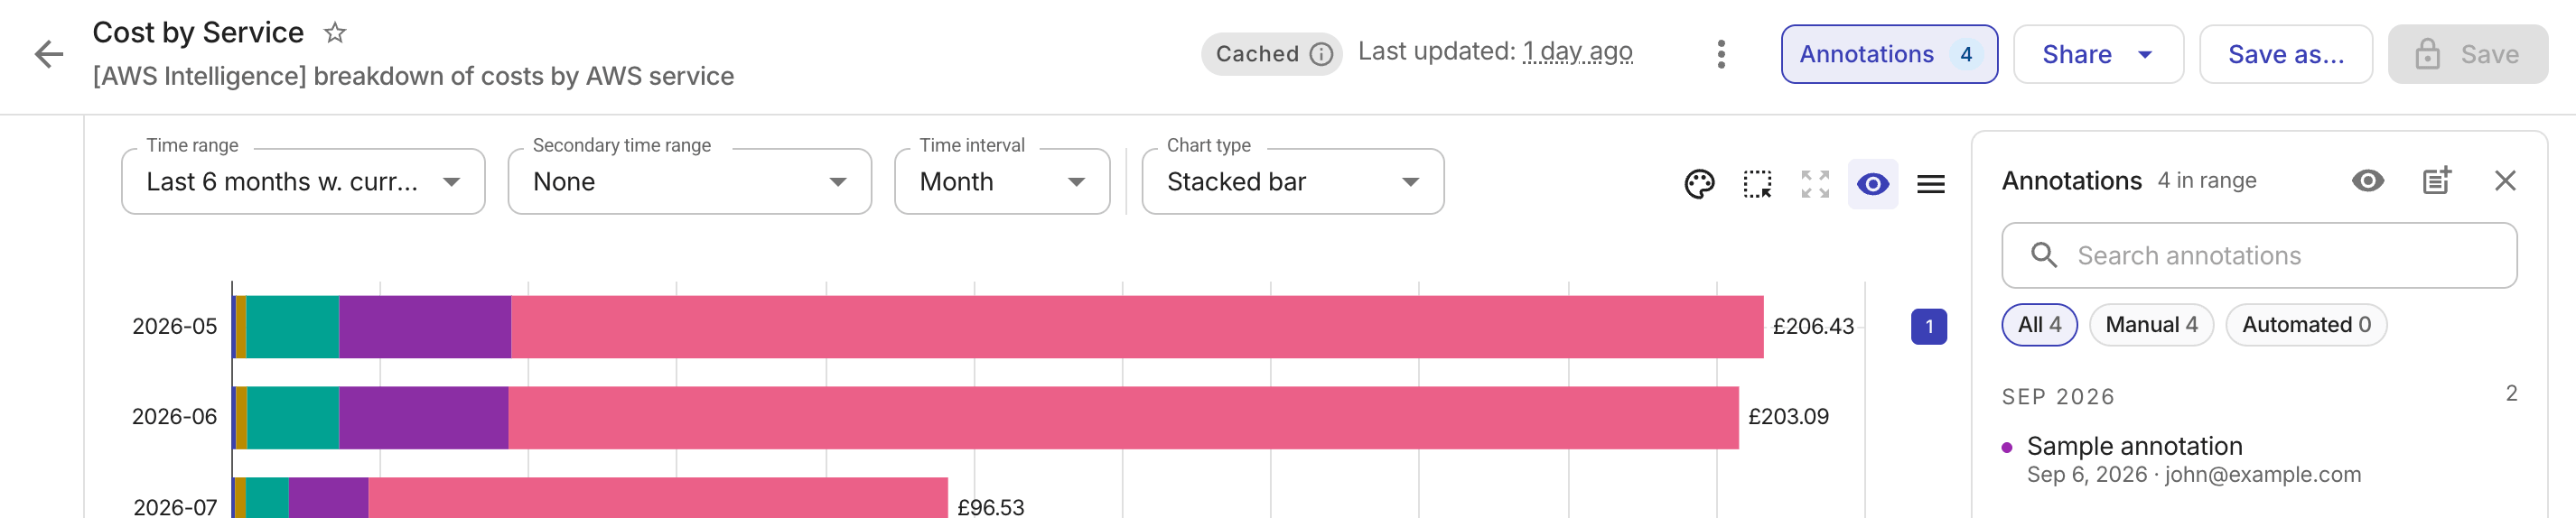
Available options:
-
Show all annotations, Hide all annotations
-
Show annotations matching report labels: Displays annotations that share at least one label with the current report. Be aware that, as labels cannot be assigned to pre-built objects, selecting this option for a preset report will hide all annotations.
-
Show annotations with specific labels: Displays annotations that have at least one of the labels you choose from the dropdown.
Edit an annotation
You can edit an annotation from either the Annotations page or a report page.
-
On the Annotations page:
-
Locate the annotation entry of interest.
-
Select the kebab menu (⋮) at the rightmost end of the entry, and then select Edit.
-
-
On a report page:
-
Move your mouse over the annotation marker on the report.
-
Select the Edit icon.
-
Select Save. The change is effective immediately on all relevant reports.
Delete an annotation
You must be an annotation's owner or have the Cloud Analytics Admin permission to delete it. Once deleted, the annotation is removed from all relevant reports.
You can delete a single annotation from either the Annotations page or a report page.
-
On the Annotations page:
-
Locate the annotation entry of interest.
-
Select the kebab menu (⋮) at the rightmost end of the entry, and then select Delete.
-
-
On a report page:
-
Move your mouse over the annotation marker on the report.
-
Select the Delete icon.
-
To delete multiple annotations at once:
-
Navigate to the Annotations page.
-
Select the checkbox of each annotation that you want to delete. You can filter annotations by property.
-
Select the Delete button next to the filter to perform a batch delete.
You'll be asked to confirm the deletion before it's executed.
Annotations in PDF reports
When you export a report as PDF or receive a PDF attachment from a scheduled report email, annotations are included in the PDF. Your annotation display settings determine which annotations appear. For scheduled report emails, the subscription owner's display settings are used.
See also
-
API Reference: Annotations
-
Cloud Intelligence CLI command group: Annotations