Dashboard and widgets
Required permissions
- To access BigQuery Intelligence dashboard and widgets, your DoiT account needs the Cloud Analytics User permission.
BigQuery Intelligence dashboard
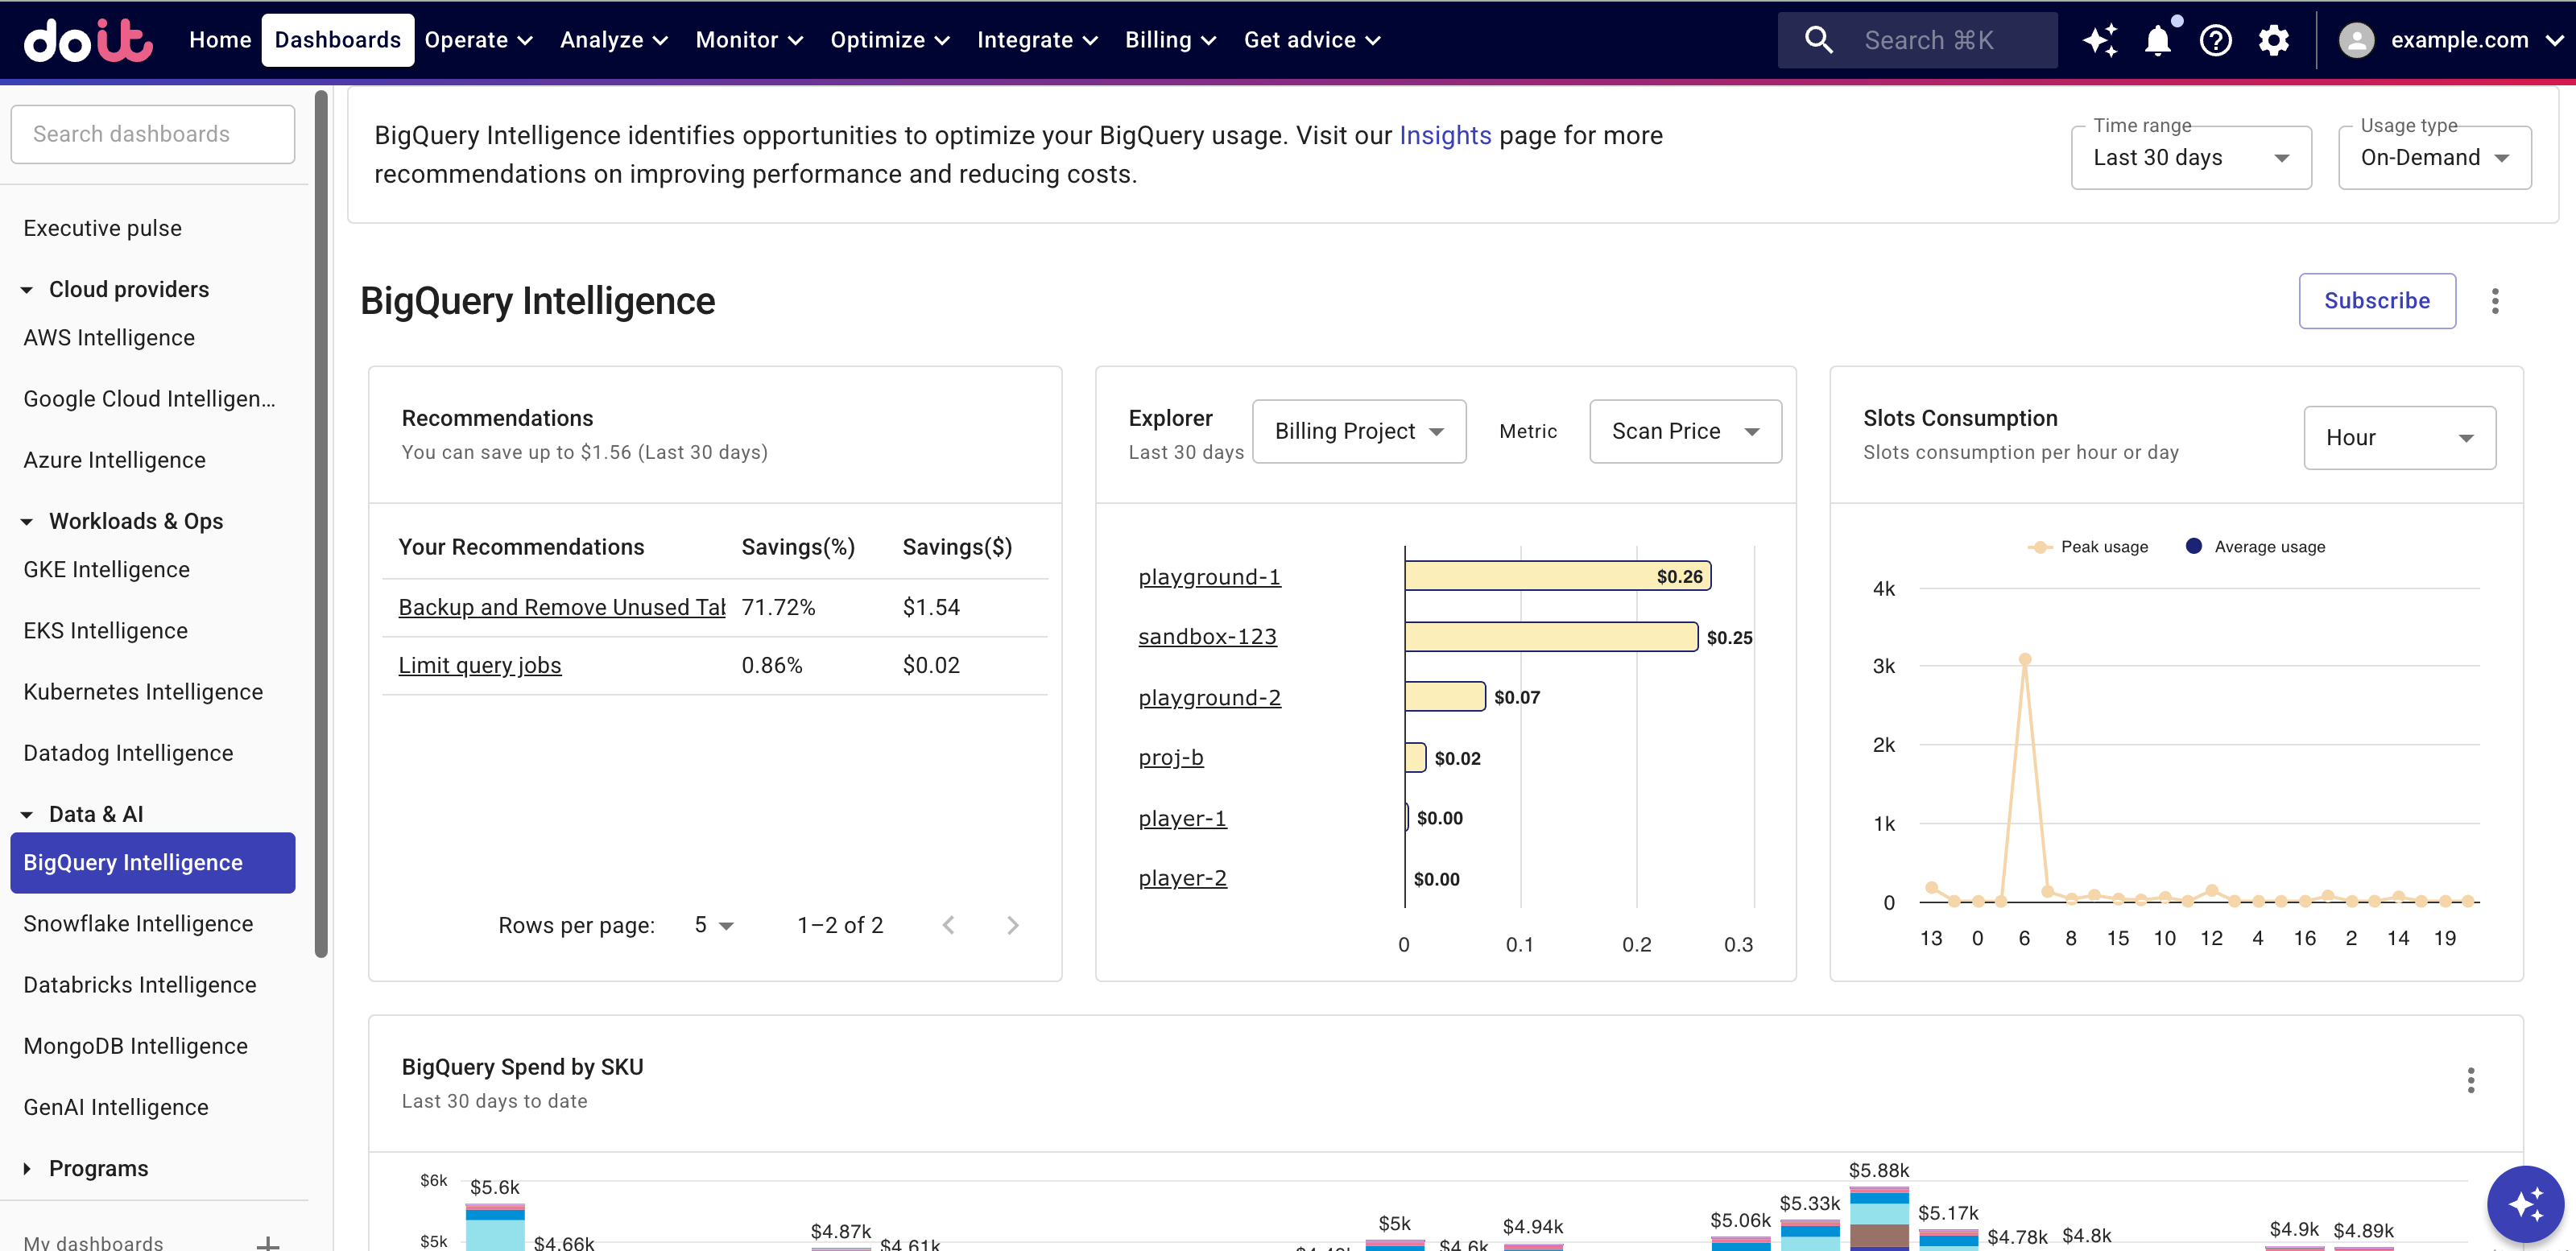
The BigQuery Intelligence dashboard consists of widgets that highlight different aspects of your BigQuery usage.
General settings:
-
Time range: Adjusts the time frame of the data you're looking at. Options: Last day, Last 7 days, and Last 30 days.
-
Usage type: Filters queries by pricing models. Options:
-
On-Demand: Queries that are billed using the on-demand compute pricing model.
-
Standard Edition, Enterprise Edition, Enterprise Plus Edition: Queries that are billed using the capacity compute pricing model of BigQuery editions.
-
Flat-Rate Legacy: The BigQuery flat-rate pricing model is no longer offered. This option applies only to customers who have existing flat-rate commitments and haven't upgraded to DoiT Cloud Intelligence yet.
-
Widgets
-
Except BigQuery Spend by SKU, all other widgets on the BigQuery Intelligence dashboard are updated daily at 01:00 AM UTC.
-
The BigQuery Intelligence only reports on costs from BigQuery jobs and reservations. The accuracy of the reports relies on the completeness of Google's data access logs, which may have gaps, such as for streaming inserts. As the logs are the sole source of data, any information not present in them cannot be reported on.
Recommendations
The Recommendations widget shows actionable insights into BigQuery optimizations that are relevant to your usage. You can select individual recommendations to see the details.
Compute recommendations
-
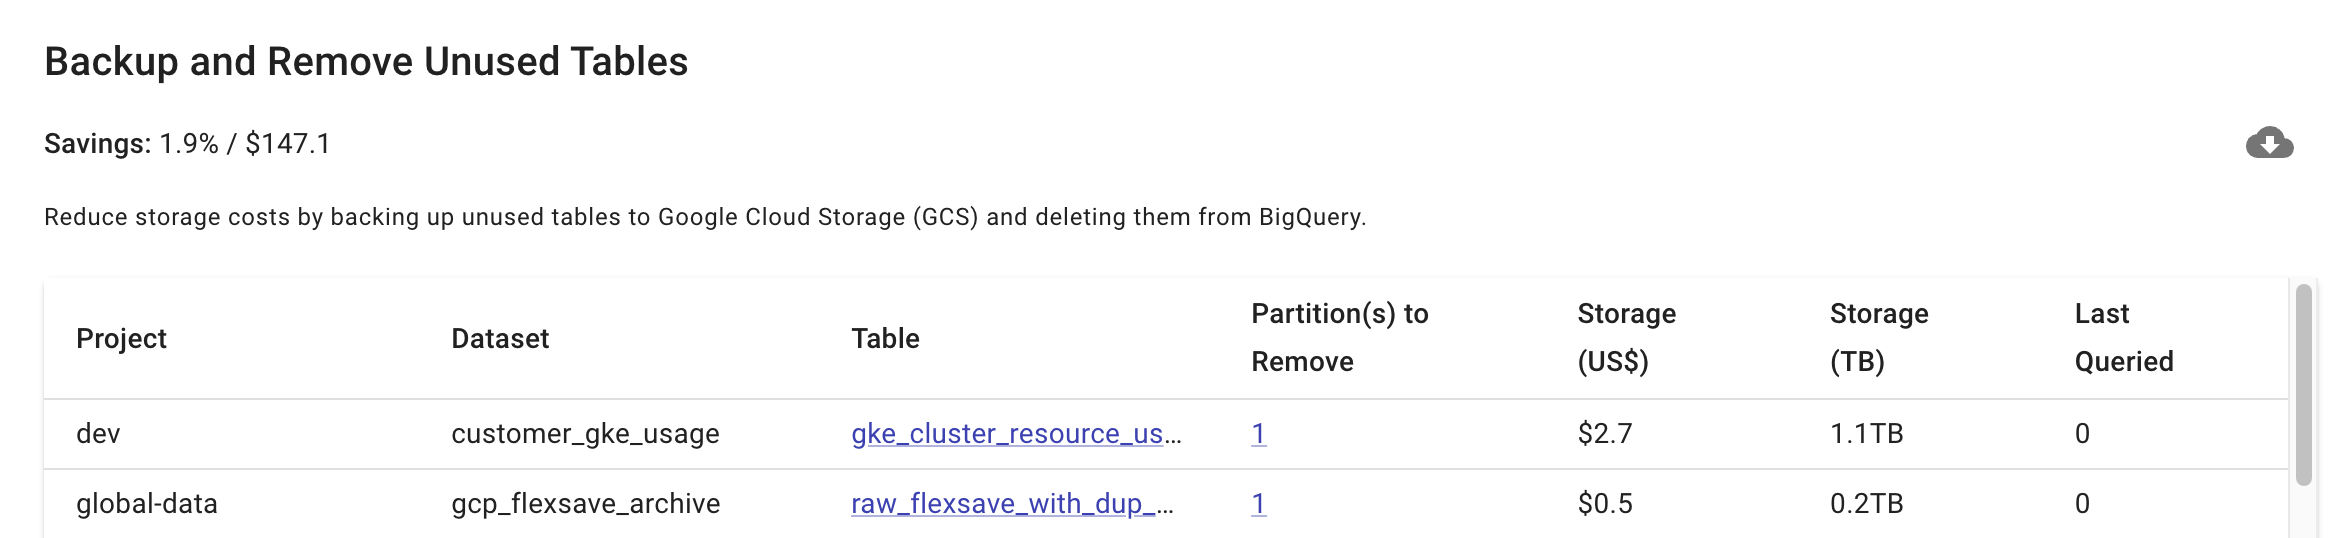
Backup and remove unused tables: This recommendation applies to all usage types. It lists the unused tables that you can back up and then remove from BigQuery to reduce storage costs.
Below is an example:
-
The
Projectcolumn shows the billing project. See Project and Billing project. -
Choose a table in the
Tablecolumn to open it in your Google Cloud BigQuery console. -
If the table has multiple partitions, select the number in the
Partition(s) to Removecolumn to see which partitions should be removed. -
You can also download the full list as a CSV file.
-
On-demand pricing model recommendations
-
Limit query jobs: Reduce execution frequency of the listed jobs in the
Query IDcolumn by the percentage you choose on the slider and view theSavings by Reducing Jobs. -
You also get recommendations on partitioning or clustering BigQuery tables via Insights if applicable.
Capacity pricing model recommendations
If you use BigQuery editions with 1-yr or 3-yr slot commitments, or if you have Flat-Rate Legacy usage, you will see the following recommendation when applicable:
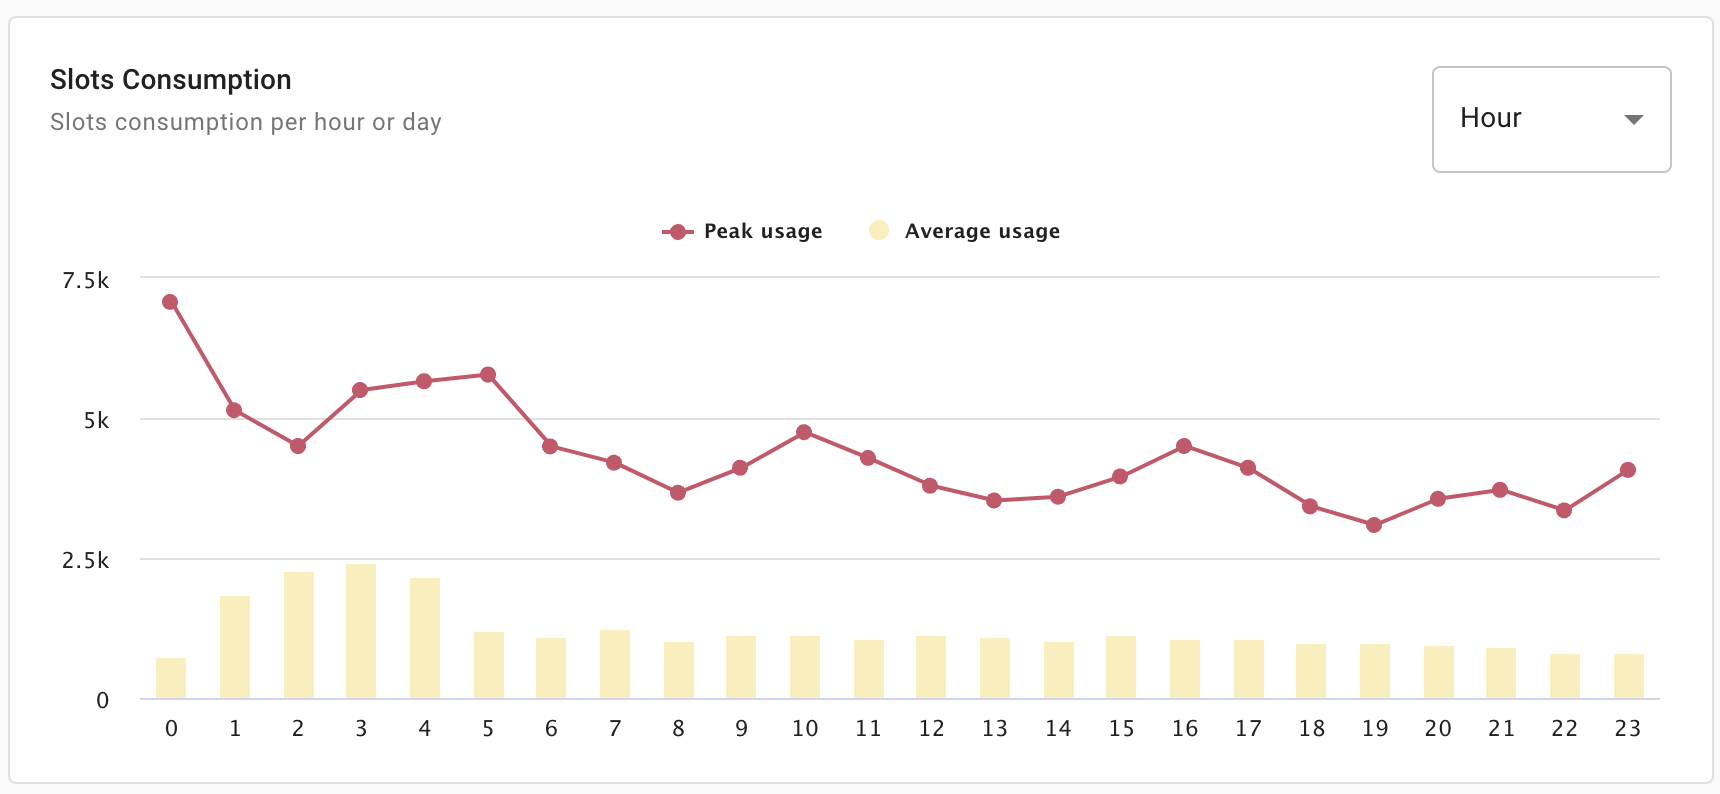
- Move recurring queries to a different time slot: Lower your minimum average slots requirements by moving the recurring queries to a less-busy hour of the day. Review the Slots Consumption widget with the interval set to
Hourto identify suitable hours. Troughs in your daily slots consumption indicate optimal hours to run recurring queries.
Storage recommendations
-
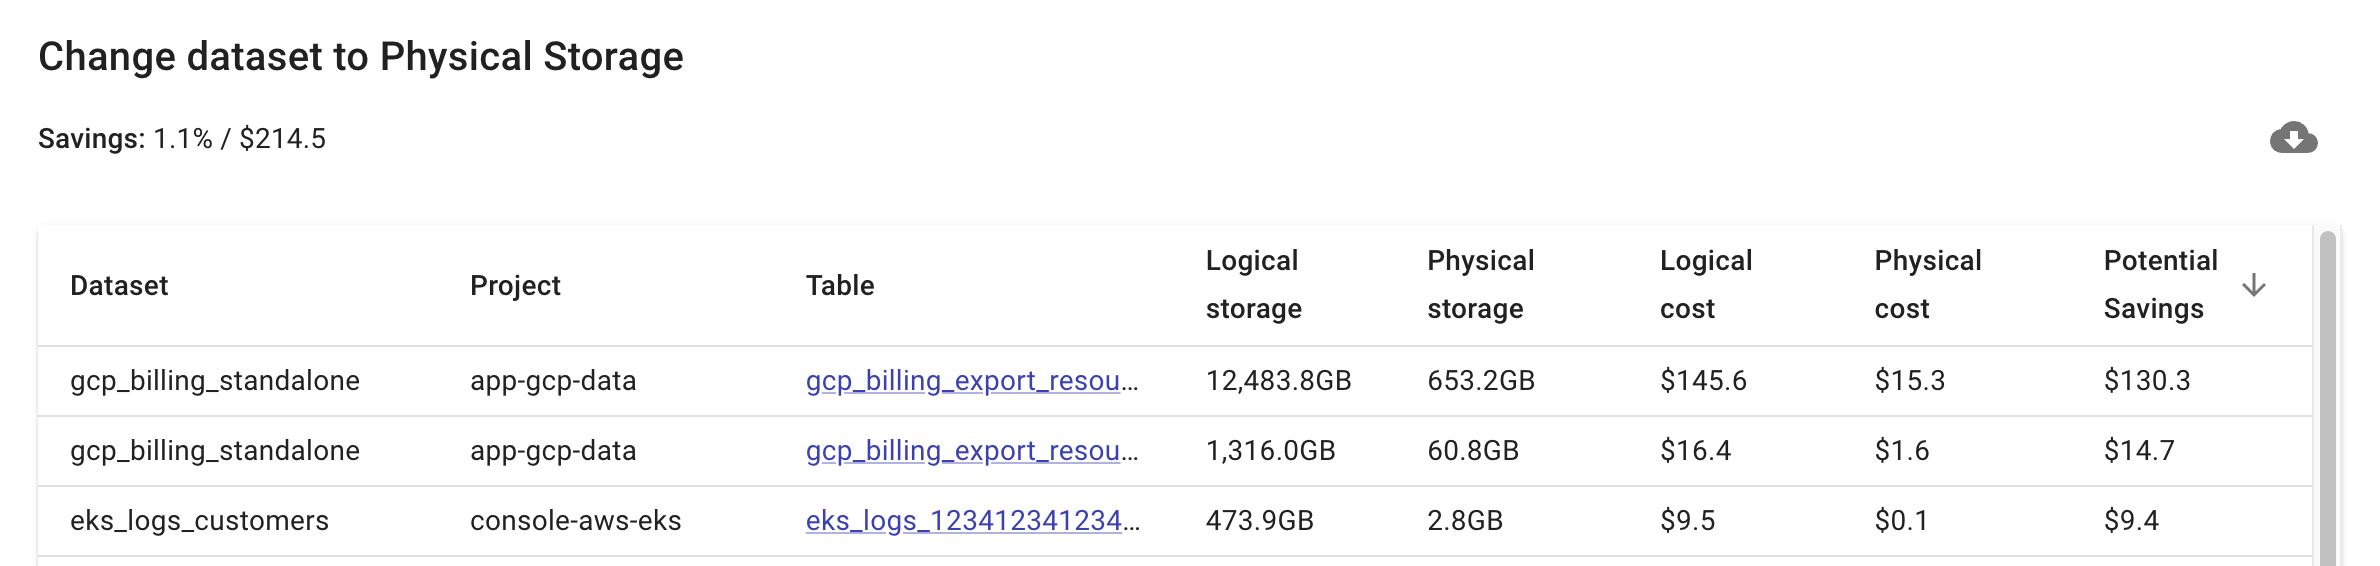
Change dataset to Physical Storage: Change a dataset's storage billing model to pay for the compressed physical storage used by tables in the dataset.
You can open the recommendation link to view the detailed information on datasets that could benefit from using the physical storage billing model, including the project, table, logical storage size, physical storage size, logical storage cost, physical storage cost, and potential savings.
-
The
Projectcolumn shows the billing project. See Project and Billing project. -
Select a table name in the
Tablecolumn to open it in your Google Cloud BigQuery console. -
You can also download the full list as a CSV file.
NoteReview Google's physical storage documentation for eligibility criteria. The BigQuery Intelligence recommendation doesn't perform eligibility check.
-
Explorer
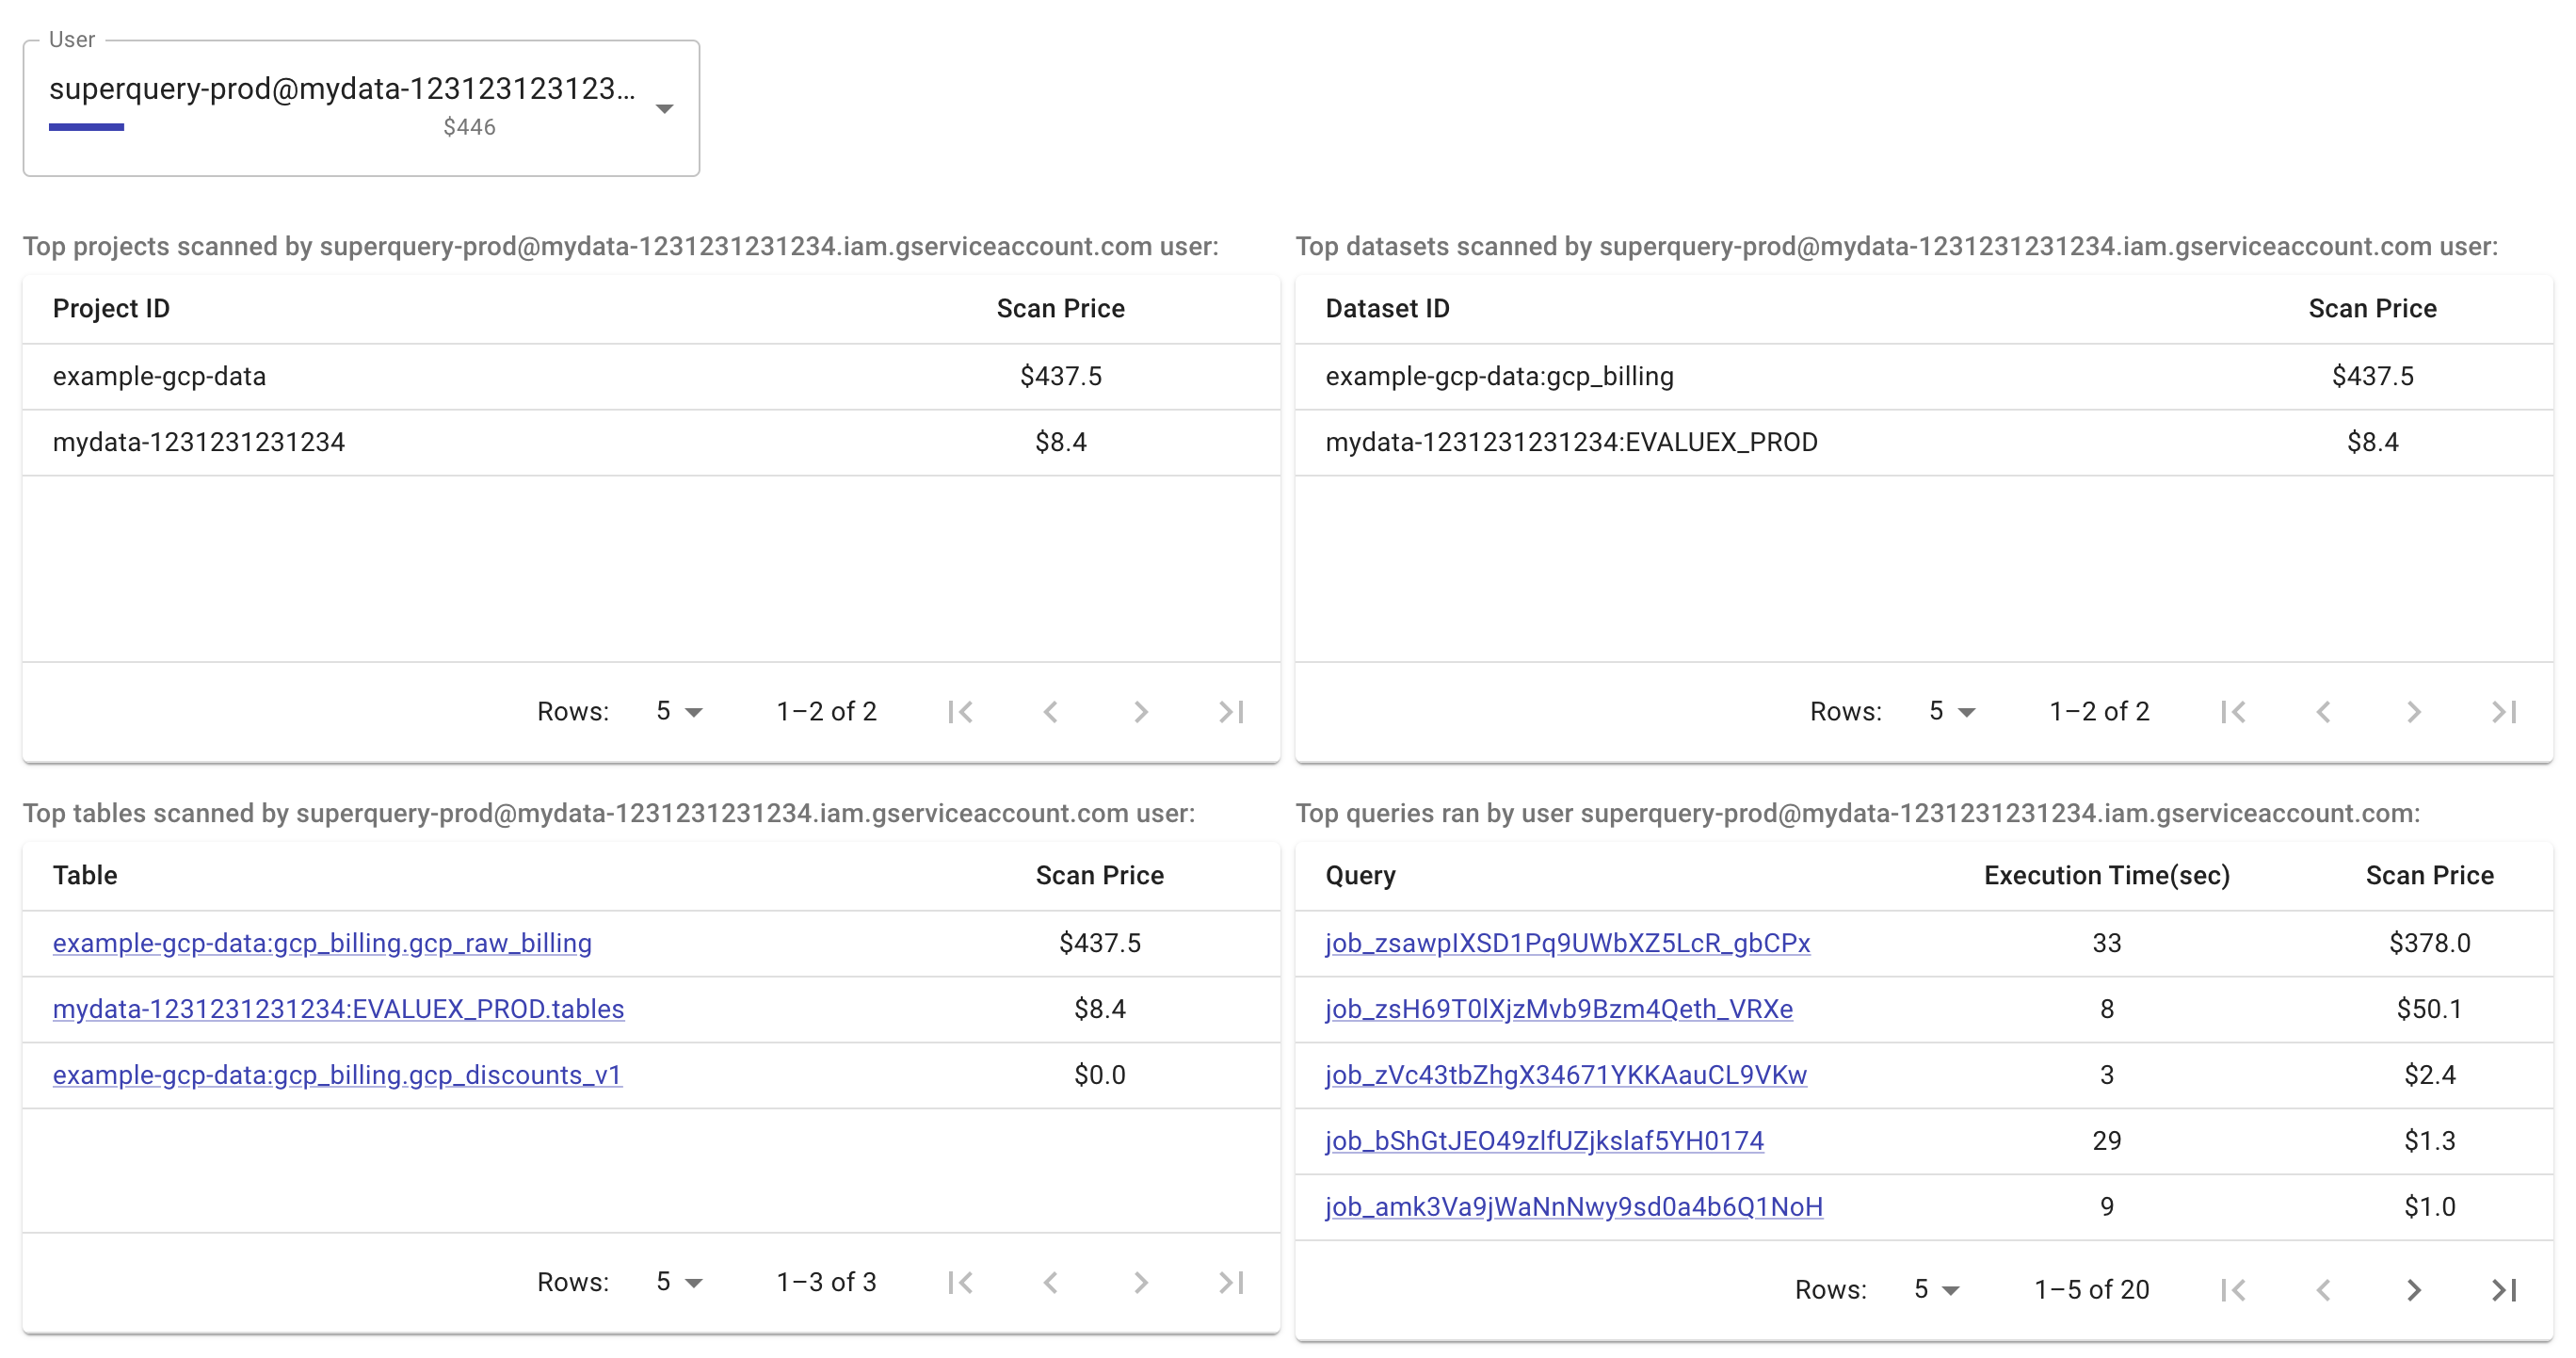
Use the Explore widget to get granular information about your BigQuery usage. You can select individual entries to drill down into the data.
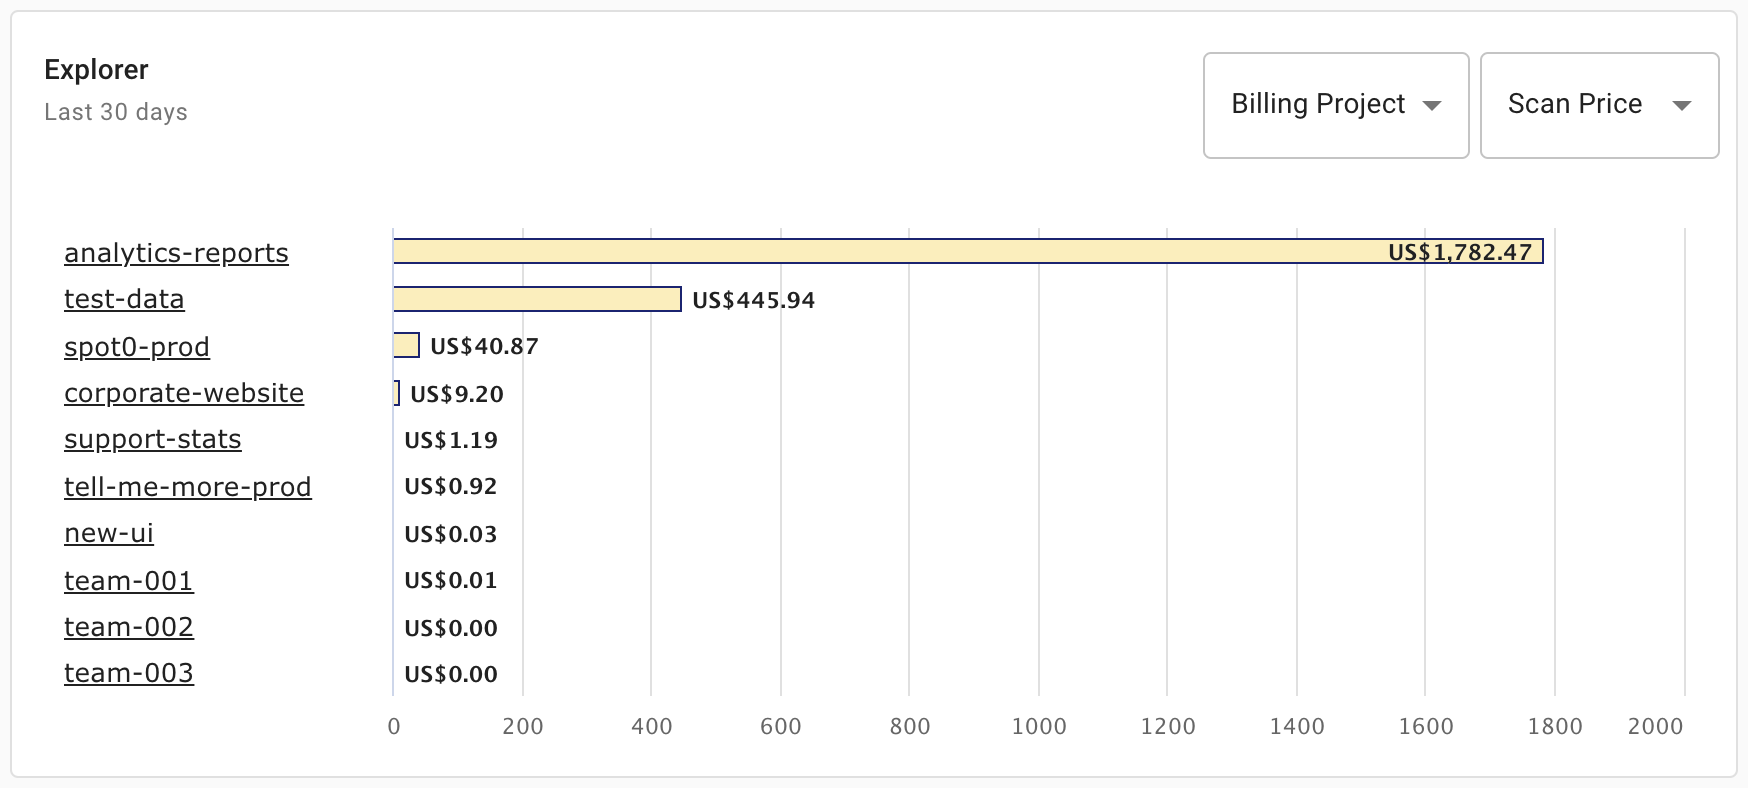
The metrics available vary with the scope and usage type.
| Usage type | Scope | Metric |
|---|---|---|
| On-Demand, Edition (pay as you go) | Billing Project, User | Scan Price, Scan TB |
| On-Demand, Edition (pay as you go) | Project, Dataset, Table | Scan Price, Scan TB, Storage Price, Storage TB |
| Edition (one year and three year commitments), Flat-Rate Legacy | Billing Project, User | Average Slots |
| Edition (one year and three year commitments), Flat-Rate Legacy | Project, Dataset, Table | Storage Price, Storage TB |
The example below shows the scan price of a chosen user. You can also select the individual queries run by the user to view the price.
Project and Billing project
-
The Project contains the data that is queried during the job. It is called data project in the BigQuery audit logs overview.
-
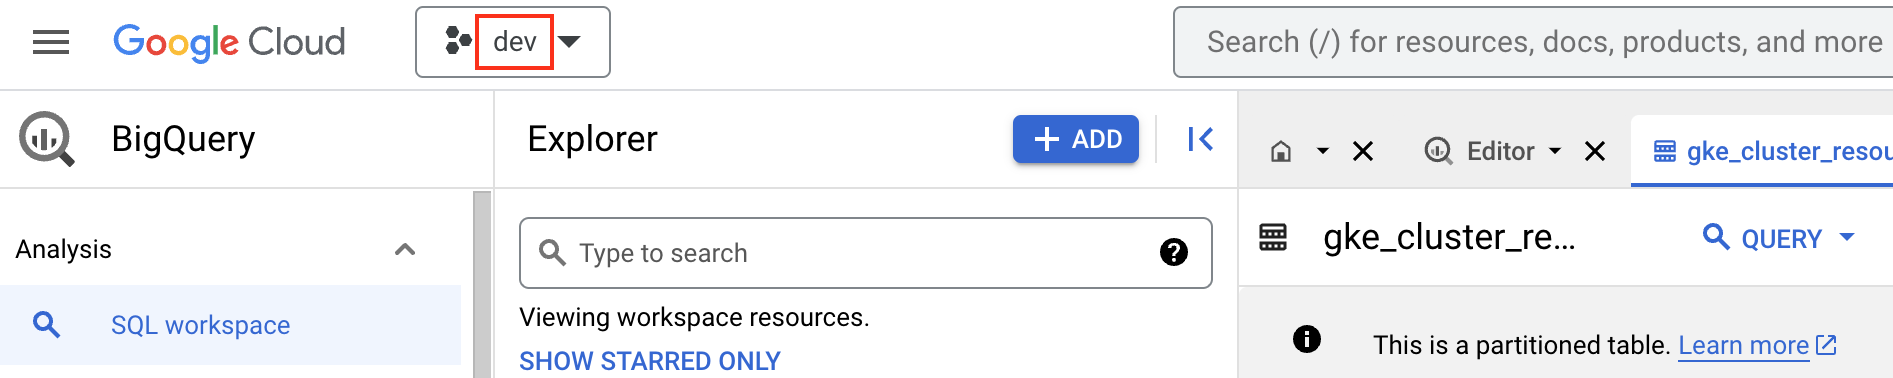
The Billing project is the project that runs the query. It is the project where you create your service account.
The example below shows where you can find the billing project in the Google Cloud BigQuery console.
"Not yet allocated" items
BigQuery Intelligence may not be able to detect which table is being scanned due to the following reasons:
- Queries like
SELECT 1 - Queries we are unable to parse due to complexity (i.e., a parser time out)
- Queries that use a function or statement that we do not support yet
In such cases, you'll see Not yet allocated items in the BigQuery Intelligence Explorer widget.
Slots consumption
Shows the number of slots consumed by your organization in terms of Peak usage and Average usage per Hour or Day.
The example below shows the slots assumption when the usage type is one of BigQuery editions.
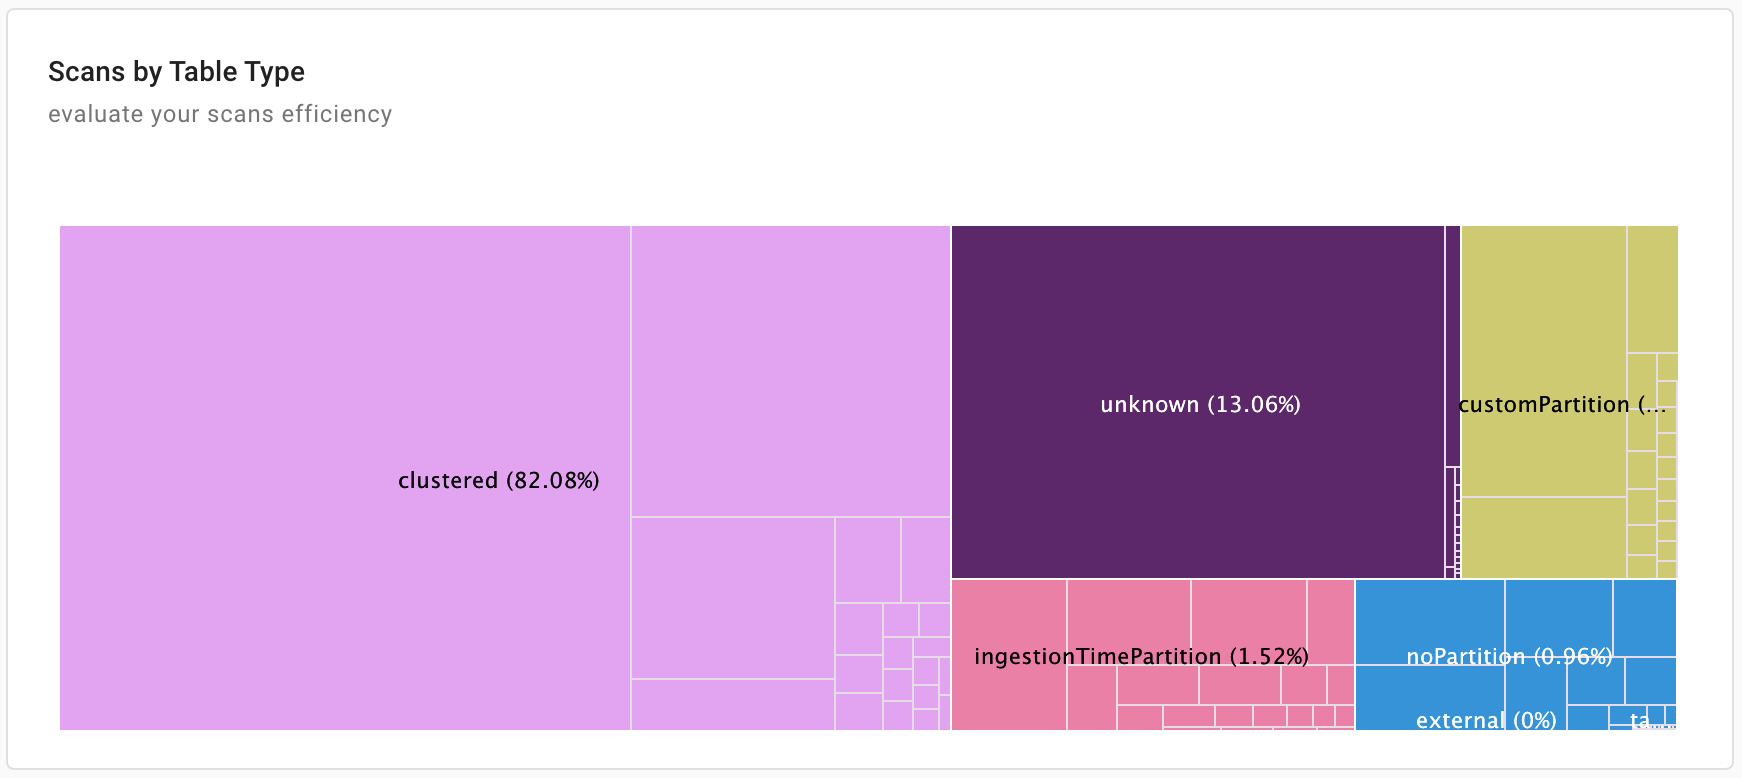
Scans by table type
This widget shows the volume of data you are scanning from various types of tables, broken down between unpartitioned tables and multiple types of partitioned tables, along with external sources (e.g., Google Sheets).
You can select a table type to see the most frequently scanned tables of that type.
BigQuery spend by SKU
This widget shows a breakdown of BigQuery costs per SKU.
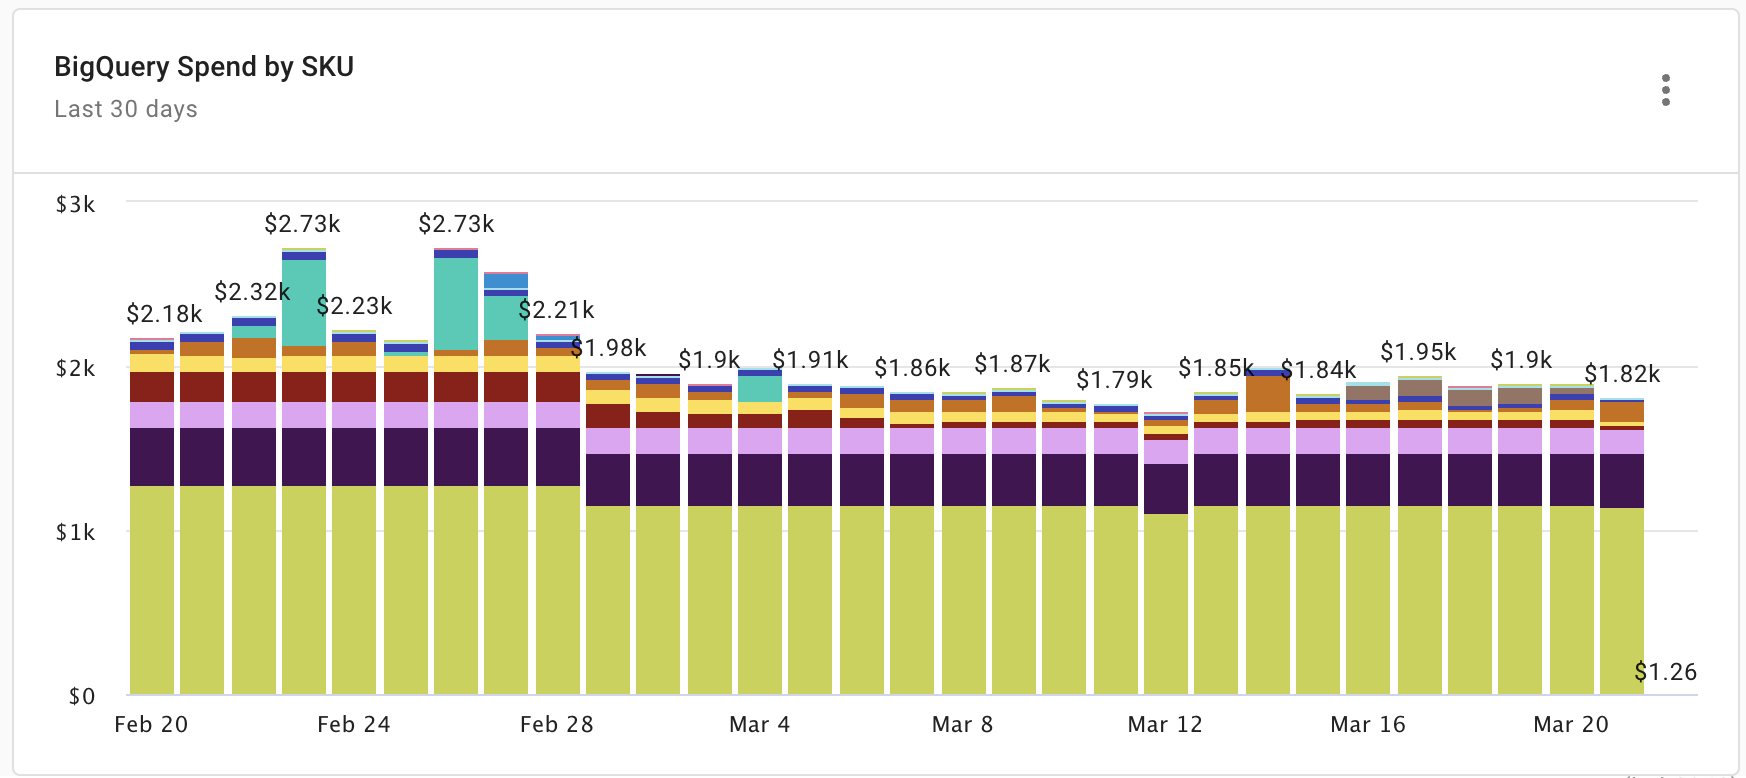
You can select the kebab menu (⋮) in the upper-right corner of the widget for two additional options:
-
Refresh: By default, the BigQuery Spend by SKU widget is updated twice per day. Use the Refresh option to fetch the latest billing data from Google.
NoteThe information shown in the widget is when the DoiT Platform retrieves the billing data, while the freshness of the data is decided by Google Cloud's frequency of data loads.
-
Open full report: Opens the report that generates the visualization in this widget.
What's next
-
Read our blog series on BigQuery Optimizations.
-
Check out our on-demand events.