Add reports to a dashboard
You can add reports to a custom dashboard for an at-a-glance view of your cloud data points.
Required permission
- Cloud Analytics User
Add a report
To add a report to dashboard:
-
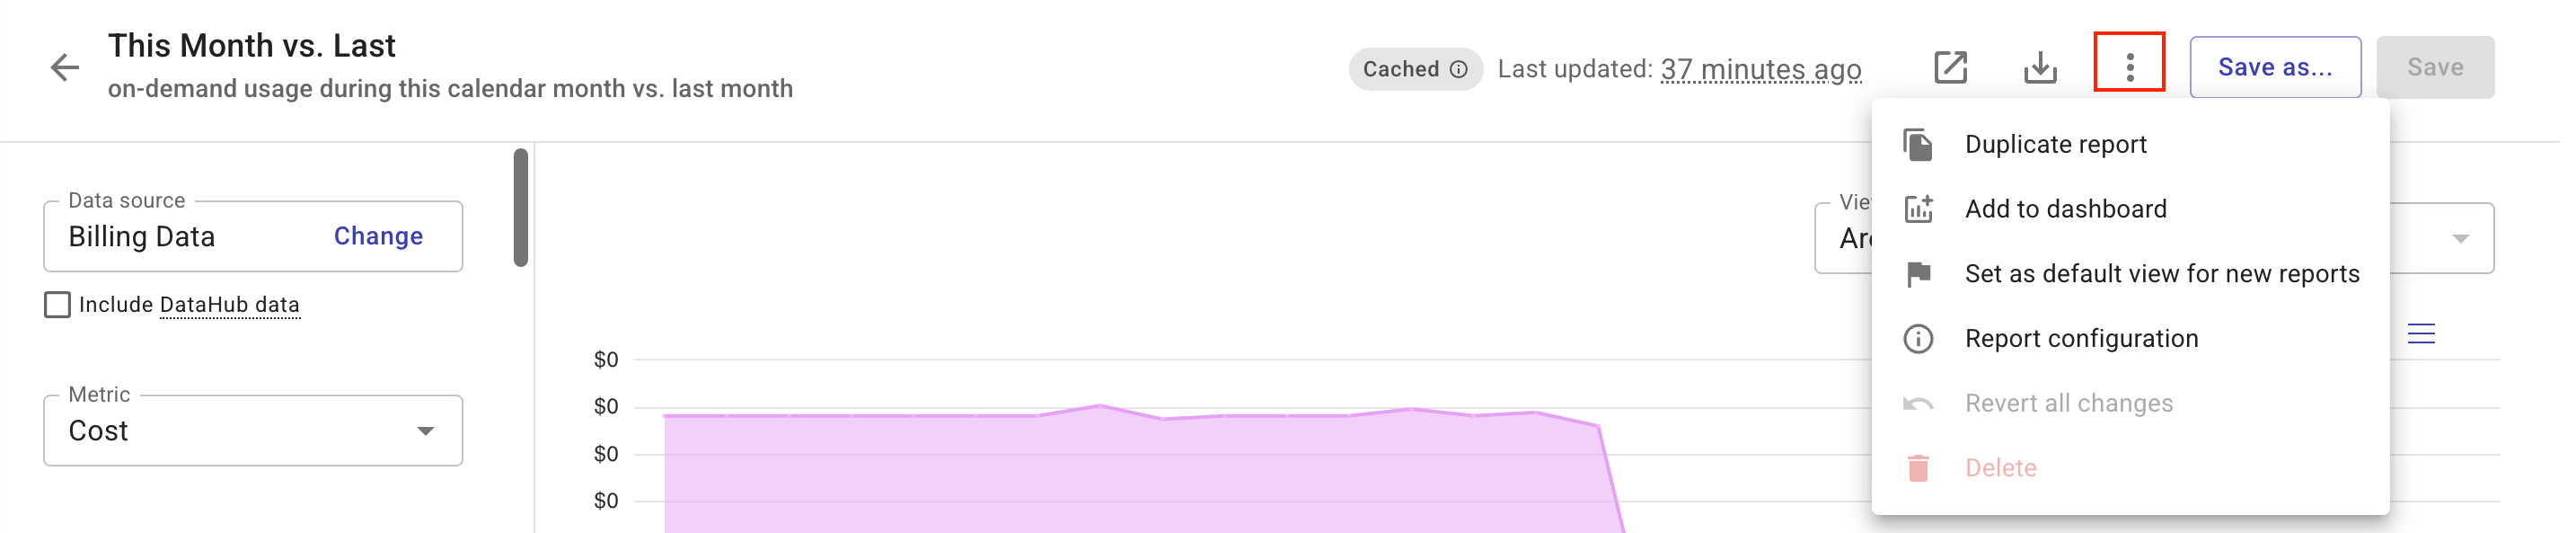
Select the kebab menu (⋮) in the report title bar, and then select Add to dashboard.
-
Select target dashboards for the report. You can also create a new dashboard to host the report.

-
Navigate to the dashboard to view the report you just added. You can customize the size and arrangement of the widgets as you see fit.
Refresh report data
Report widgets on the dashboards are updated on schedule:
-
Widgets in general are refreshed automatically every two days.
-
Due to data latency, it may take 24–72 hours for the most recent data to appear in the widgets.
-
Widgets are updated independently of each other.
You can also manually refresh widgets to get the latest data in the DoiT platform:
-
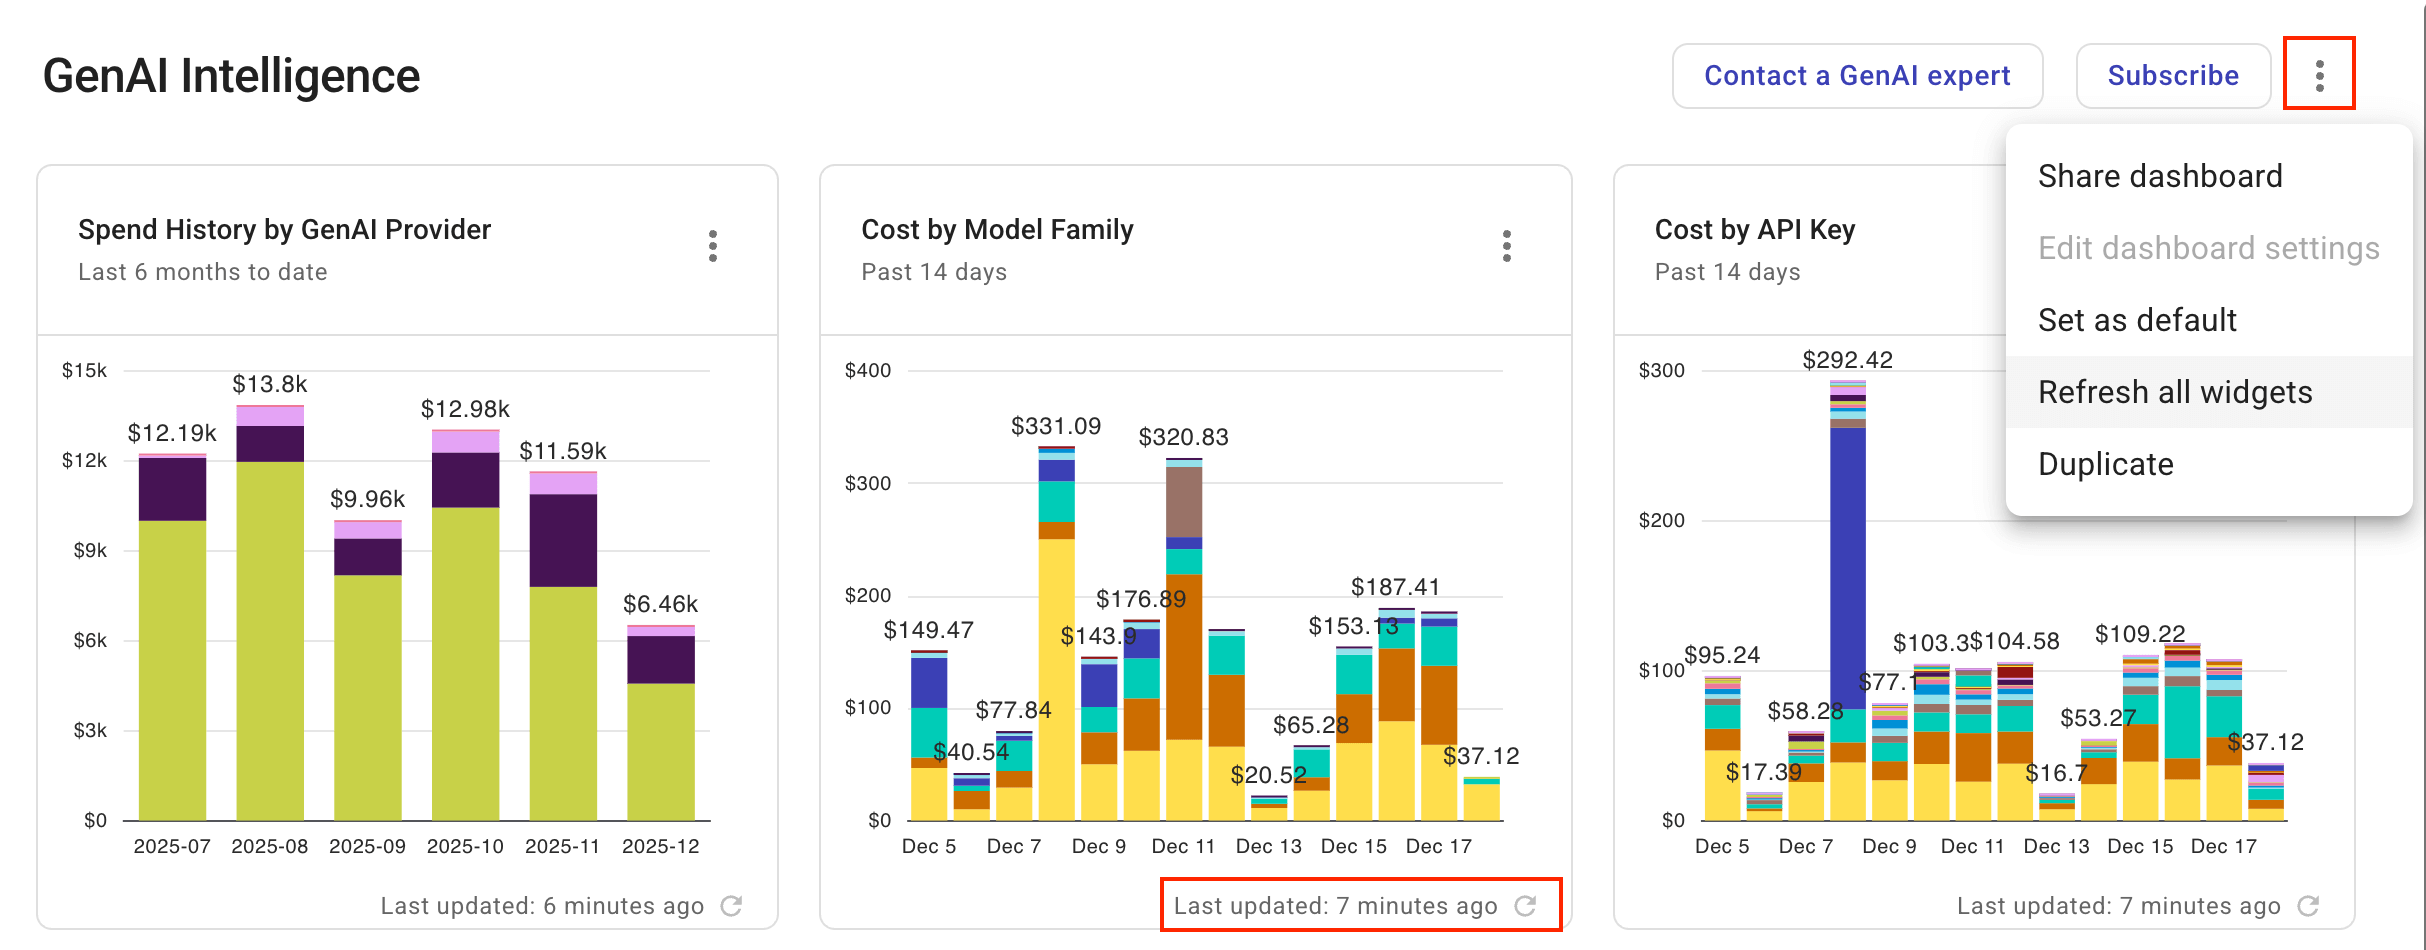
To refresh a specific widget, select the Refresh icon in the bottom-right corner of the widget.
-
To refresh all widgets, select the kebab menu (⋮) in the upper-right corner of the dashboard and then select Refresh all widgets.
The Last updated time displayed in the bottom-right corner of each widget shows when the widget was refreshed, either automatically or manually.
Note that reports on dashboards are automatically cached. See Cached reports.
Open full report
To open the report that generates the visualization of the widget, select the kebab menu (⋮) in the upper-right corner of the widget, and then select Open full report.
You can also select the report's name to open it directly.