Cloud Diagrams
DoiT Cloud Diagrams is a powerful and versatile tool that generates diagrams of your cloud infrastructure. Depending on your cloud provider, Cloud Diagrams creates one diagram for each AWS account, Google Cloud project, or Azure subscription, which allows you to visualize and analyze your resources and understand the relationships between them.
Cloud Diagrams is available to customers on all tiers. Customers subscribed to the DoiT Cloud Intelligence Essentials tier and DoiT Heritage customers can create up to two Cloud Diagrams. To create a third diagram, you must either delete one of your existing diagrams or create a new expert inquiry to upgrade to the DoiT Cloud Intelligence Enhanced or Enterprise tiers.
Read the content below or check out the ▶️ interactive demo for a visual walkthrough.
Benefits
-
View your entire infrastructure in one diagram. For each AWS account, Google Cloud project, or Azure subscription, Cloud Diagrams provides a clear overview of your current infrastructure, including resources, services, and their connections. This helps you identify potential issues or areas for improvement, avoiding any unintended consequences of any changes that you make.
-
Near real-time updates. Near real-time updates means you have immediate visibility into any changes, outages, or performance issues.
-
View your links and dependencies. Having instant visibility on the dependencies between your resources allows you to see the big picture and how different resources interact.
-
Network-level view. The network level view enables you to see how your network components are connected and configured within your cloud environment.
-
Links to objects in other accounts, projects, or subscriptions. Each diagram has dynamic links to objects in other imported cloud environments, allowing you to navigate to other resources.
-
Track and compare changes. Cloud Diagrams uses snapshots to help you compare states over time. This allows you to analyse trends and visualize changes in elements, differences in relationships, and cost variations.
-
View a history of your elements. Cloud Diagrams records every action performed in the linked AWS account, Google Cloud project, or Azure subscription related to the elements in a diagram, helping you understand how something was implemented in your cloud infrastructure. This allows you to quickly pinpoint issues, without the need to sift through complex logs or configurations, leading to faster resolutions, reduced downtime, and improved system stability.
-
Combine elements. Reduce complexity and declutter diagrams by combining elements. Combining elements enables you to focus on the overall architecture and relationships between groups of resources. For example, combine multiple S3 buckets, Cloud Storage buckets, or similar resource types into a single element.
Required permissions
To use Cloud Diagrams, your DoiT account must have the Cloud Diagram User permission.
Cloud Diagrams dashboard
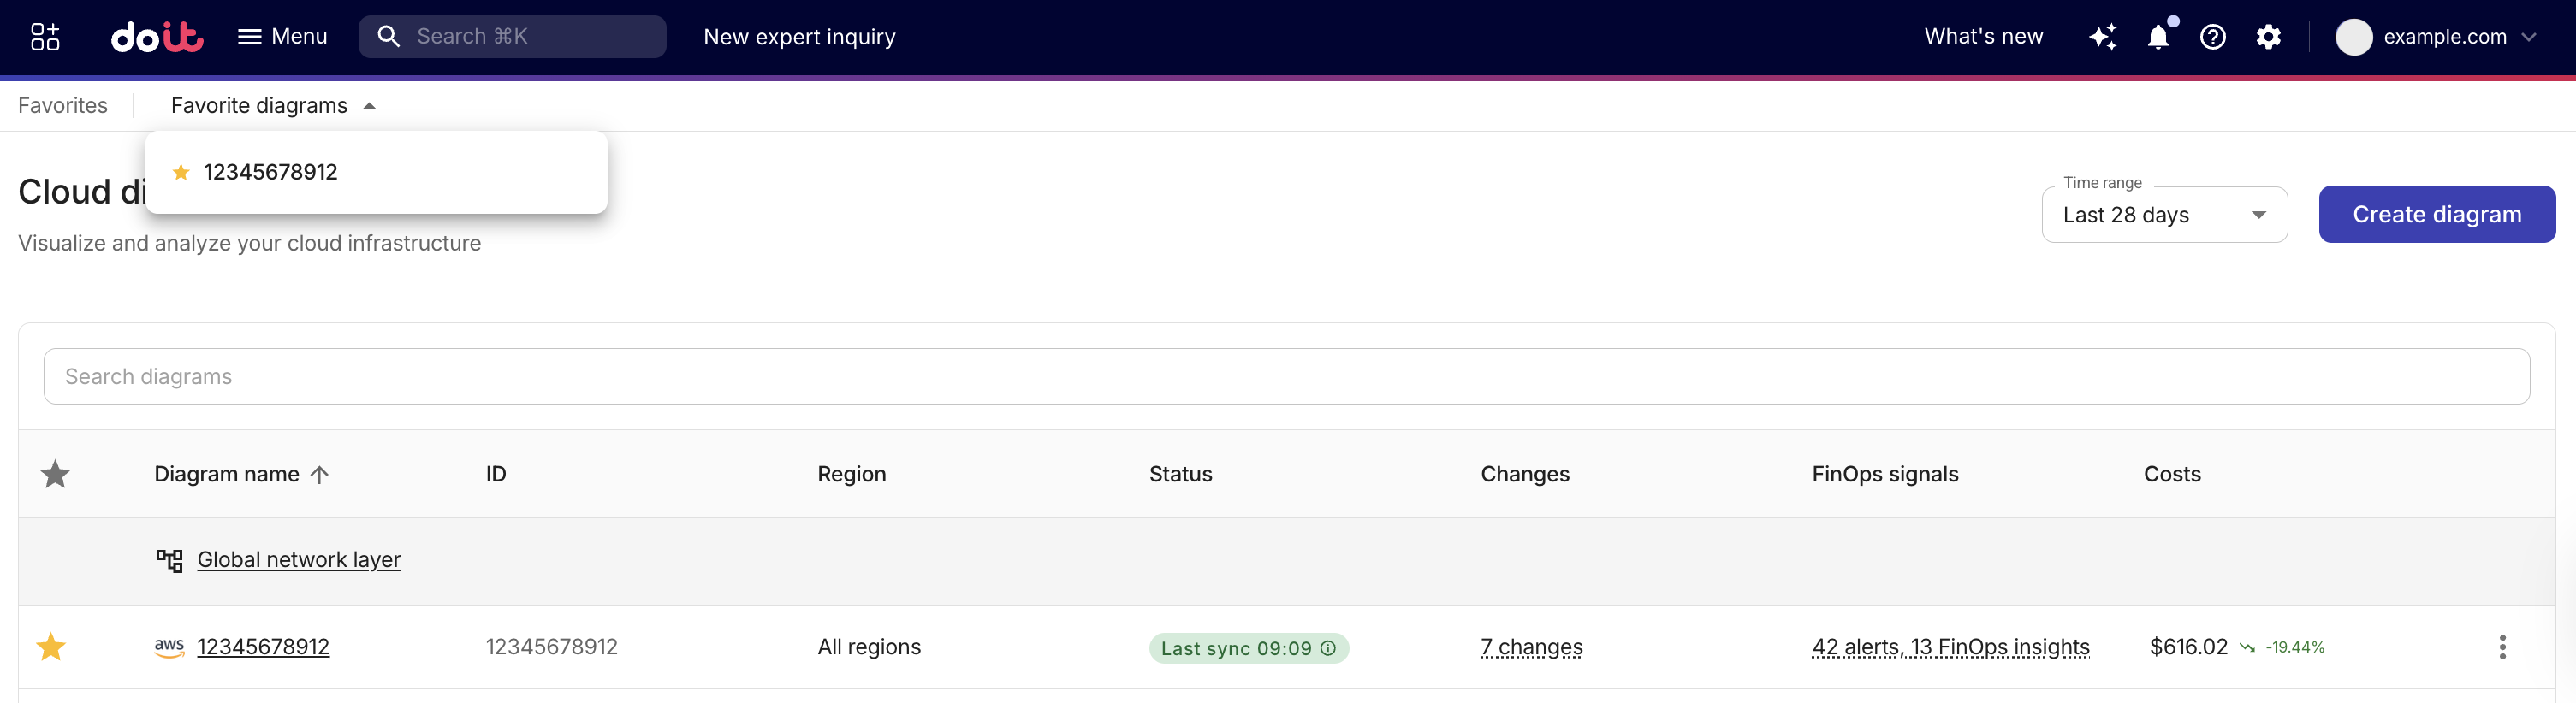
The Cloud Diagrams dashboard displays all the diagrams you have created. From the dashboard, you can create Cloud Diagrams and filter your diagrams.
In addition, you can:
-
View a Cloud Diagram. Cloud Diagrams creates one diagram for each AWS account, Google Cloud project, or Azure subscription, allowing you to visualize and analyze your resources and understand the relationships between them.
-
View global network layer. The global network layer enables you to see how your network components are connected and configured within your cloud environment, across your imported accounts, projects, and subscriptions.
-
View FinOps signals. FinOps signals gives you an at-a-glance summary of active signals for each diagram. FinOps signals are automated findings that surface when your cloud spend or usage looks unusual, risky, or worth optimizing, for example, a sudden spike in cost, breaching a budget threshold, or an inefficient resource pattern, so you can quickly see which diagrams need attention and why. Signals include Cost anomalies, Cost alerts, FinOps insights, and Security insights. Hover over the signal summary for a specific diagram to see a detailed breakdown of signal types and counts.
-
Last sync status. The dashboard displays each diagram's import status. After a successful import, a Last sync timestamp shows when the diagram data was last synchronized. If the last import failed, hover over the Error status message to display the reason.
-
Costs. The dashboard displays cost totals and trending percentages for each diagram, giving you an at-a-glance view of how spend is changing over time.
-
Favorite diagrams. To quickly find your most important diagrams, you can select the Star icon next to a diagram to mark it as a favorite. Select the Star icon again to remove it from your favorites. Favorited diagrams appear in the Favorite diagrams list available in Favorites at the top of the dashboard.
 Note
NoteFavorites are user-specific. They enable you to create a curated list of diagrams visible only to you. If you delete a diagram that is marked as a favorite, it is automatically removed from your favorites.
To access the dashboard, sign in to the DoiT console, select Automation and operations from the top navigation mega menu, and then select Cloud Diagrams.
Supported services
- Supported AWS services
- Supported Google Cloud services
- Supported Azure services
- API Gateway
- Application Load Balancer (ALB)
- Classic Load Balancer (CLB)
- CloudFront
- Core Network
- Customer Gateway
- Data Firehose
- Database Migration Service
- DocumentDB
- DynamoDB
- Elastic Block Store (EBS) (as props of EC2)
- Elastic Compute Cloud (EC2)
- Elastic Container Service (ECS)
- Elastic File System (EFS)
- Elastic Kubernetes Service (EKS) (aws/kube API, access needs to be granted for each cluster)
- ElastiCache
- Event bus
- Internet Gateway
- Kinesis
- Kinesis Data Stream
- Lambda
- Network Address Translation (NAT) Gateway
- Network Load Balancer (NLB)
- Opensearch/Elasticsearch
- Redshift
- Relational Database Service (RDS)
- Route53
- S3/Glacier
- Security groups
- Simple notification service (SNS)
- Simple queue service (SQS)
- Subnet
- Transit Gateway
- Virtual Private Cloud (VPC)
- Virtual Private Cloud (VPC) peering connection
- Virtual Private Gateway (VPN)
- Virtual Private Network (VPN) connection
- Artifact Registry Docker Image
- Artifact Registry Repository
- Backend bucket
- Backend service
- BigQuery dataset
- Cloud Router
- Database Migration Service
- Eventarc trigger
- External network
- Instance group
- Kubernetes cluster (GKE cluster)
- Kubernetes namespace
- Node pool (Kubernetes node pool)
- Private Service Access
- Project
- Region
- Service accounts
- Subnetwork
- VPC Access Connector
- VPC network
- VPC network peering (Peering connection)
- Zone
- AKS Cluster
- Azure Cache for Redis
- Azure Database for PostgreSQL
- Azure Managed Redis
- Azure SQL Database
- Backend Pool
- CDN
- Compute VM
- Container Registry
- Container Registry Repository
- Cosmos DB
- DNS Record
- DNS Zone
- Function
- K8S Namespace
- Key Vault
- Load Balancer
- Local Network Gateway
- Managed Disk
- Managed Identity
- Resource Group
- Service Bus
- Service Bus Queue
- Service Bus Subscription
- Service Bus Topic
- Sites
- Storage Account
- Subnet
- Subscription
- Virtual Network
- VNet Peering Connection
- VPN Connection
- VPN Gateway
▶️ Interactive demo
Try out our interactive demo for a hands-on walk-through experience.
If the demo doesn't display properly, try expanding your browser window or opening the demo in a new tab.