Multi-metric reports
Having multiple metrics in the same report helps you put data into context without having to switch between multiple reports.
Limitations
-
You can add up to four metrics per report, with any combination of basic metrics, custom metrics, and extended metrics.
-
The following options are not available for multi-metric reports:
-
View as: Heatmap, Row heatmap, Col heatmap, Treemap, and Sankey chart
Example reports
Below are examples that demonstrate the typical use of multi-metric reports.
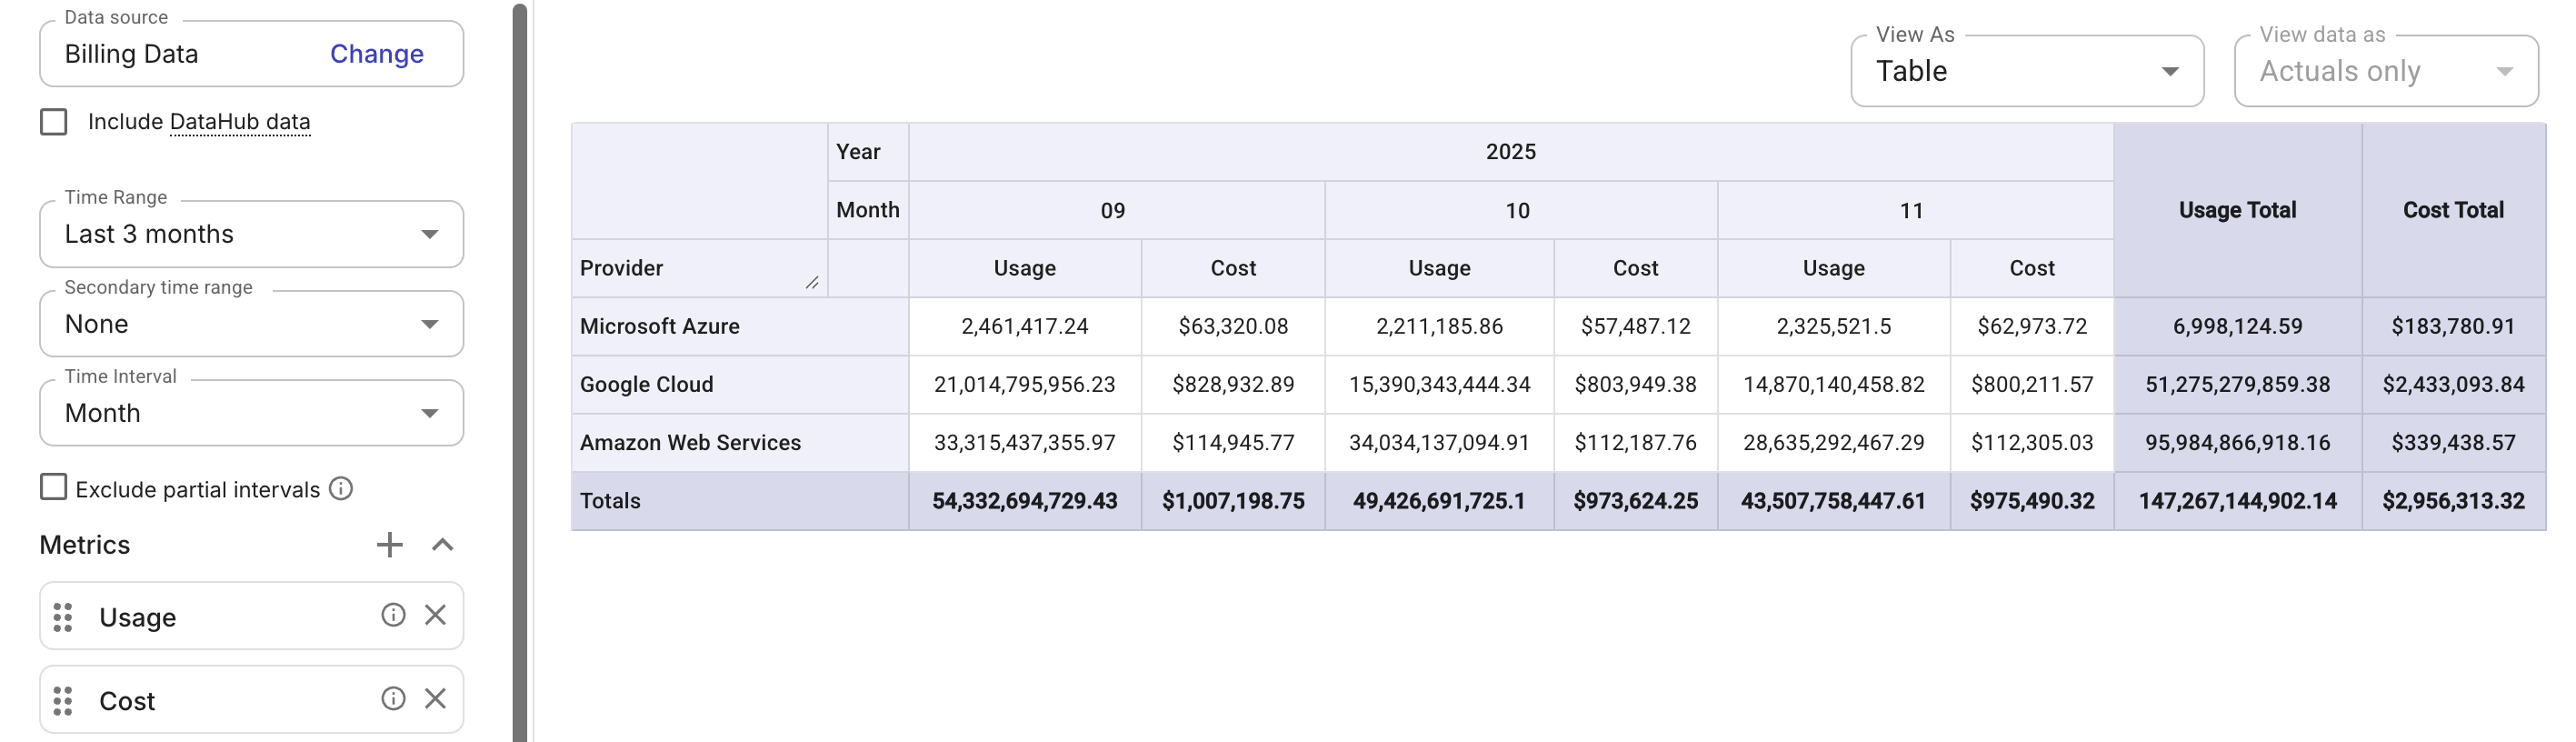
Usage and Cost
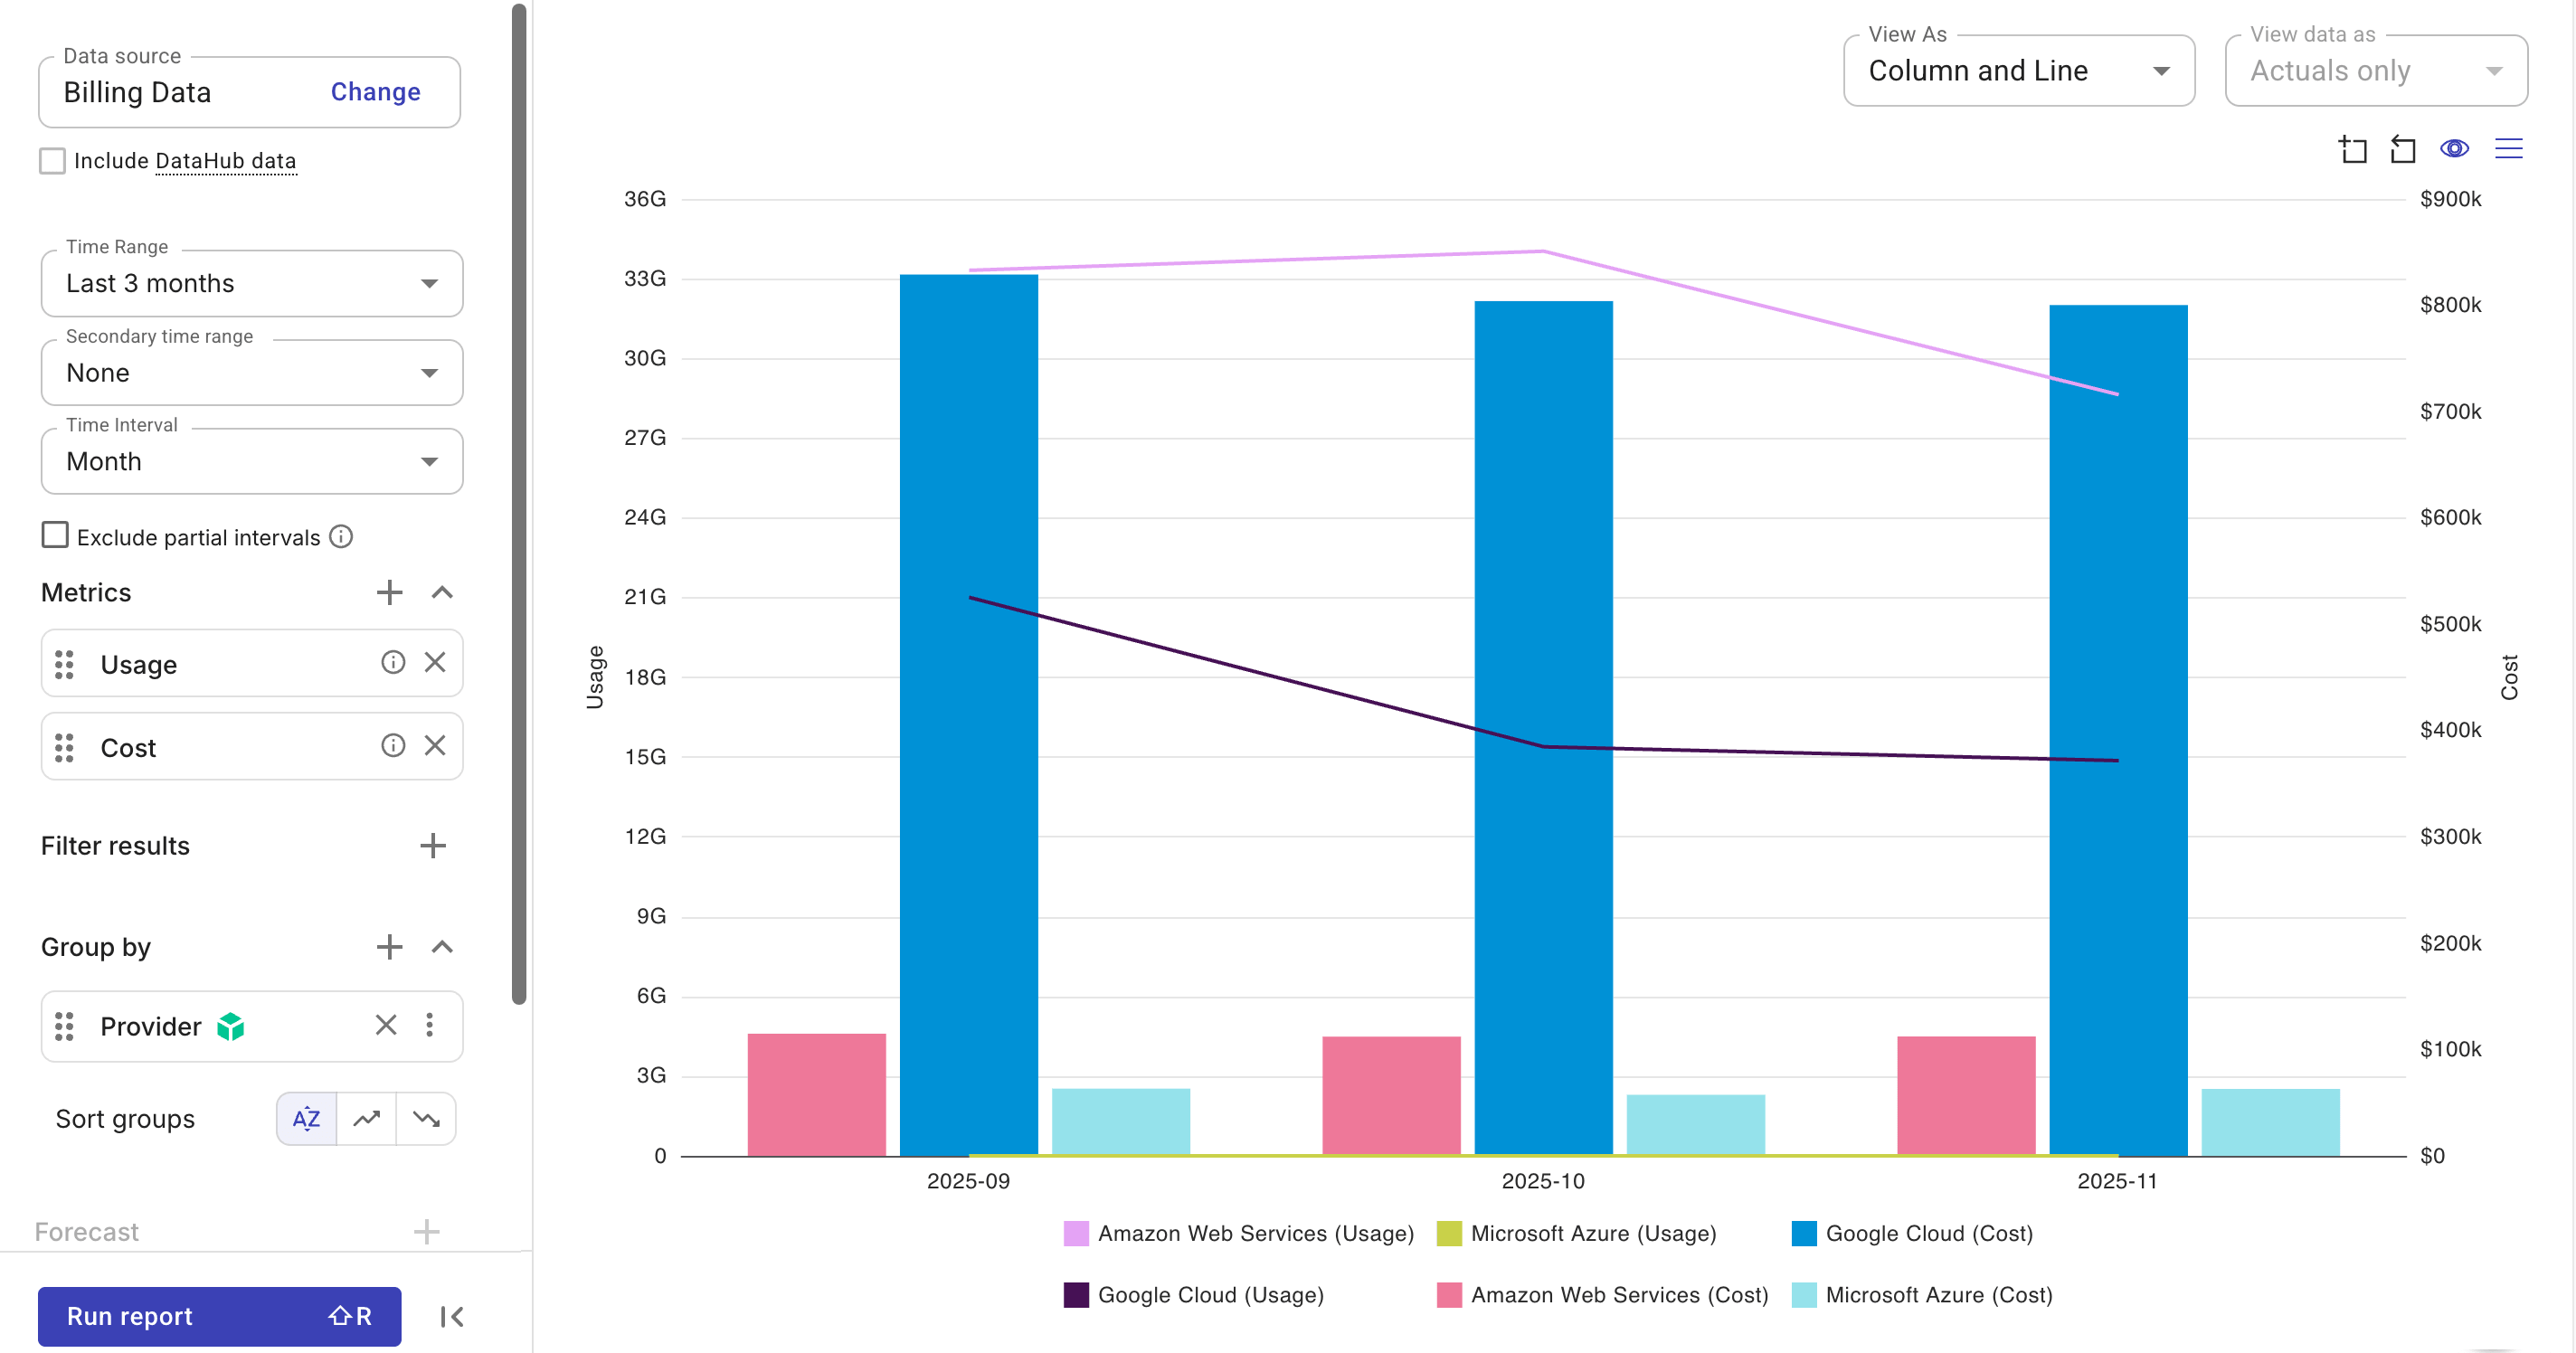
This example uses two basic metrics, Usage and Cost, to help you understand how consumption translates into financial impact.
You can also switch to the Column and Line view for a more intuitive visualization of relationships and trends between metrics.
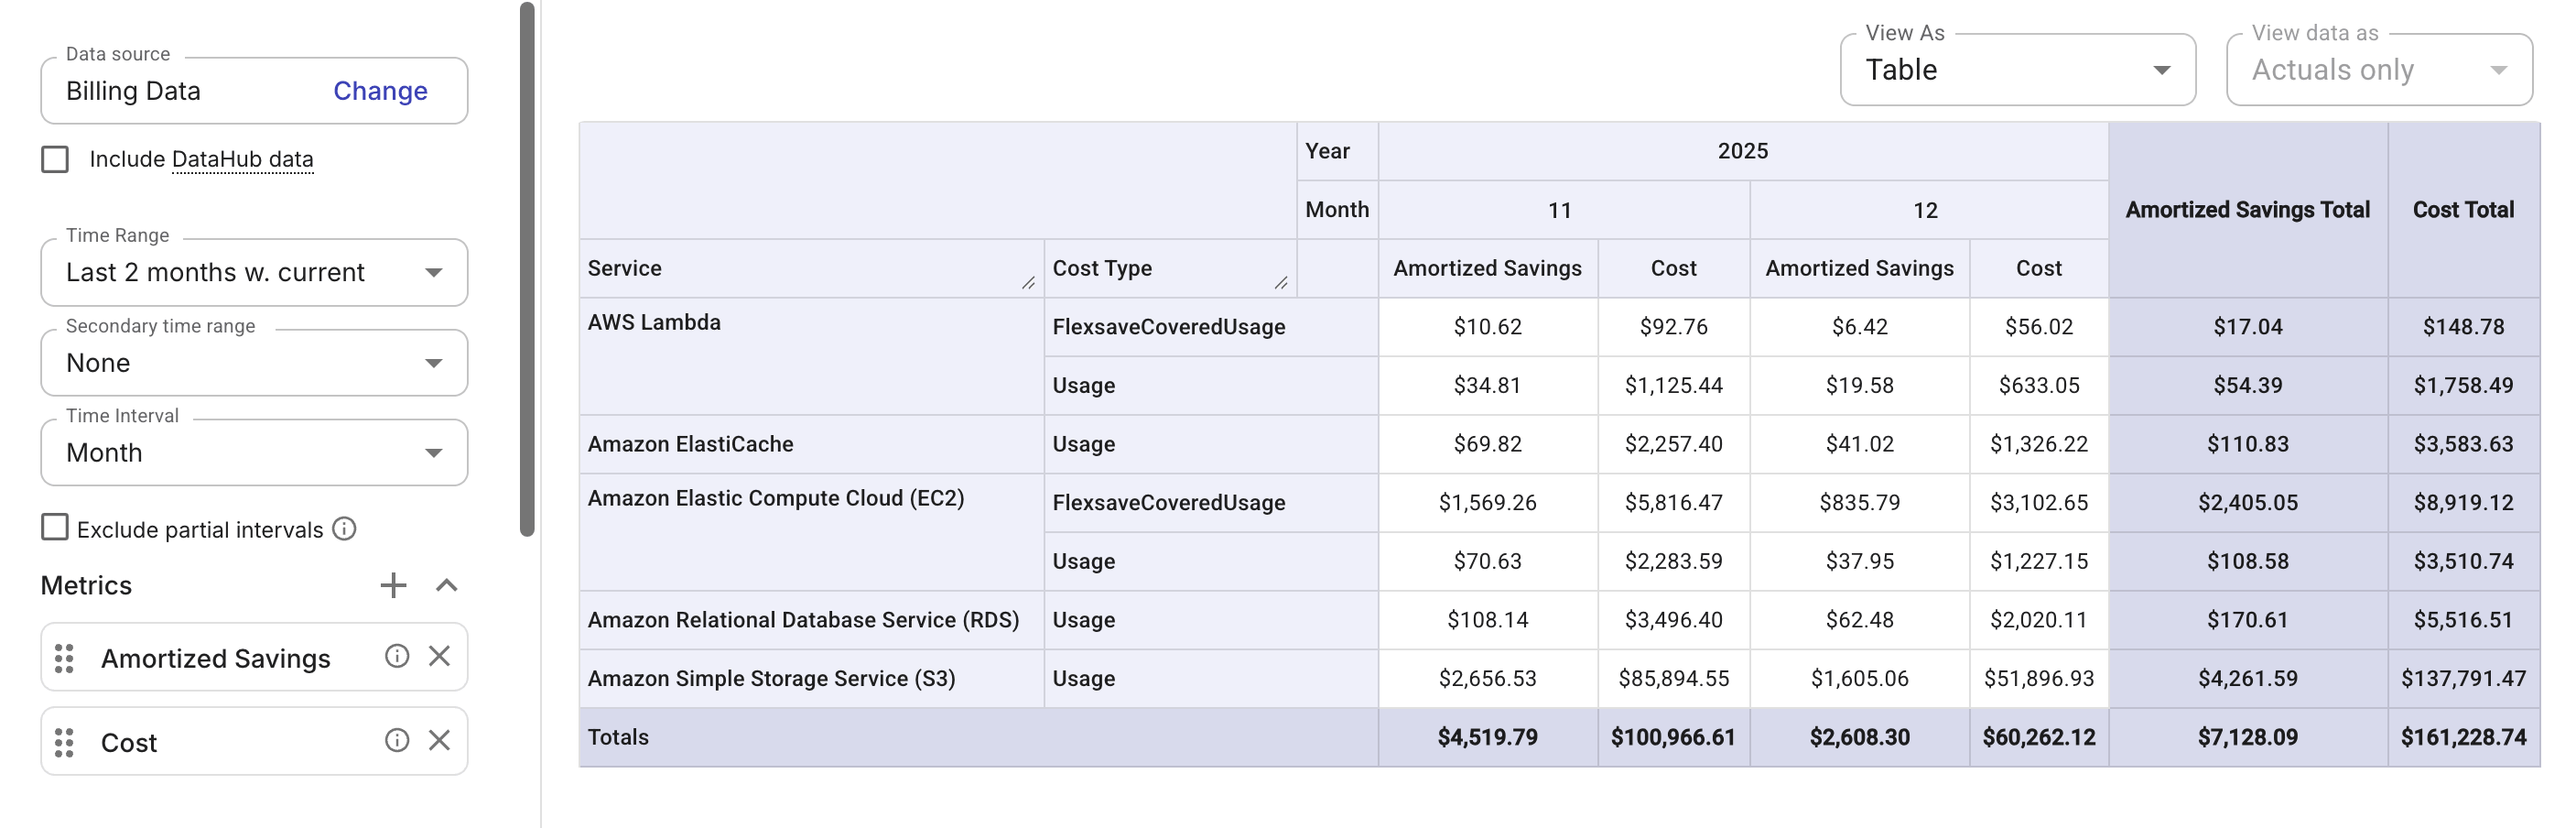
Amortized savings and Cost
This example uses the extended metric Amortized savings and the basic metric Cost to show AWS amortized data alongside the cost from billing data.
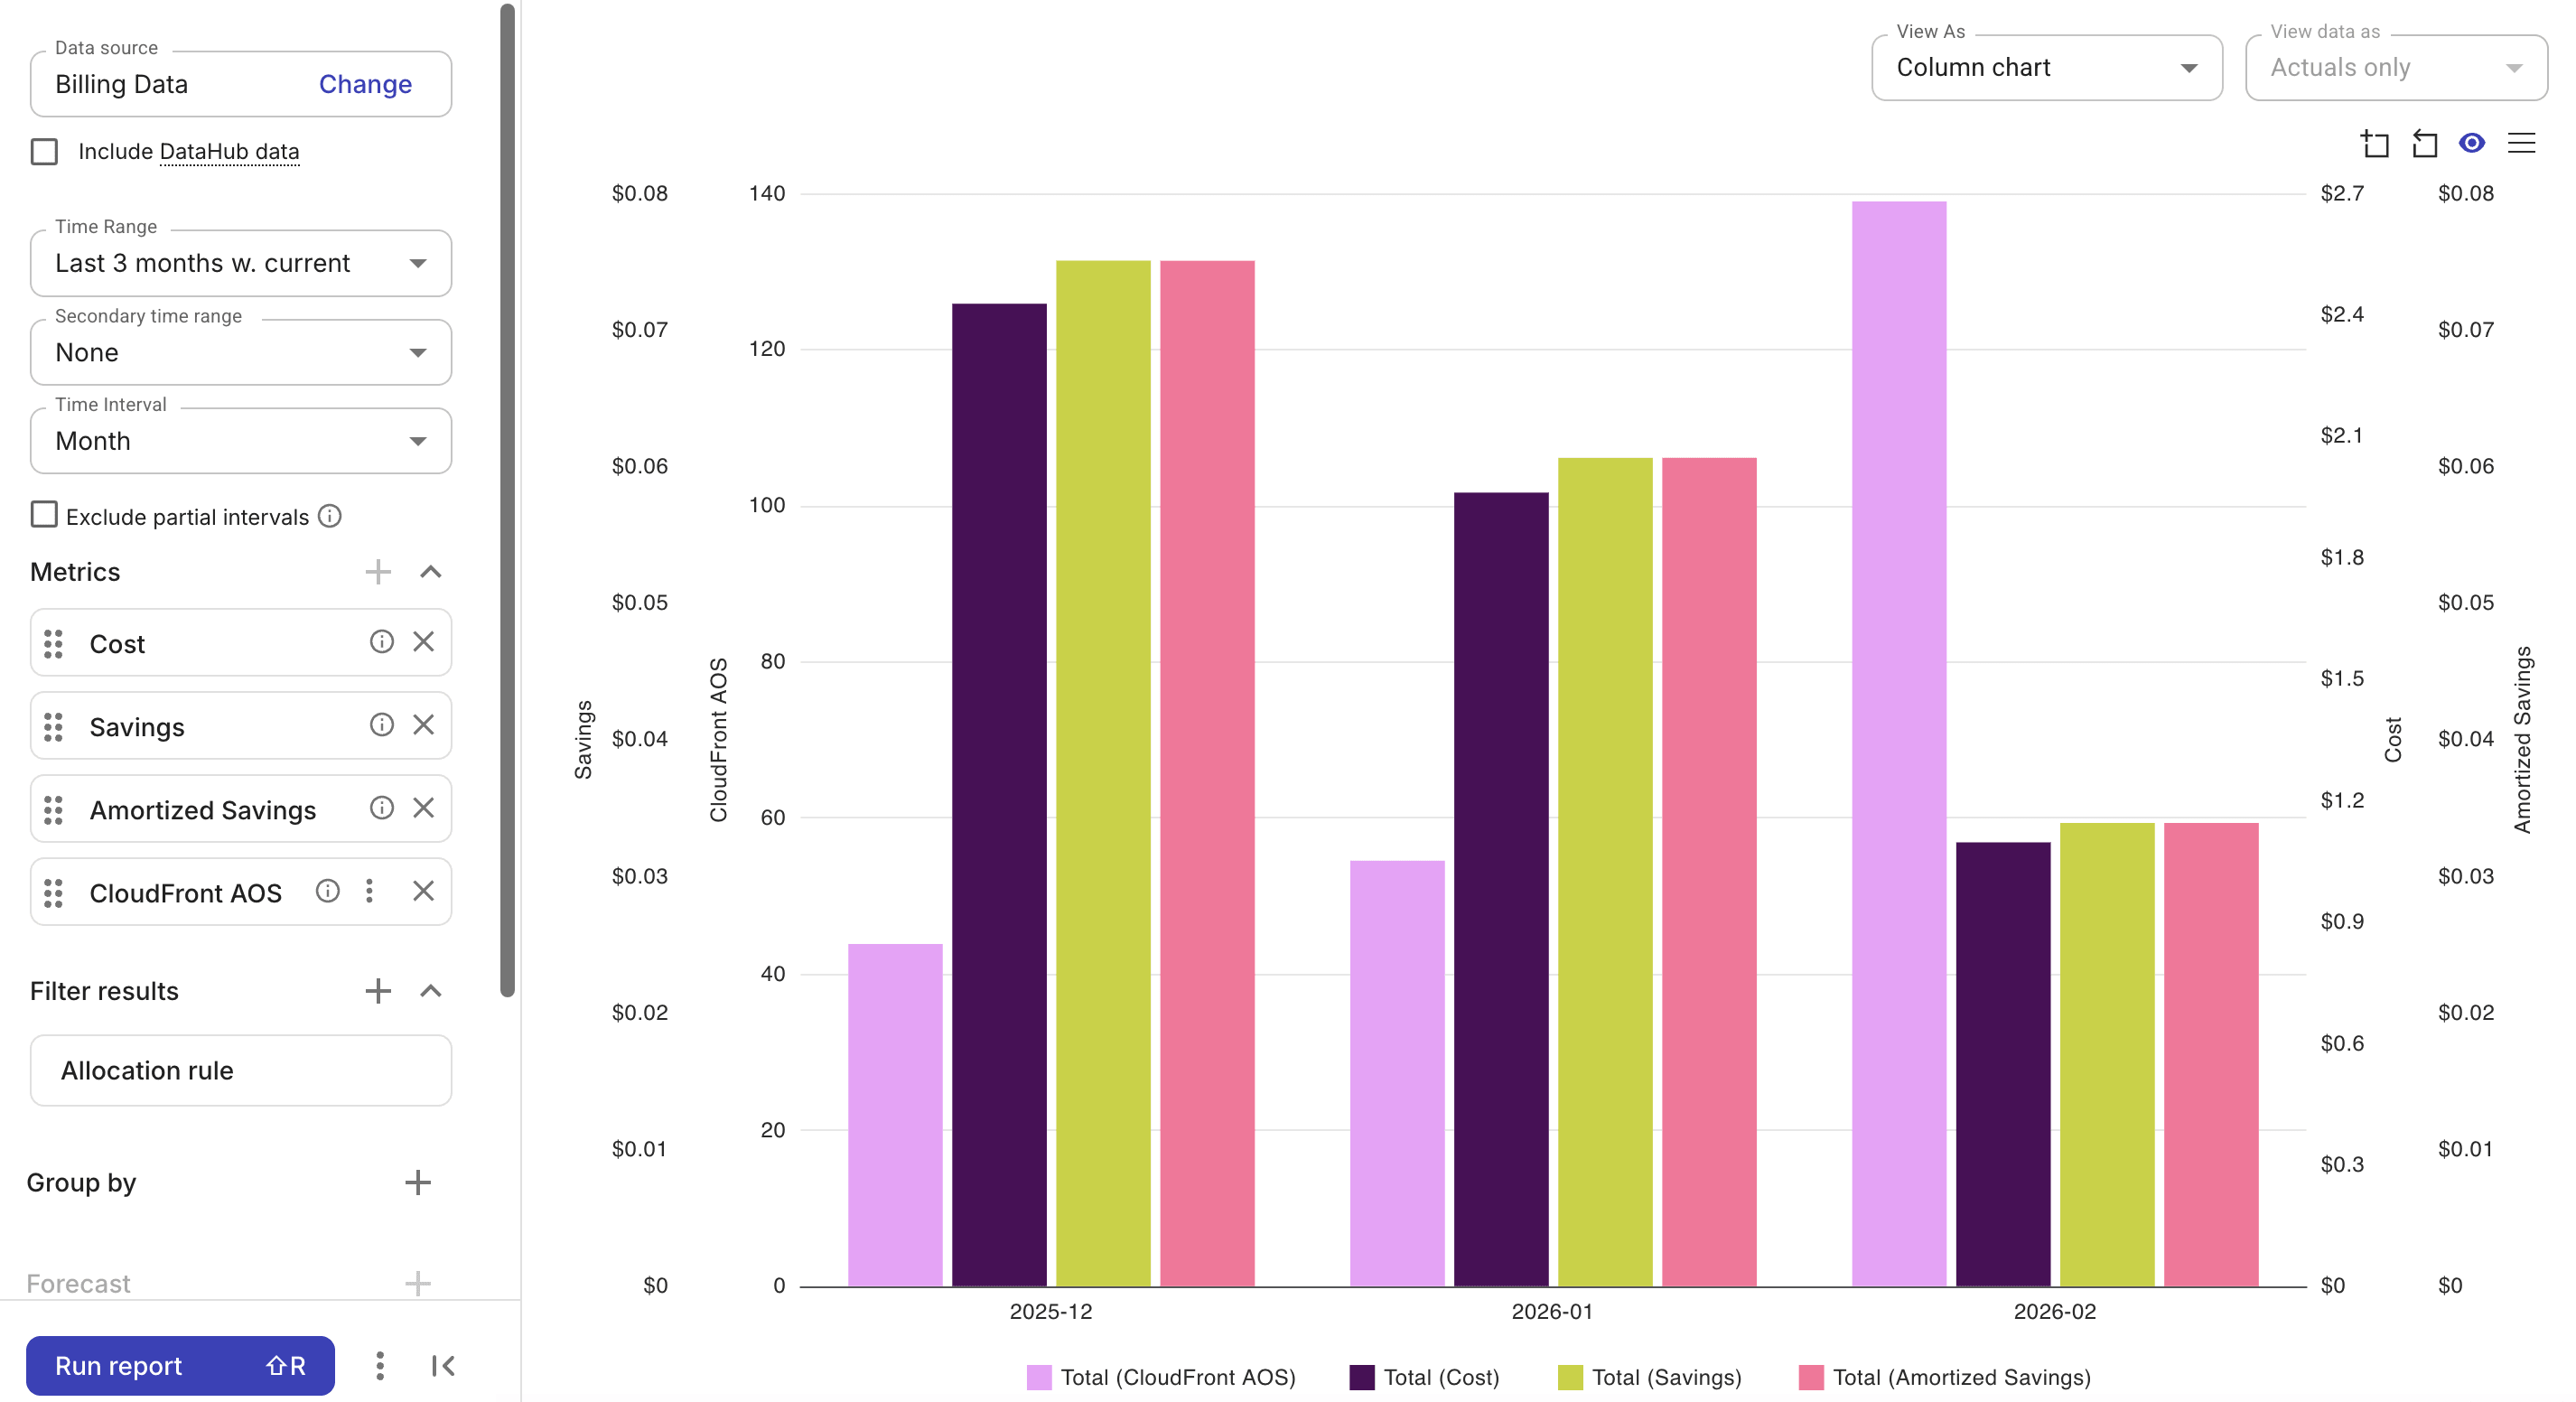
Custom metric
This example combines three types of metrics: a custom metric—CloudFront AOS, two basic metrics—Cost, Savings, and an extended metric—Amortized savings.
The allocation rule that defines the custom metric is automatically applied to the report when the metric is added (and removed only when the custom metric is removed). A report with multiple custom metrics filters on the union of allocation rules required by each custom metric.