Visualize with Grafana Cloud
Grafana is a multi-platform open source analytics and monitoring solution. If you're using Grafana for observability, adding DoiT Reports API endpoints as a data source can help you get a single pane of glass that presents events, cloud costs, and alerts.
This tutorial demonstrates how to visualize data from DoiT Reports API in a Grafana dashboard.
Prerequisites
-
You have a valid DoiT API token.
-
You have a Grafana Cloud account and are familiar with Grafana visualization.
Objectives
In this tutorial, you'll learn how to:
-
Add your DoiT API key to a Grafana dashboard.
-
Find the resource ID of your Cloud Analytics report.
-
Use the Infinity data source plugin to visualize JSON data.
This tutorial uses the preset Cost by Top AWS Accounts report as an example.
Step 1: Set up your Grafana dashboard
-
Add a new dashboard in Grafana Cloud.
-
Install the Infinity data source plugin for Grafana.
-
Add a custom variable. Name the variable as
doit_api_key, set its value toBearer {YOUR_DOIT_API_KEY}.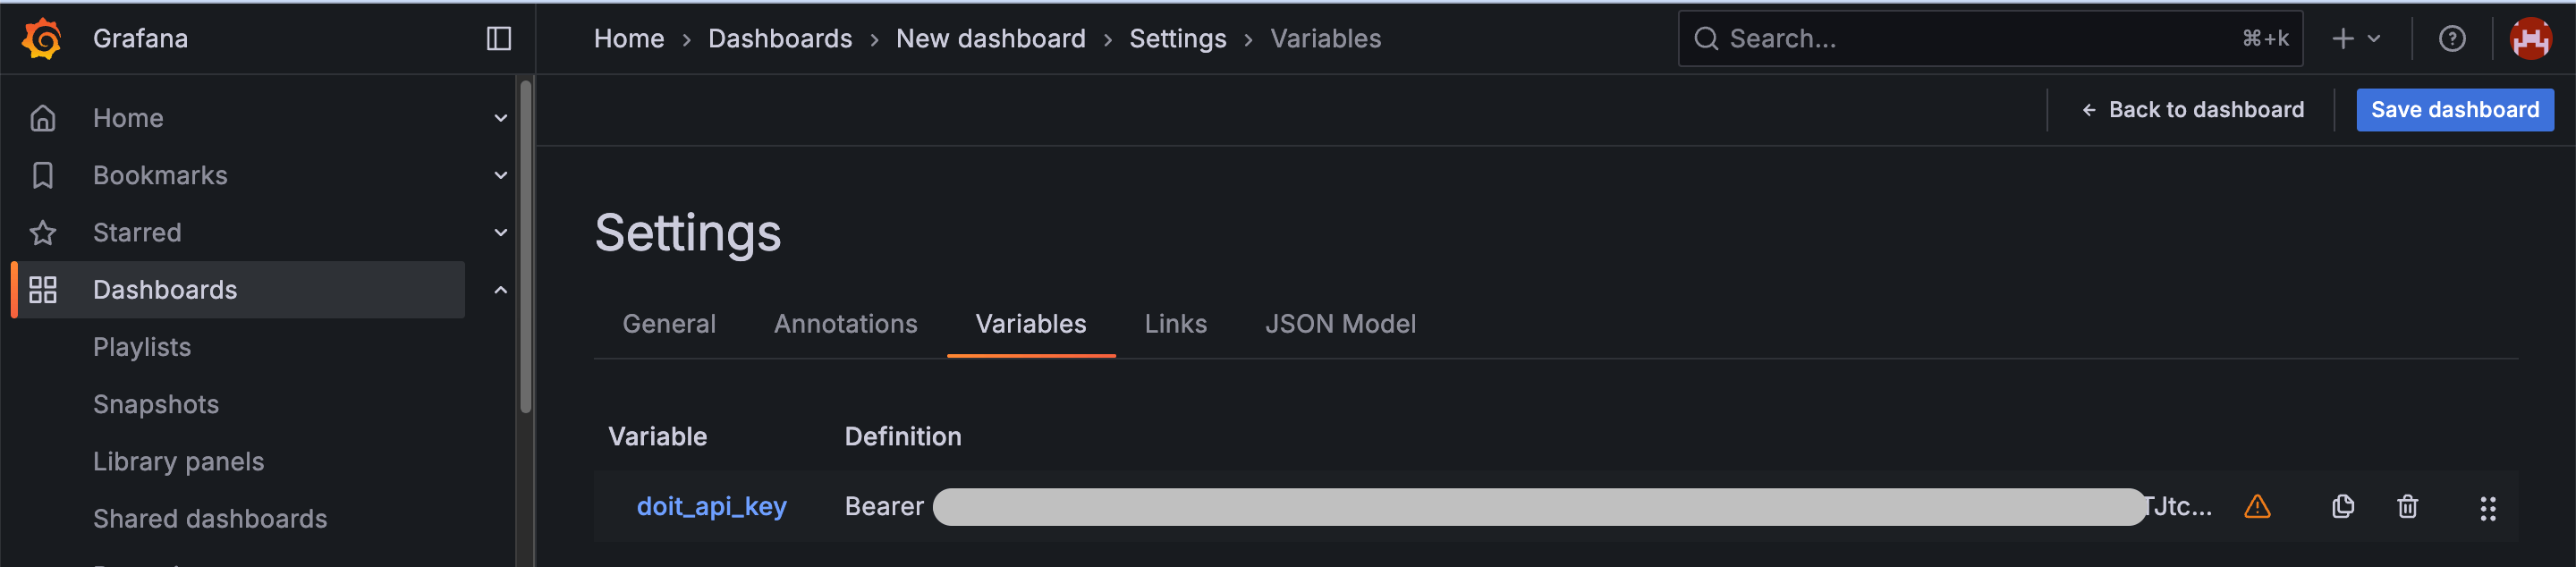
Step 2: Get the resource ID of the report
-
Sign in to the DoiT console.
-
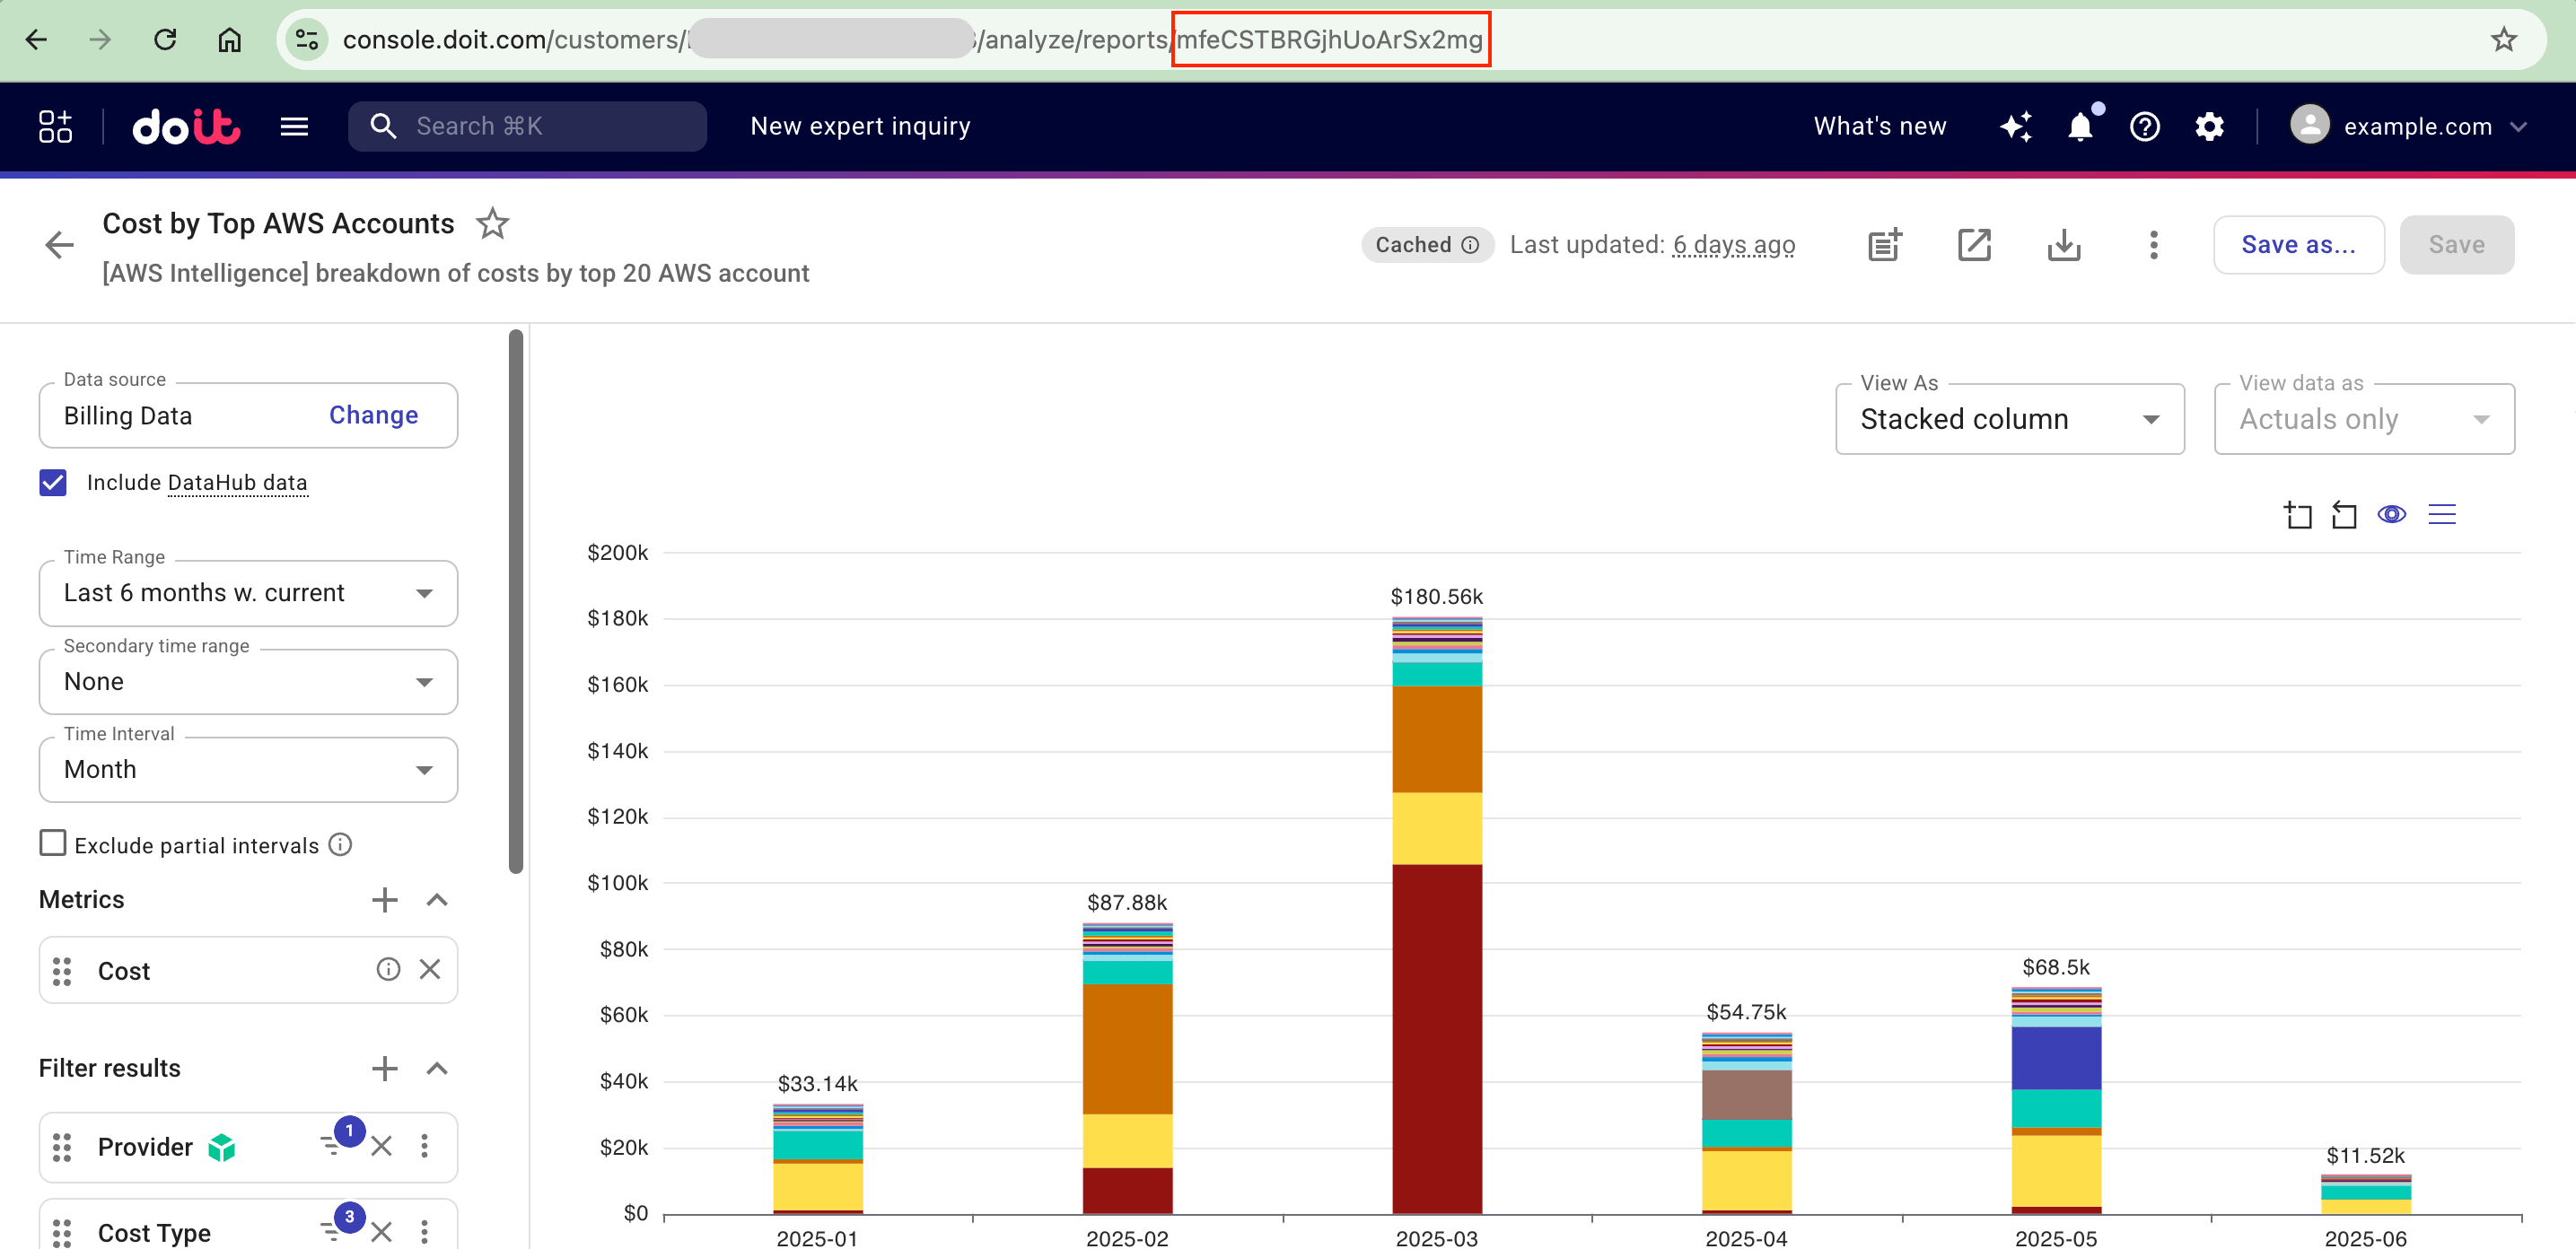
Navigate to the AWS Intelligence dashboard, find the Cost by Top AWS Accounts widget and open the full report.
-
Note down the last segment of the URL, which is resource ID of the current report.
-
(Optional) Check the format of the report data returned by the DoiT API.
-
Sign in to the DoiT Developer Hub.
-
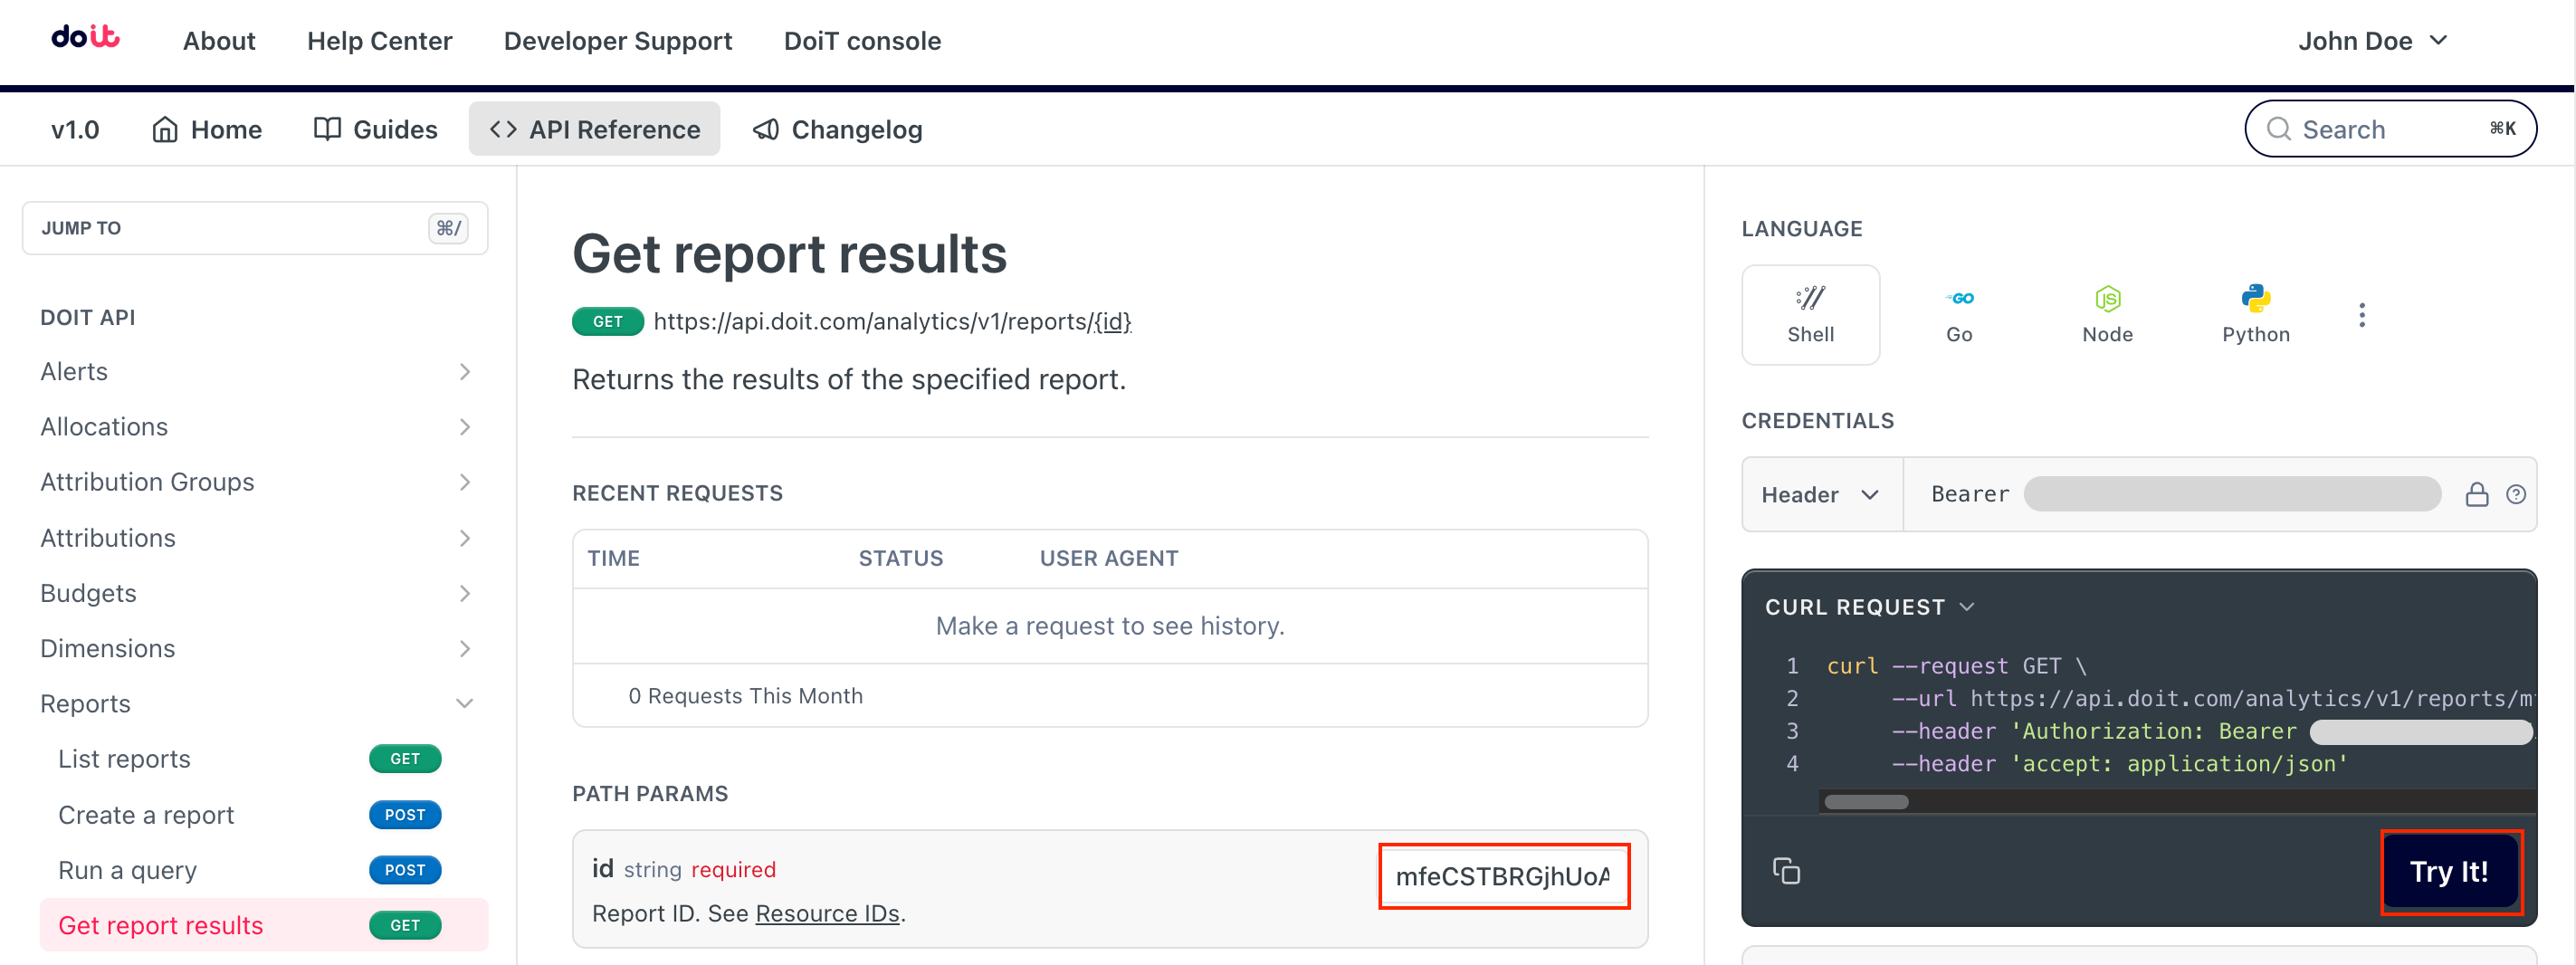
Go to the Get report results API reference page.
-
Enter the resource ID as the path parameter. Select Try it to run the API request.
-
Review the response.
Get report results: Example response
The result object in the JSON response body contains two items important for the query and conversion:
-
schema: The metadata about the data structure.
-
rows: The data itself.
"result": {
  "schema": [
    {
      "name": "project_id",
      "type": "string"
    },
    {
      "name": "year",
      "type": "string"
    },
    {
      "name": "month",
      "type": "string"
    },
    {
      "name": "cost",
      "type": "float"
    },
    {
      "name": "timestamp",
      "type": "timestamp"
    }
  ],
  "rows": [
    [
      "123123123123",
      "2025",
      "04",
      99.10132309182815,
      1743465600
    ],
    [
      "456456456",
      "2025",
      "02",
      620.7188140879603,
      1738368000
    ],
... -
Step 3: Add a panel in the Grafana dashboard
-
Add a new panel in your dashboard.
-
Configure the panel, select grafanacloud-infinity as the data source.
-
Specify the panel settings: Type:
JSON; Parser:UQL; Source:URL; Format:Time Series.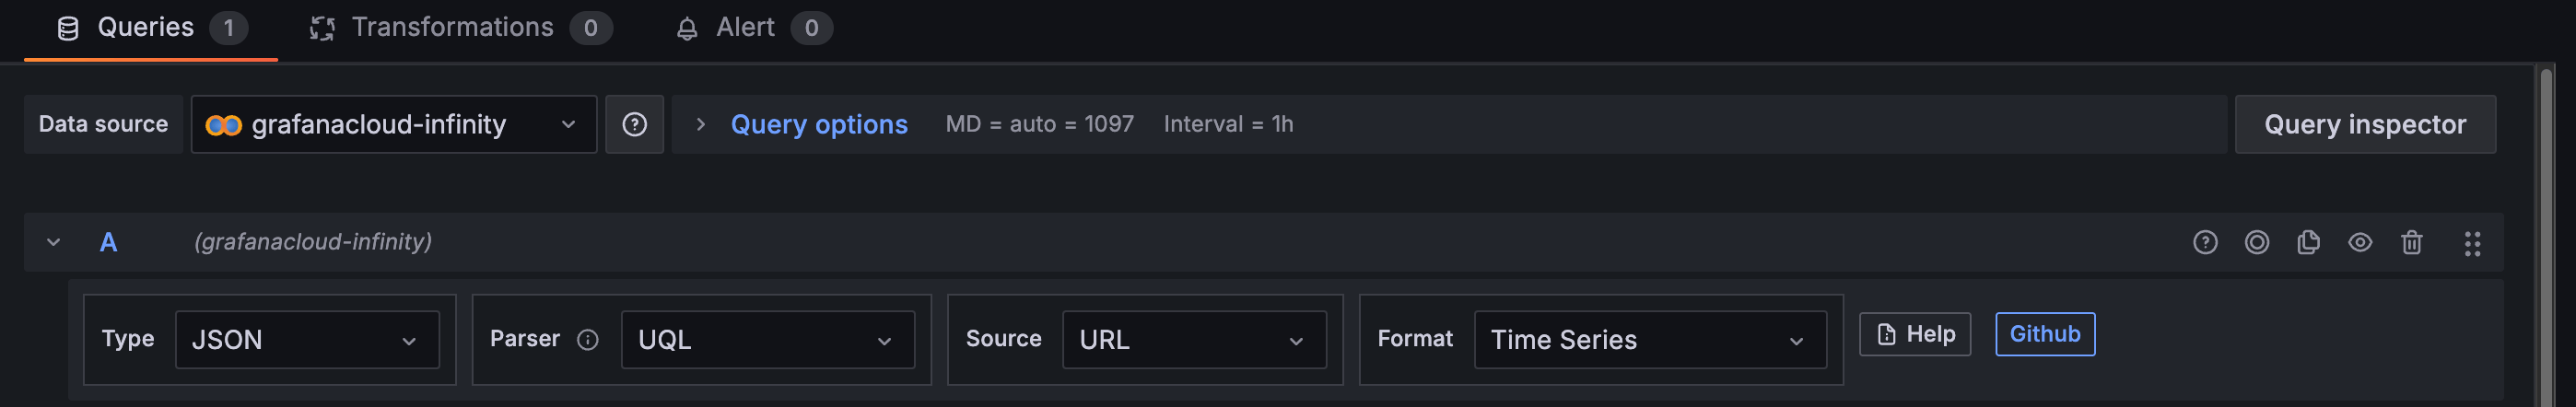
-
Configure the API endpoint.
-
Method:
GET; URL:https://api.doit.com/analytics/v1/reports/{id} -
HTTP Headers: In the URL options, add an HTTP header: Key:
Authorization; Value:$doit_api_key.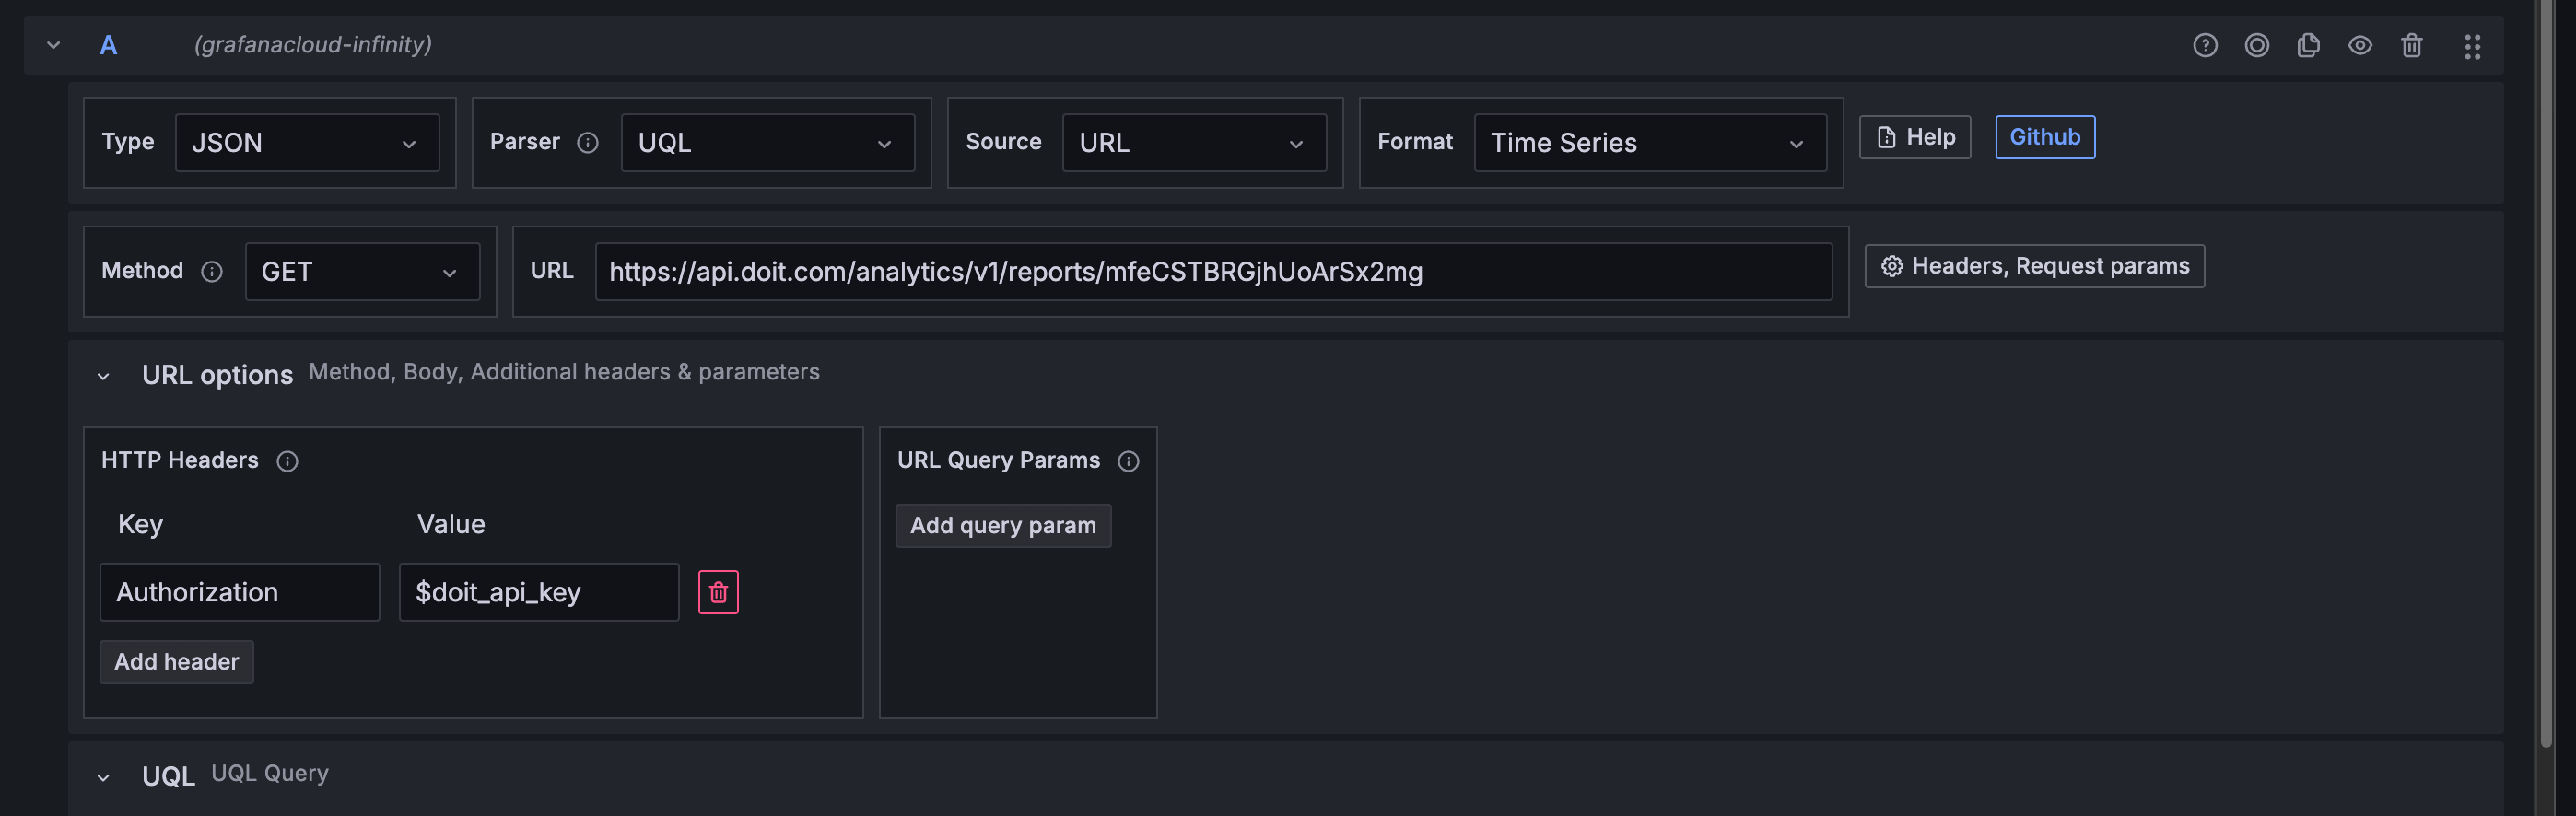
-
Step 4: Query and visualize data
In the panel configuration:
-
Add a UQL query to convert the returned JSON data to a format suitable for Grafana visualization.
TipThe UQL query below is based on the JSON schema of the preset Cost by Top AWS Accounts report. To visualize data with a different schema, it's necessary to inspect the returned JSON so that you can construct a proper query. The JSONata Exerciser is handy for such purposes.
parse-json
| jsonata "$map( $distinct($map($.result.rows, function($r) { $r[-1] })), function ($ts) { $merge([ { 'timestamp': $ts }, $merge($map($filter($.result.rows, function($r) { $r[-1] = $ts }), function($r) { $map( [ $merge($map($r, function($v, $i) { { $.result.schema[$i].name: $v } })) ], function($o) { { $o.project_id: $o.cost } })[0] })) ]) })"
| extend "timestamp"=unixtime_seconds_todatetime("timestamp")
The
jsonataexpression in the UQL query uses the$.result.schemato get the column names. In this example there are columns calledproject_id,cost, andtimestamp.As Grafana doesn't stack bars if there are rows with duplicate timestamps, the query performs the following actions to ensure that there is only a single row for each timestamp:
-
Identify all unique timestamps.
-
For each unique timestamp, find all rows that share the timestamp, extract the
project_idandcostof each row and then group theproject_id: costpairs under the timestamp.
-
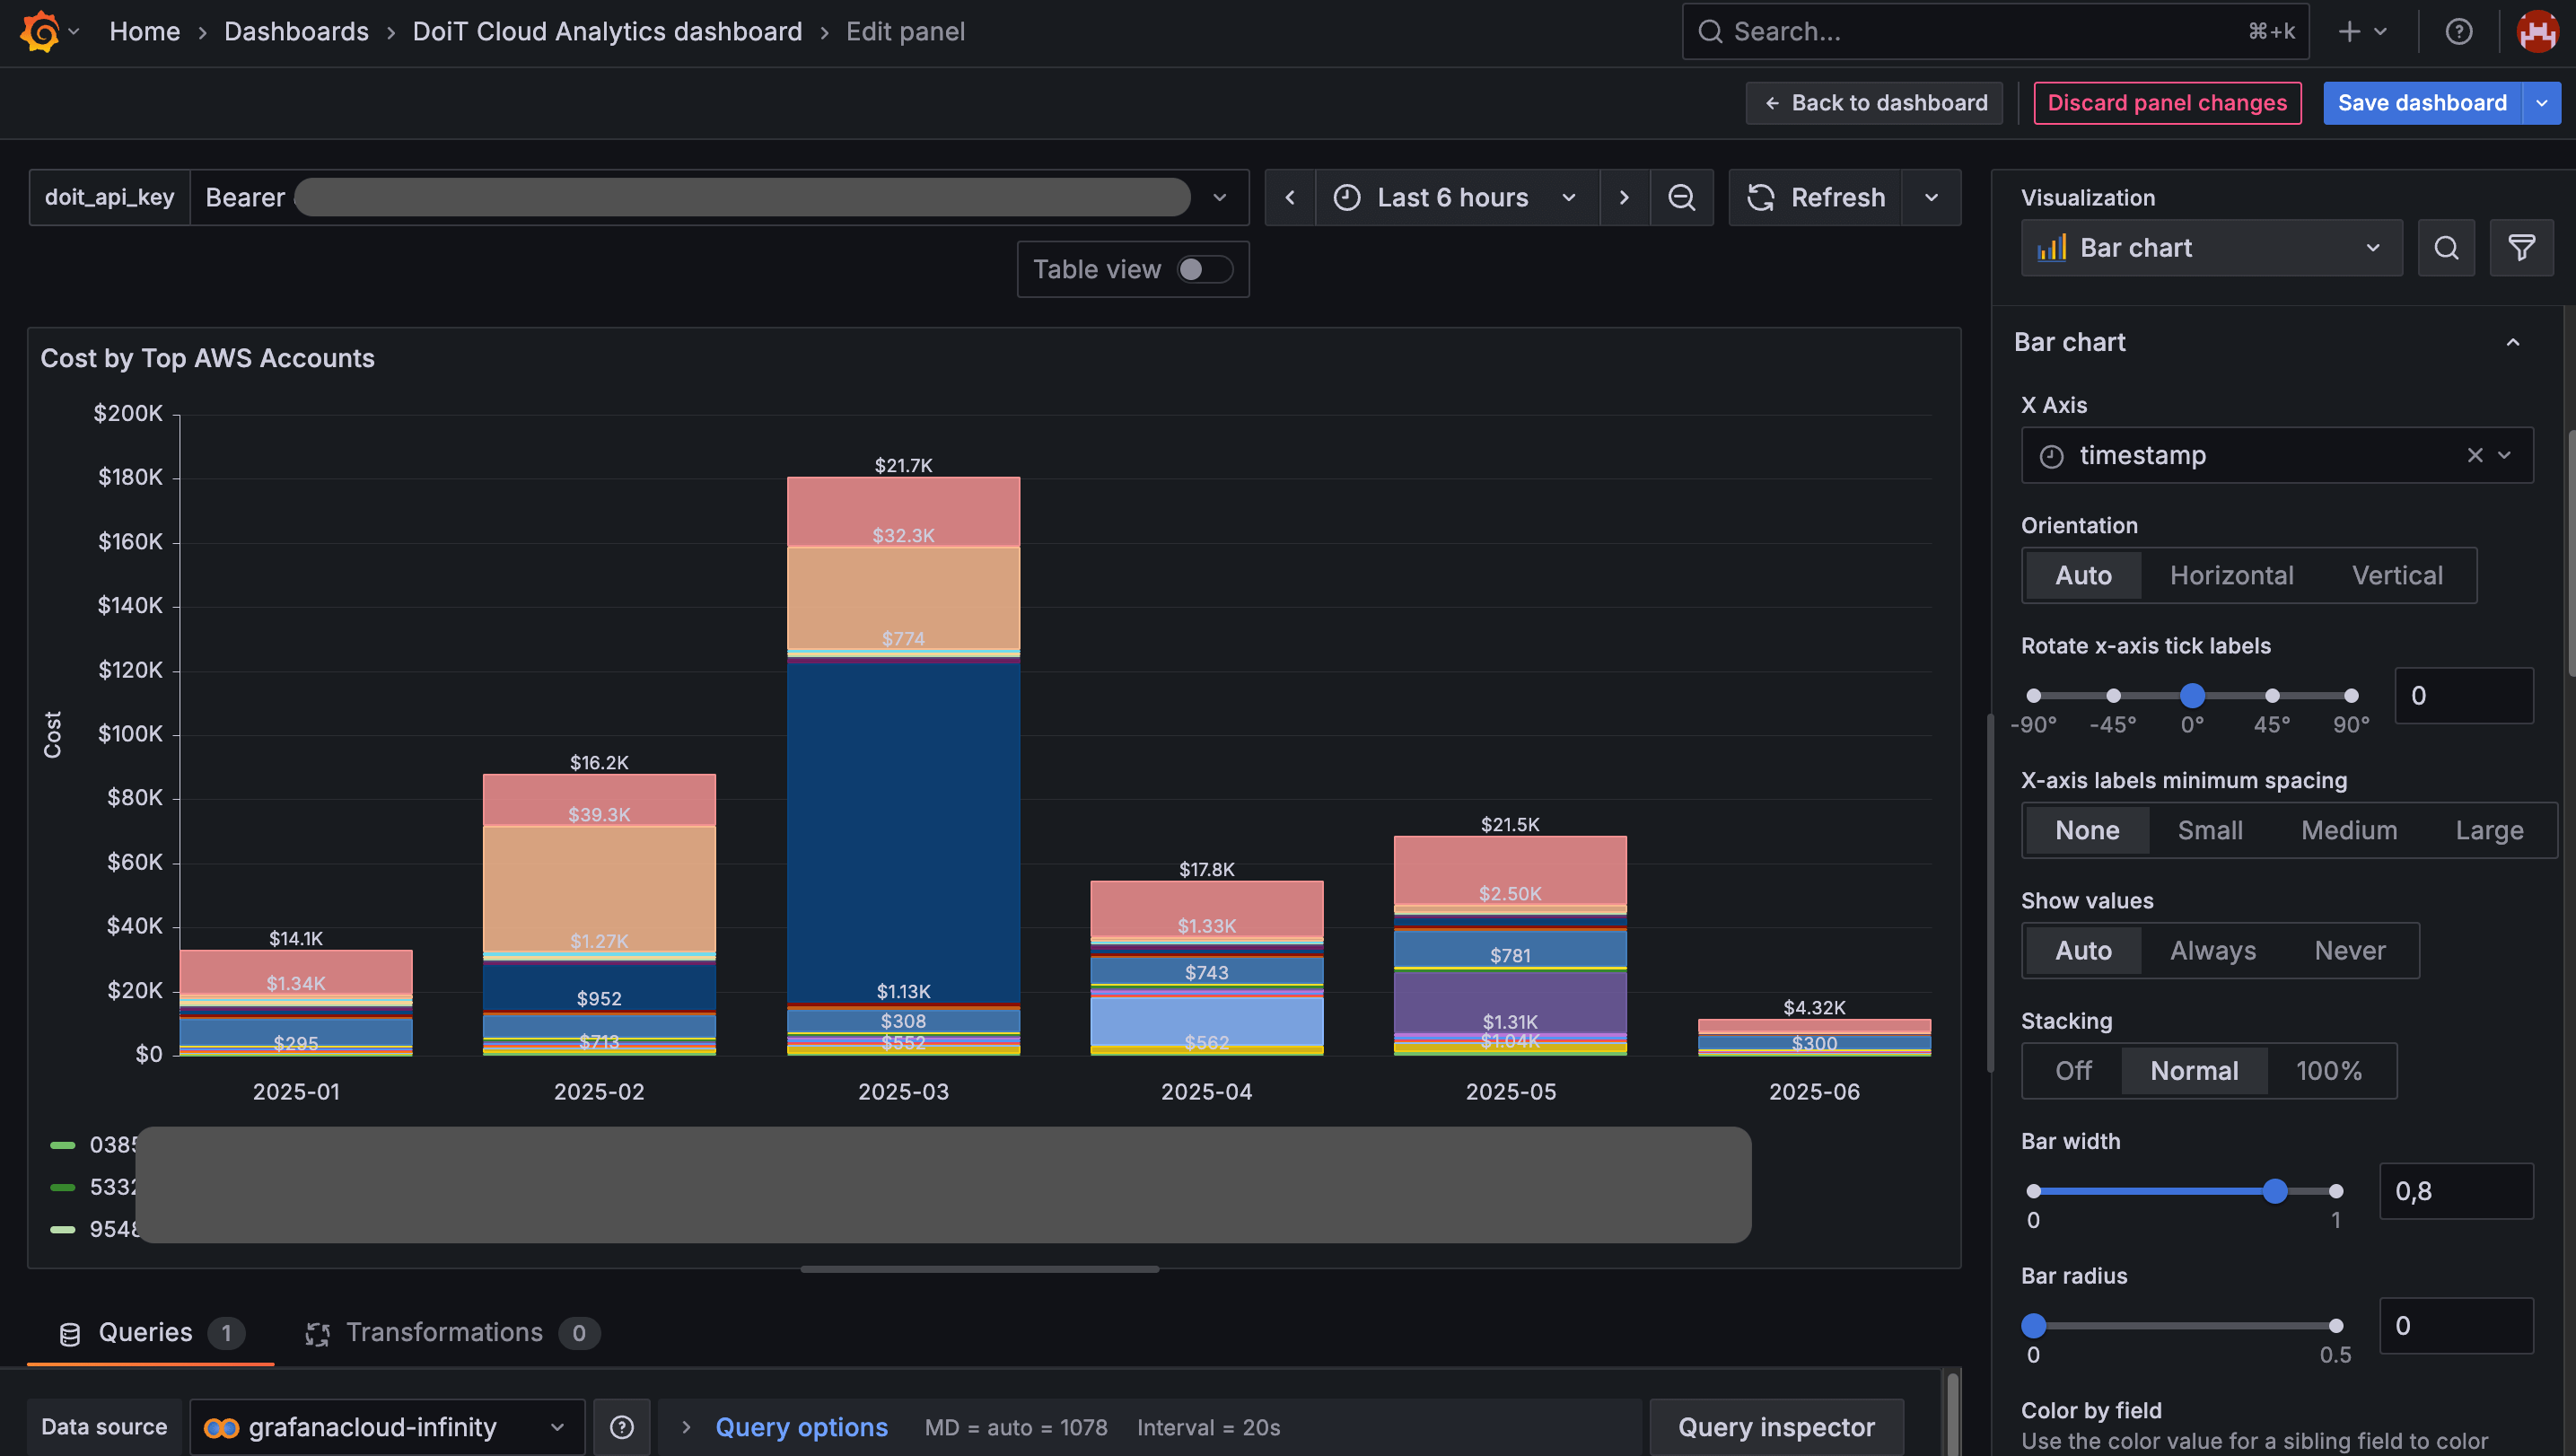
-
Select and configure your visualization. Below is a bar chart visual representation with stacking.