View custom metrics
Preset and user-defined custom metrics are accessible on the Metrics screen in the console.
Required permissions
You must have one of the following permissions:
- Cloud Analytics User, Cloud Analytics Read Only, Cloud Analytics Admin, or Metrics Manager
Access metrics
To view the list of available preset and user-defined custom metrics, sign in to the DoiT console, select Reporting and analytics > Metrics from the top navigation mega menu.
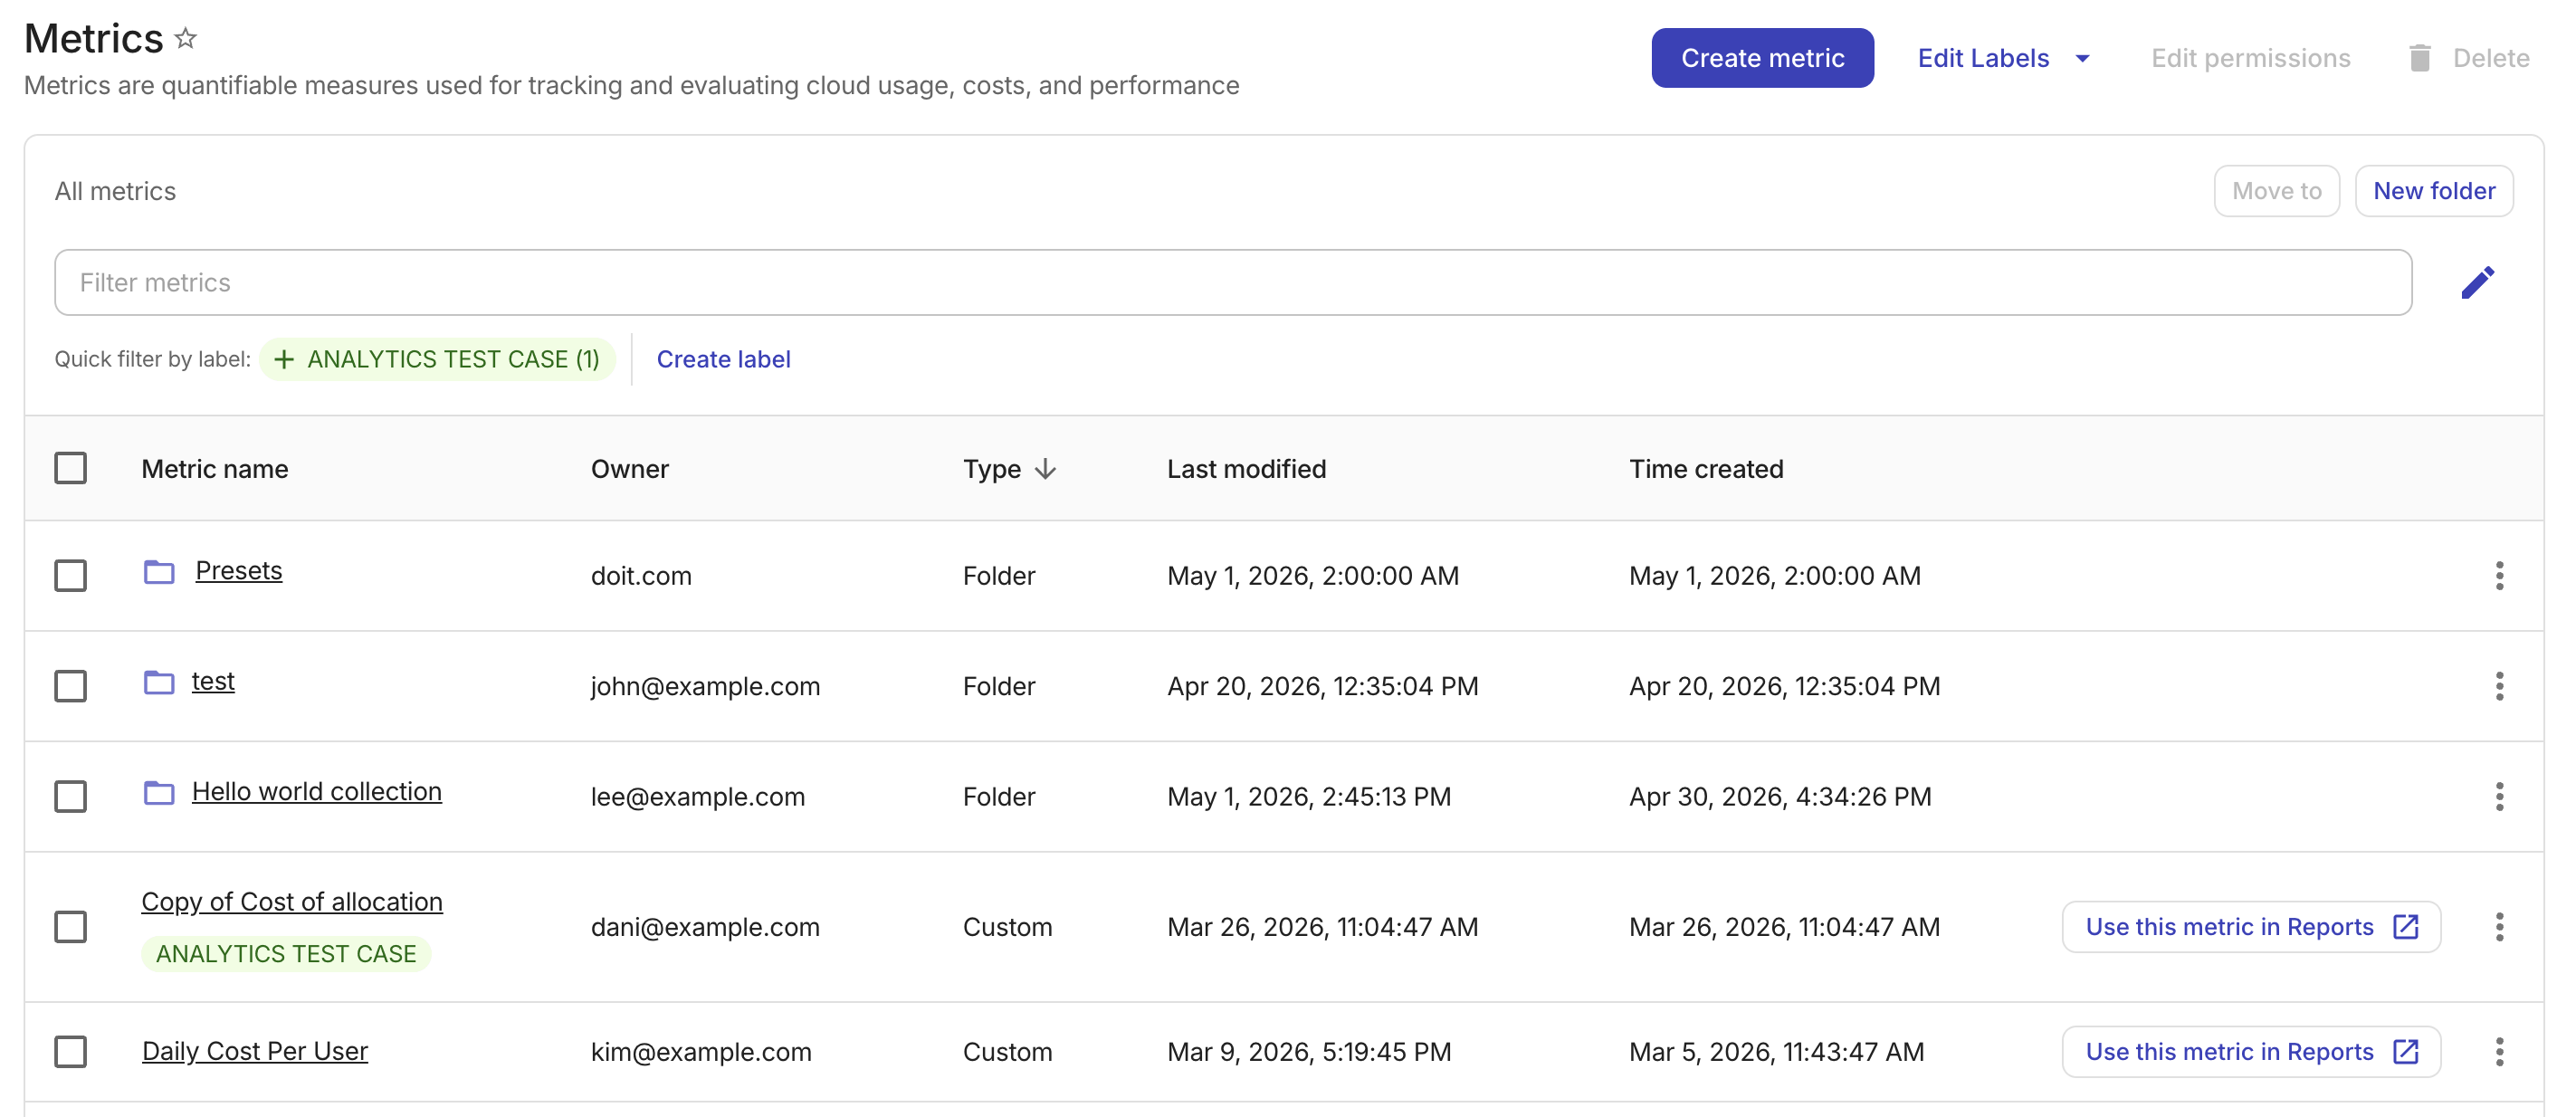
The Metrics list is displayed in the following order:
-
A read-only Presets folder that contains all preset custom metrics. This folder is maintained by DoiT and cannot be renamed, moved, or deleted.
-
Folders created by you and other users in your organization to group user-defined custom metrics.
-
User-defined custom metrics not in any folders.
You can filter metrics by property; the results include matches from any folder. You cannot filter folders at the moment.
View a metric
To view the configuration of a metric, open its configuration page by selecting the metric name on the main Metrics screen.
If there are meaningful results, you can also generate a preview chart of the metric.
Edit permissions
A user-defined custom metric is visible only to those with whom the metric has been shared or those with the Cloud Analytics Admin permission. See Share metrics for more information.
Organize metrics
You can organize custom metrics in two ways: folders and labels.
Folders
DoiT supports a folder hierarchy that allows you to organize custom metrics effectively, keeping your workspace manageable and easy to navigate.
This hierarchy is shared across three entity types: reports, allocations, and metrics. Any folder operation, such as creating, editing, moving, or deleting, performed to one entity type will automatically apply to the others.
Labels
You can assign labels to your metrics to enhance your FinOps capabilities through improved visibility.