Snowflake Intelligence
Snowflake Intelligence helps you identify and track your Snowflake cost and usage. Use the Lens dashboard to decide how and when to optimize costs, monitor performance, and more.
Required permission
To access Snowflake Intelligence, your DoiT account needs the Cloud Analytics User permission.
Before you begin
-
Make sure your Snowflake account is connected to DoiT. See how to connect your Snowflake account.
-
Snowflake Intelligence is not available if you signed your Snowflake contract through a Snowflake reseller.
Snowflake Intelligence dashboard
The Snowflake Intelligence dashboard consists of multiple preset report widgets that highlight various aspects of your Snowflake spend and usage. It's automatically populated when you connect your Snowflake account to DoiT.
To access the Snowflake Intelligence dashboard, select Dashboards from the top navigation mega menu, and then select Snowflake Intelligence.
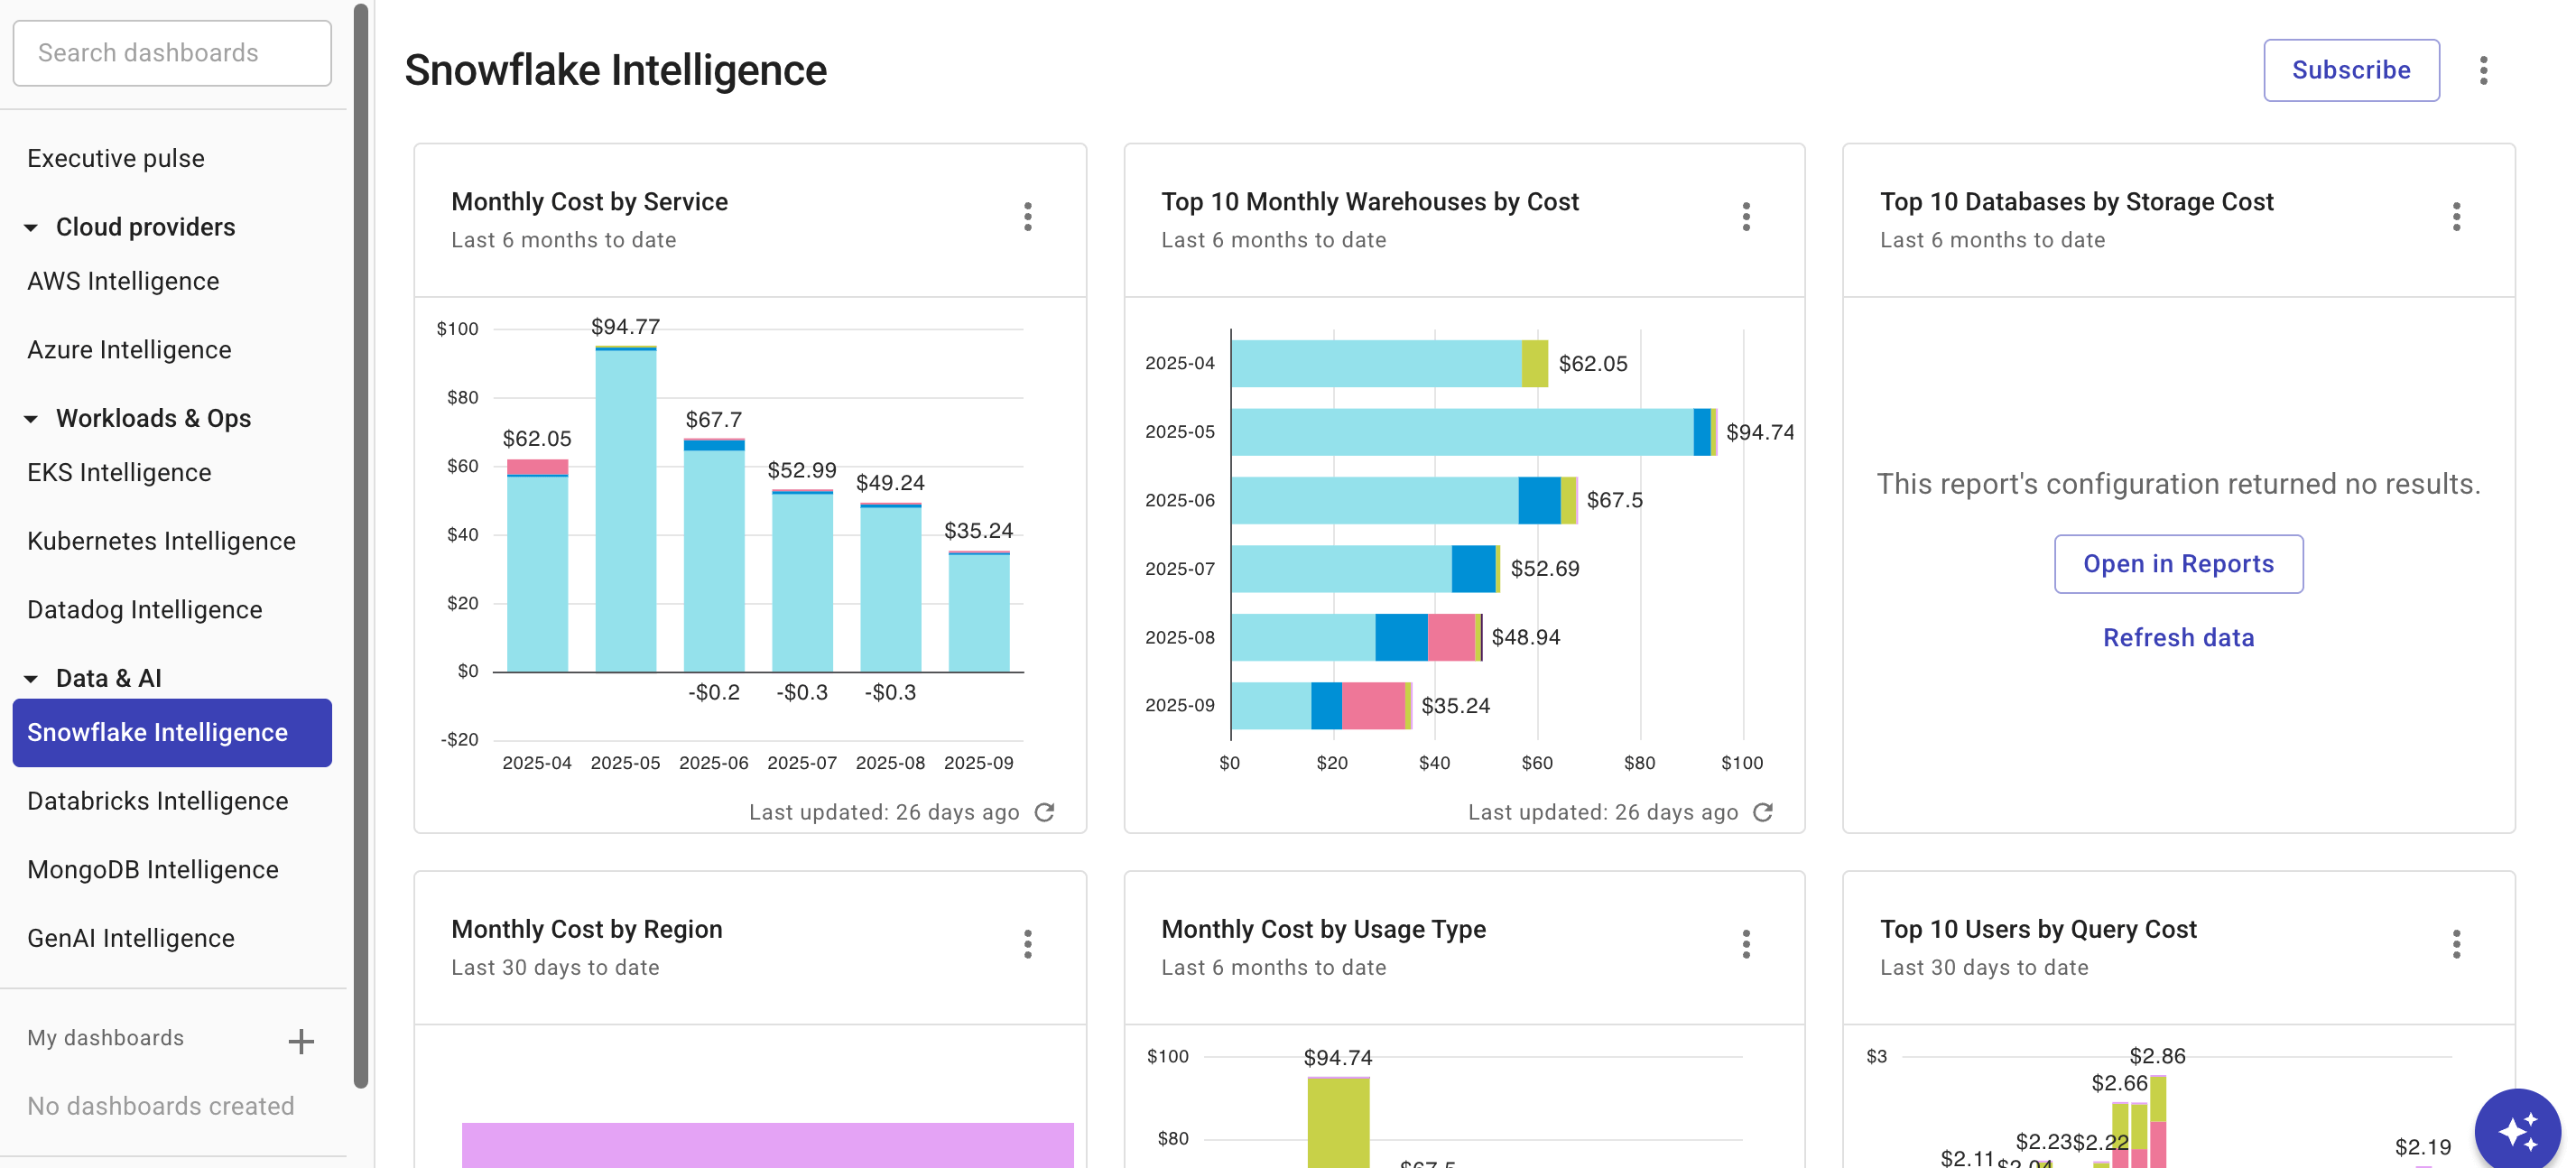
Widgets on the dashboard are updated independently of each other. See Refresh report data for more information.
You can Open full report to check the report configuration, or customize the preset report to create your own one.
Monthly Cost by Service
This widget displays the costs associated with different Snowflake services, such as Snowflake Computing or Snowflake Storage, to identify cost drivers.
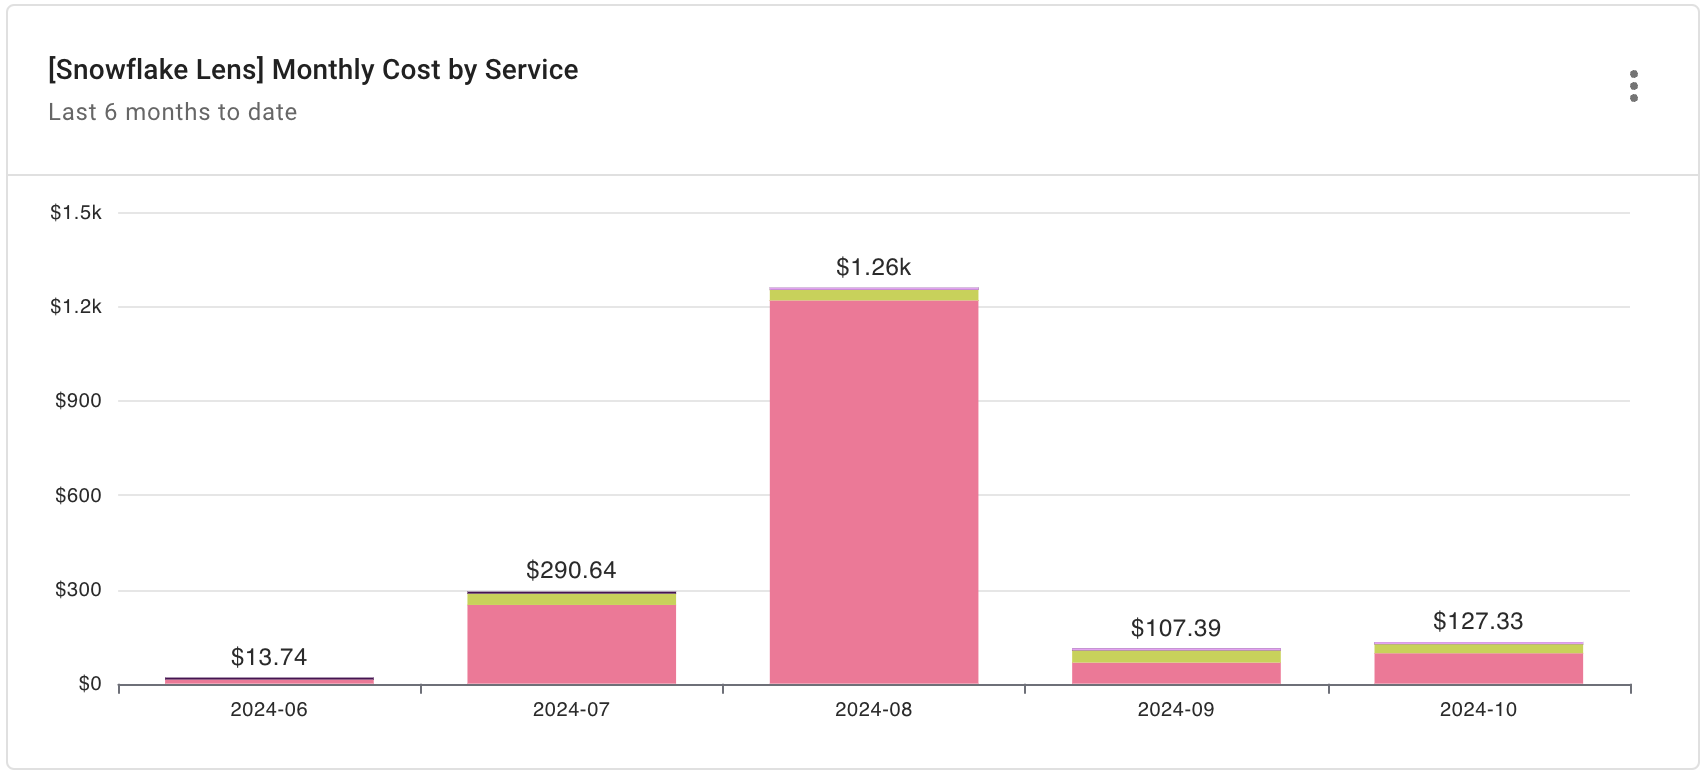
Report configuration:
- Metric: Cost
- Time Range: Last 6 months (include current month)
- Time Interval: Month
- Filters
- Provider:
Snowflake
- Provider:
- Group by: Service
Top 10 Monthly Warehouses by Cost
This widget lists the warehouses that consumed the most resources and incurred the highest costs during a given month.
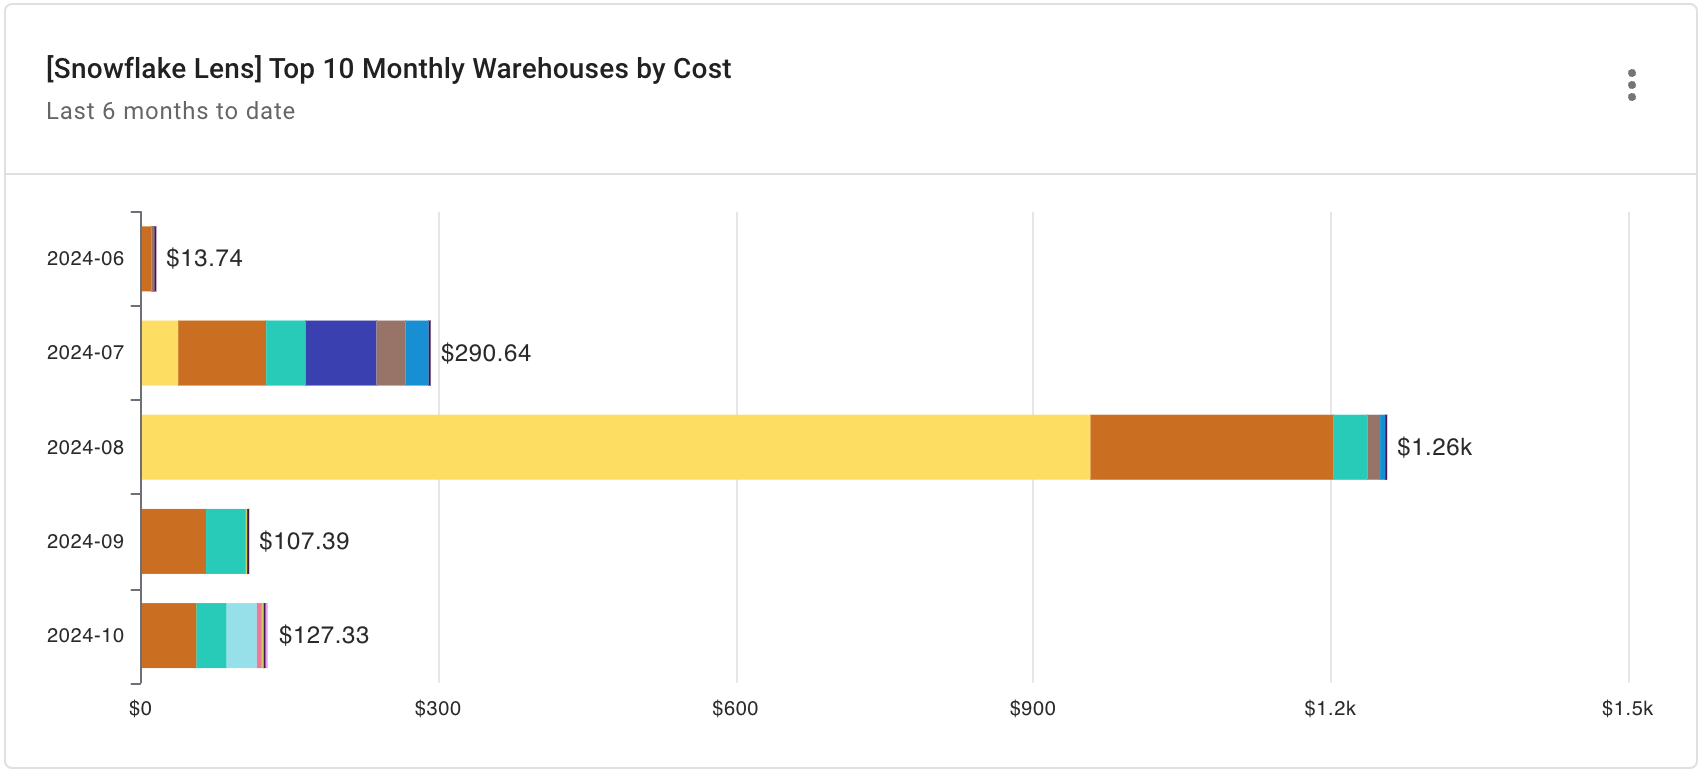
Report configuration:
- Metric: Cost
- Time Range: Last 6 months (include current month)
- Time Interval: Month
- Filters
- Provider:
Snowflake - Top/bottom results: Service—Limit to top 10 by cost
- Provider:
- Group by: snowflake/warehouse_name
Top 10 Databases by Storage Cost
This widget identifies the databases that have the highest storage costs.
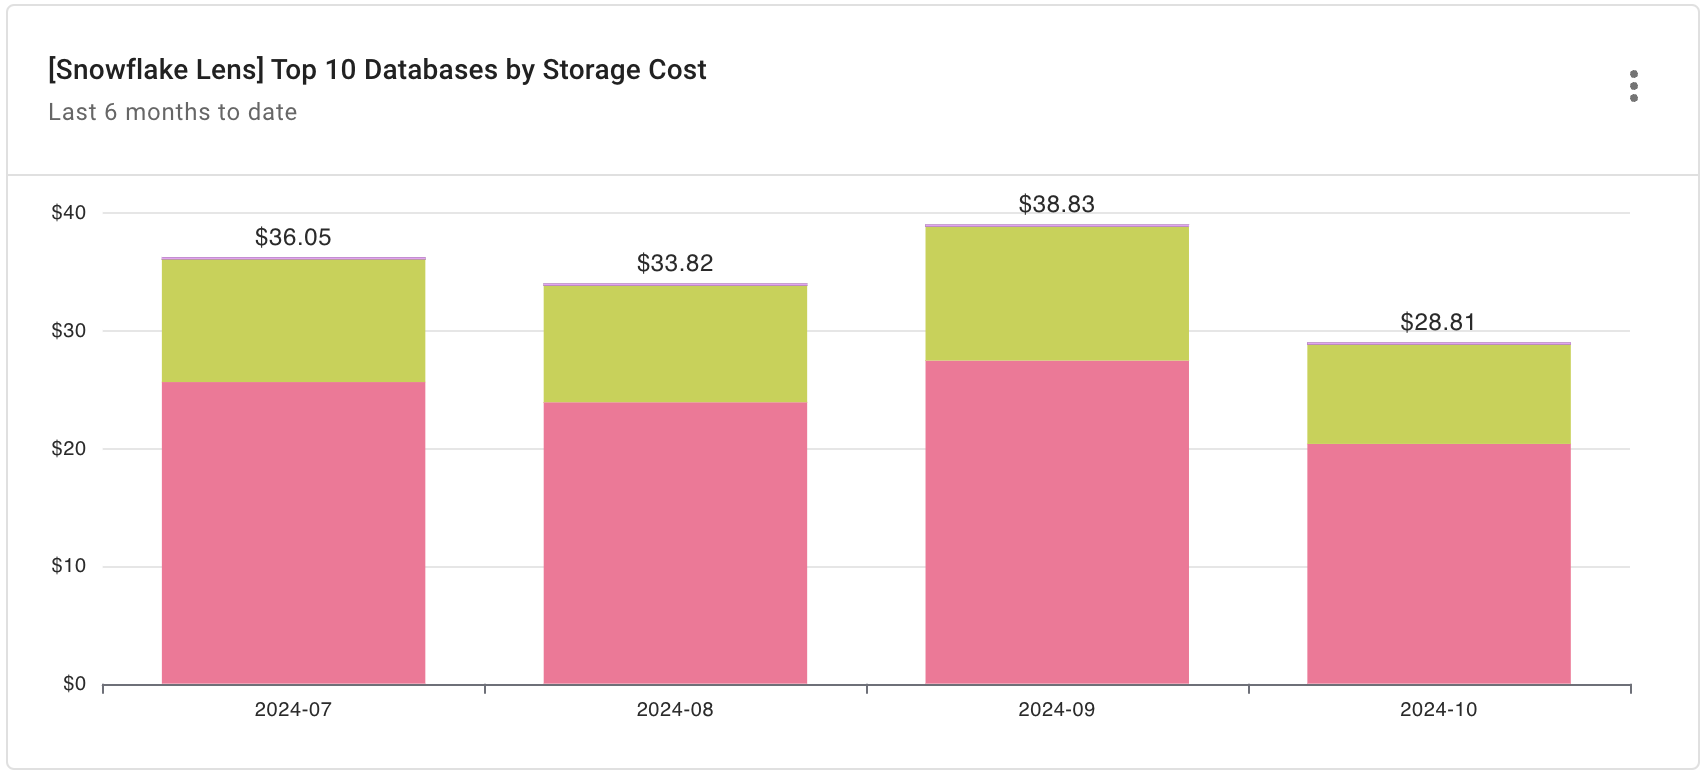
Report configuration:
- Metric: Cost
- Time Range: Last 6 months (include current month)
- Time Interval: Month
- Filters
- Provider:
Snowflake - Service:
STORAGE - Top/bottom results: Service—Limit to top 10 by cost
- Provider:
- Group by: snowflake/database_name
Monthly Cost by Region
This widget breaks down the monthly costs by geographical region, allowing for cost allocation and analysis based on location.
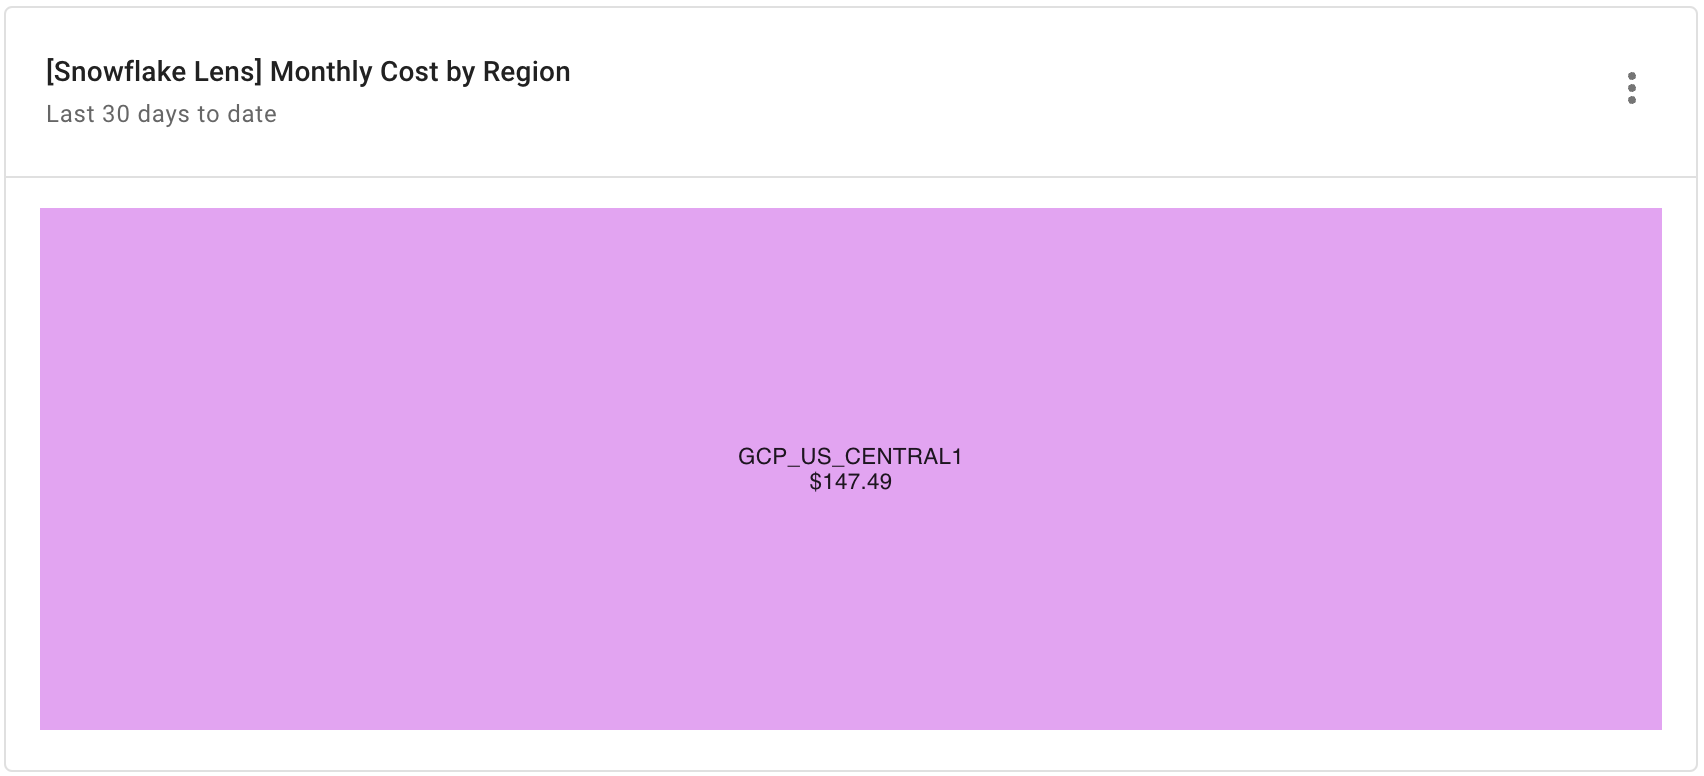
Report configuration:
- Metric: Cost
- Time Range: Last 30 days (include current day)
- Time Interval: Month
- Filters
- Provider:
Snowflake
- Provider:
- Group by: Region
Monthly Cost by Usage Type
This widget categorizes costs based on different usage types—such as compute, storage, or networking—to understand cost distribution.
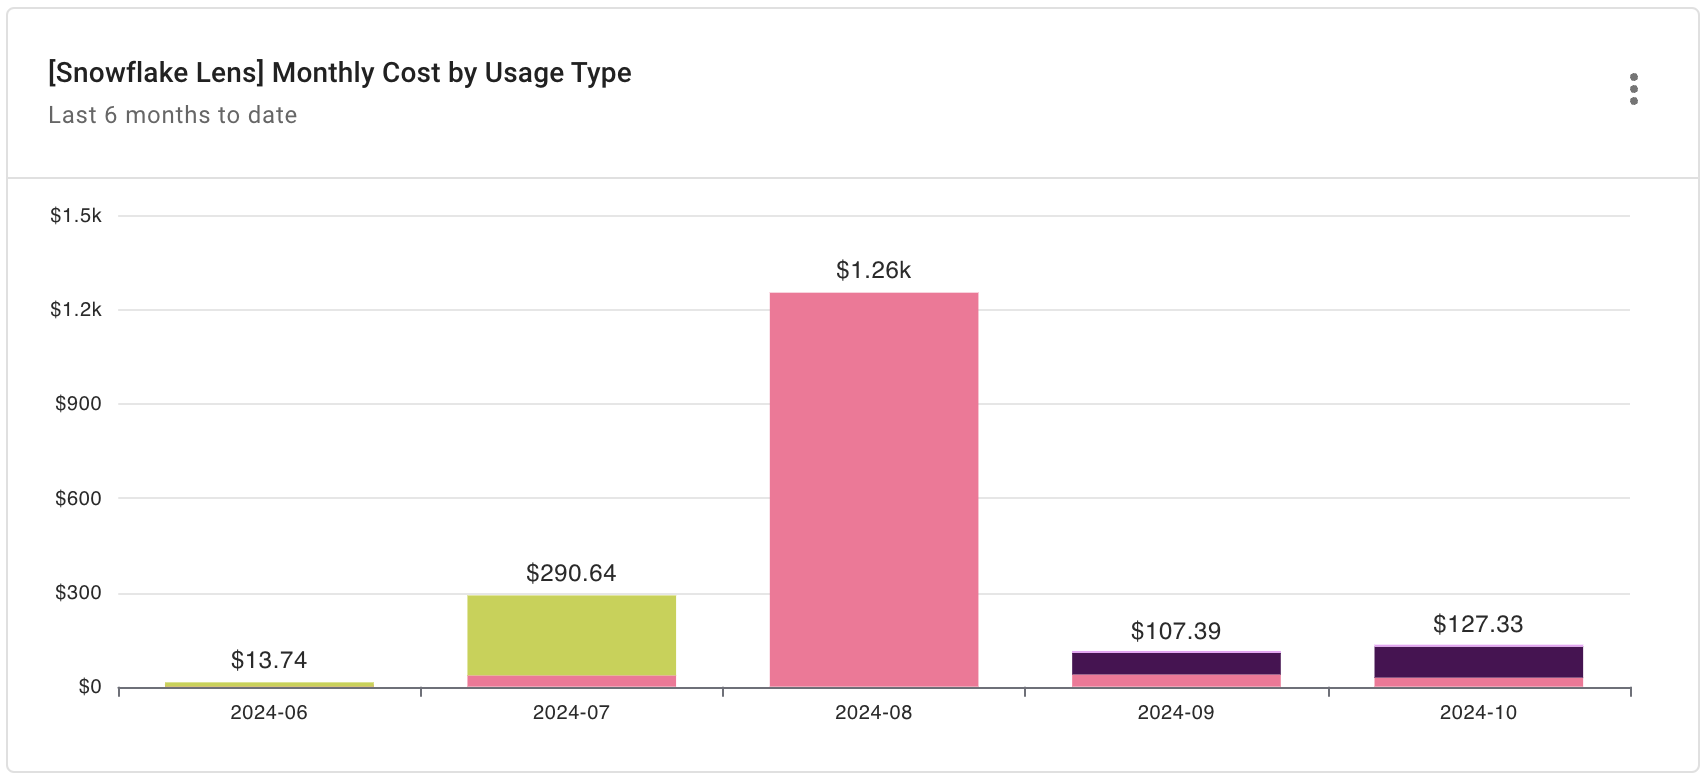
Report configuration:
- Metric: Cost
- Time Range: Last 6 months (include current month)
- Time Interval: Month
- Filters
- Provider:
Snowflake
- Provider:
- Group by: Cost Type
Top 10 Users by Query Cost
This widget identifies the individual users who have executed the most resource-intensive or expensive queries.
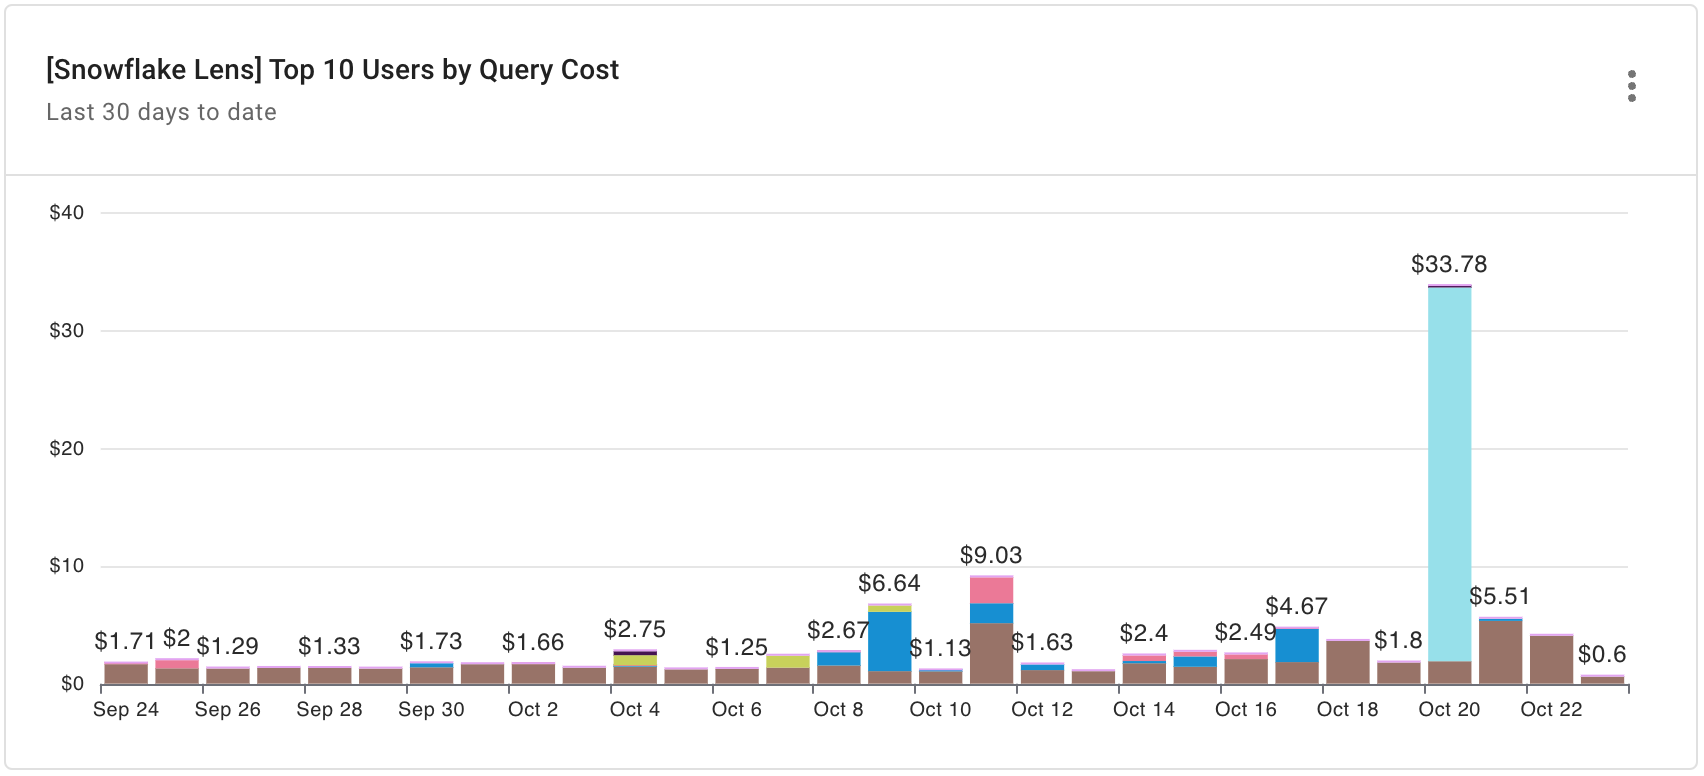
Report configuration:
- Metric: Query Cost
- Time Range: Last 30 days (include current day)
- Time Interval: Day
- Filters
- Provider:
Snowflake - Service: WAREHOUSE_METERING
- Top/bottom results: Service—Limit to top 10 by cost
- Provider:
- Group by: snowflake/user_name