OpenAI Lens
The OpenAI Lens helps you identify and track your OpenAI cost and usage and make decisions about how and when to optimize costs, monitor performance, and more.
OpenAI cost data reflects final charges while usage data is for monitoring activity. This means that the costs shown in reports may not always match your actual usage. If you need more details, check the OpenAI API Usage Dashboard.
Required permission
To access the OpenAI Lens, your DoiT account needs the Cloud Analytics User permission.
OpenAI Lens dashboard
The OpenAI Lens dashboard consists of some preset report widgets that highlight various aspects of your OpenAI spend and usage. It's automatically populated when your OpenAI data has been imported into the DoiT console. See Connect OpenAI.
To access the OpenAI Lens dashboard, select Dashboard from the top navigation bar, and then select OpenAI Lens under Preset dashboards.
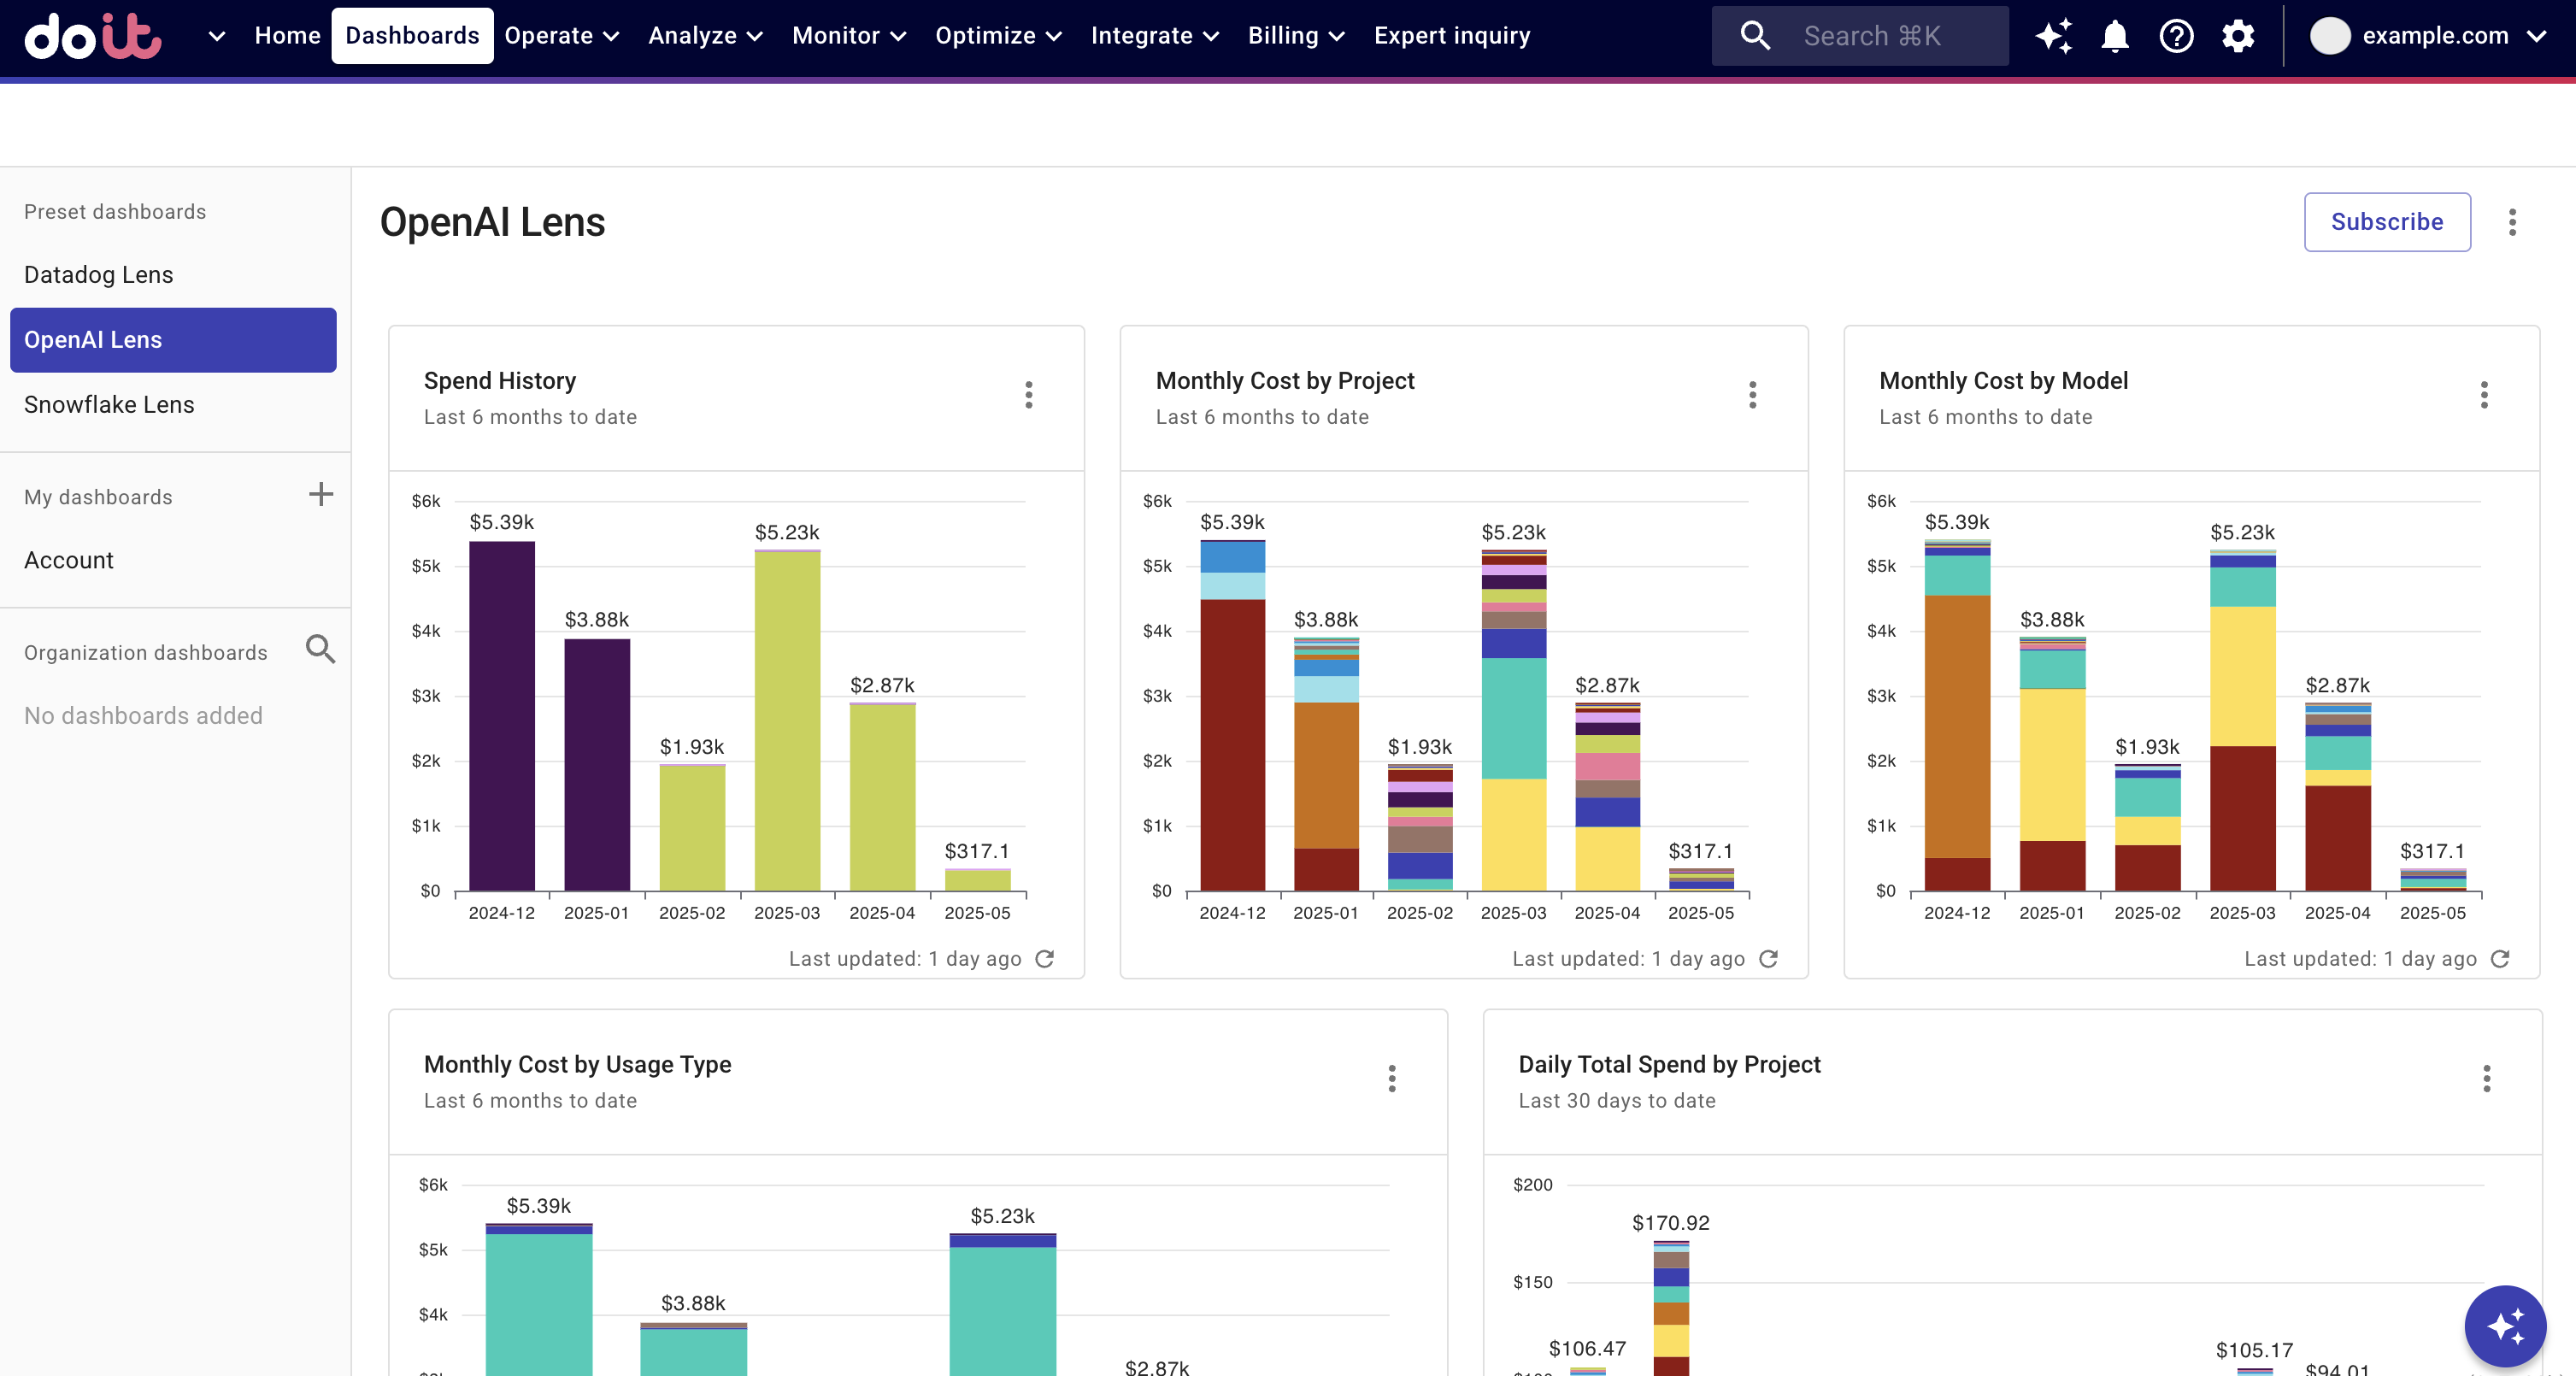
Widgets on the dashboard are updated independently of each other. See Refresh report data for more information.
You can Open full report to check the report configuration, or customize the preset report to create your own one.
Spend history
Shows your total monthly OpenAI expenditure. This is useful for managing costs, optimizing usage, and making informed decisions about your applications and projects.
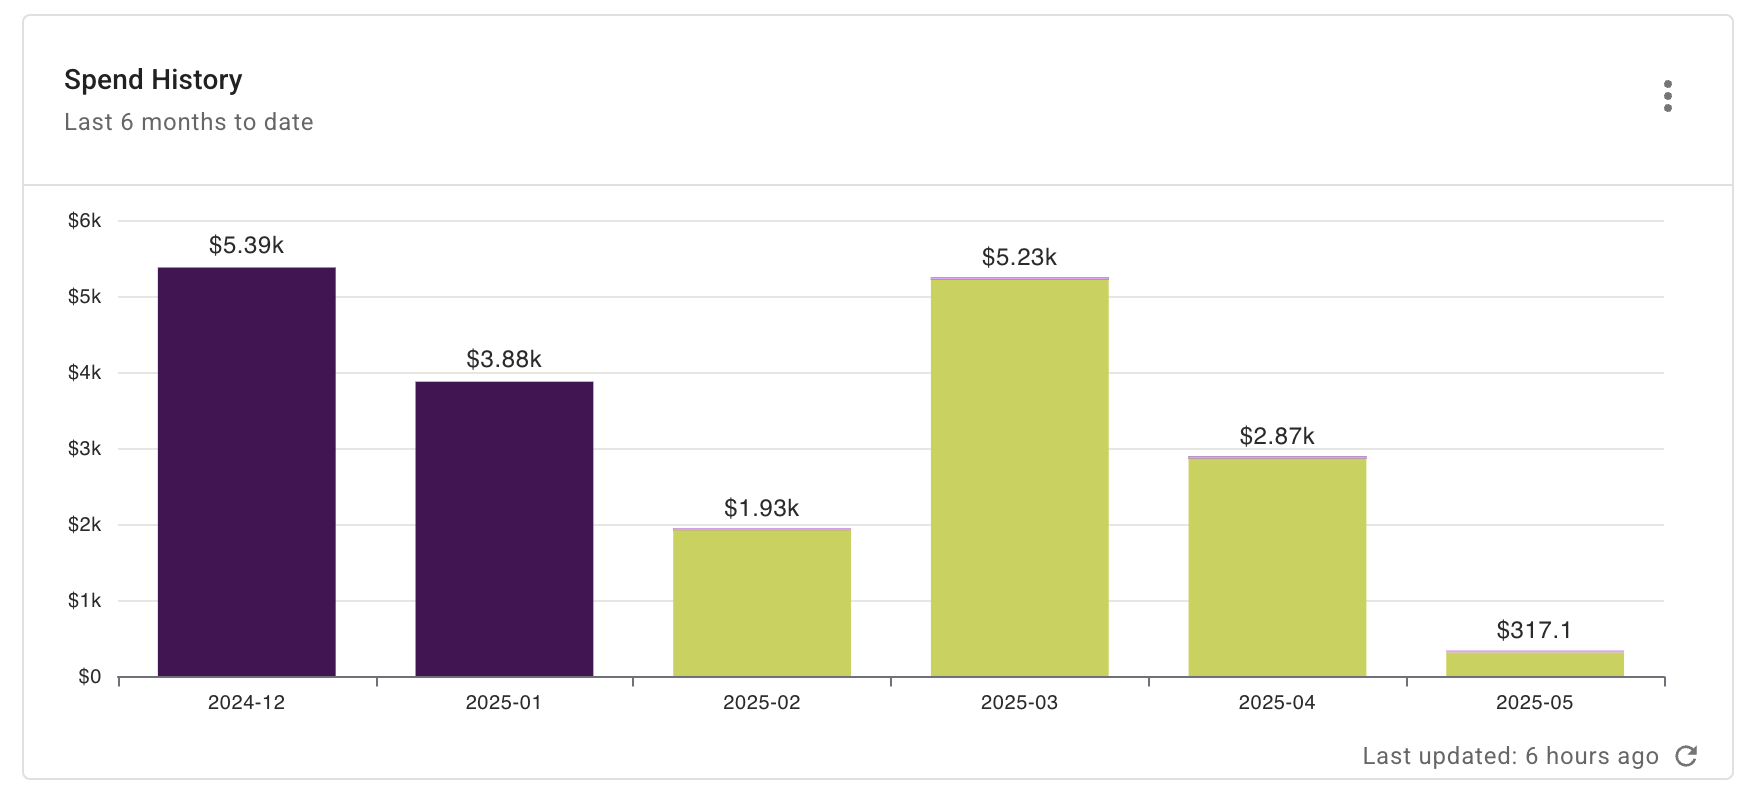
Report configuration:
- Metric: Cost
- Time Range: Last 6 months w. current
- Time Interval: Month
- Filters:
- Provider equals
OpenAI
- Provider equals
- Group by:
- Billing Account
- System label:
openai/organization_name
Monthly cost by project
Shows your total monthly OpenAI expenditure by project. This highlights which projects are driving the most expenditure, enabling you to optimize costs and improve budget management, ensuring each projects financial viability.
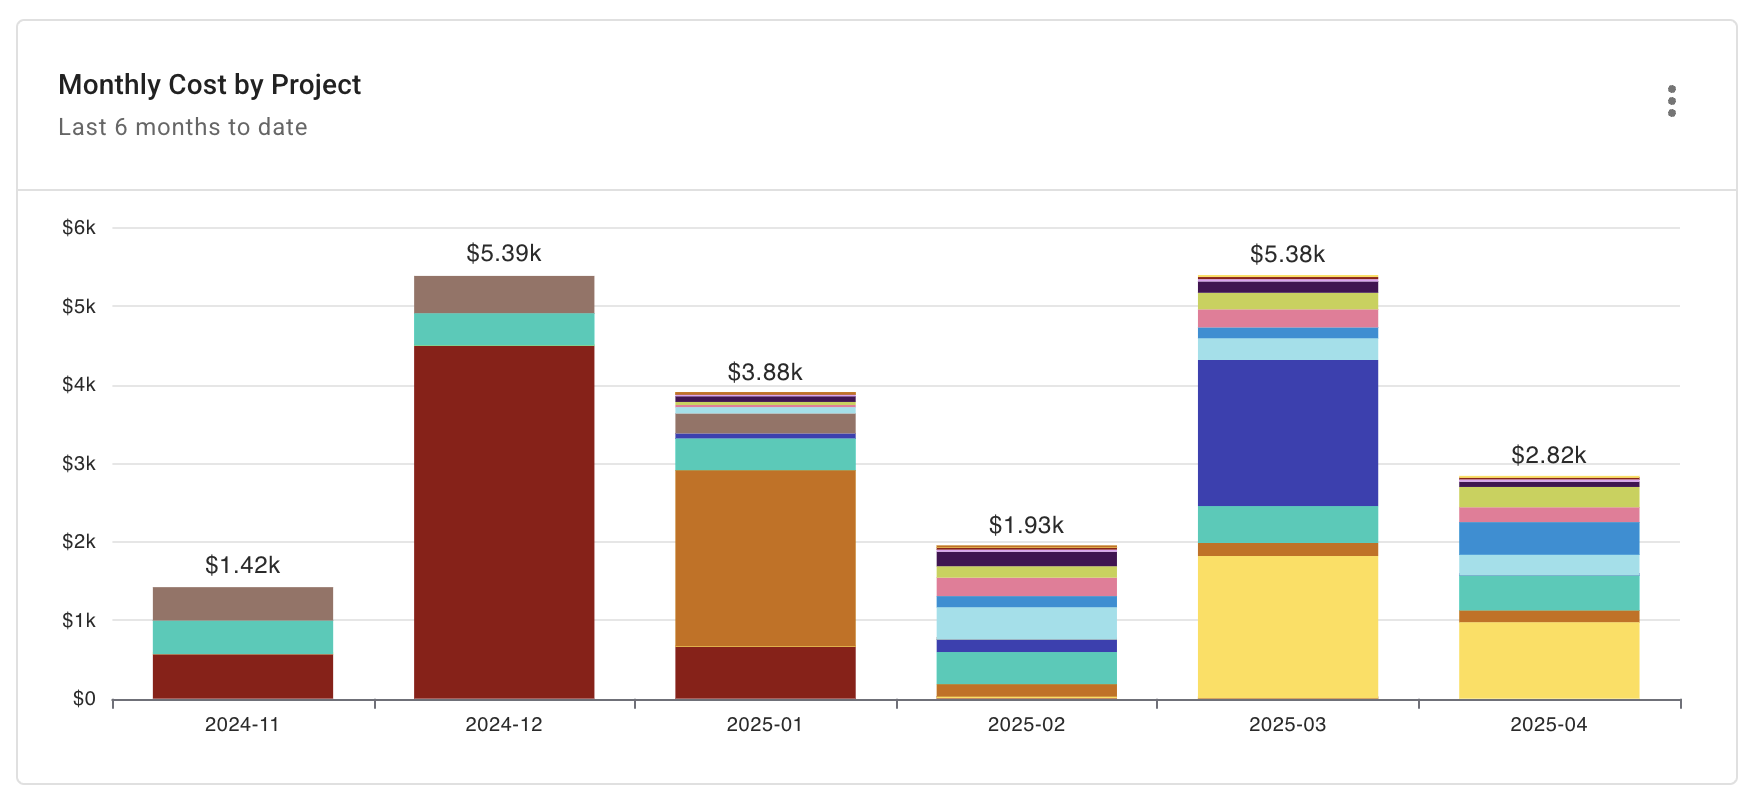
Report configuration:
- Metric: Cost
- Time Range: Last 6 months w. current
- Time Interval: Month
- Filters:
- Provider equals
OpenAI
- Provider equals
- Group by: Project/Account ID
Monthly cost by model
Shows your total monthly OpenAI expenditure by model. This highlights which models contribute most to spending. It helps you pinpoint high-cost models, enabling you to adjust usage or model choices in line with budgetary constraints.

Report configuration:
- Metric: Cost
- Time Range: Last 6 months w. current
- Time Interval: Month
- Filters:
- Provider equals
OpenAI
- Provider equals
- Group by:
- System label:
openai/base-model
- System label:
Monthly cost by usage Type
Shows your total monthly OpenAI expenditure by usage type. This highlights which OpenAI resources consume the most budget. This enables you to optimize your usage, ensuring resources are allocated efficiently.
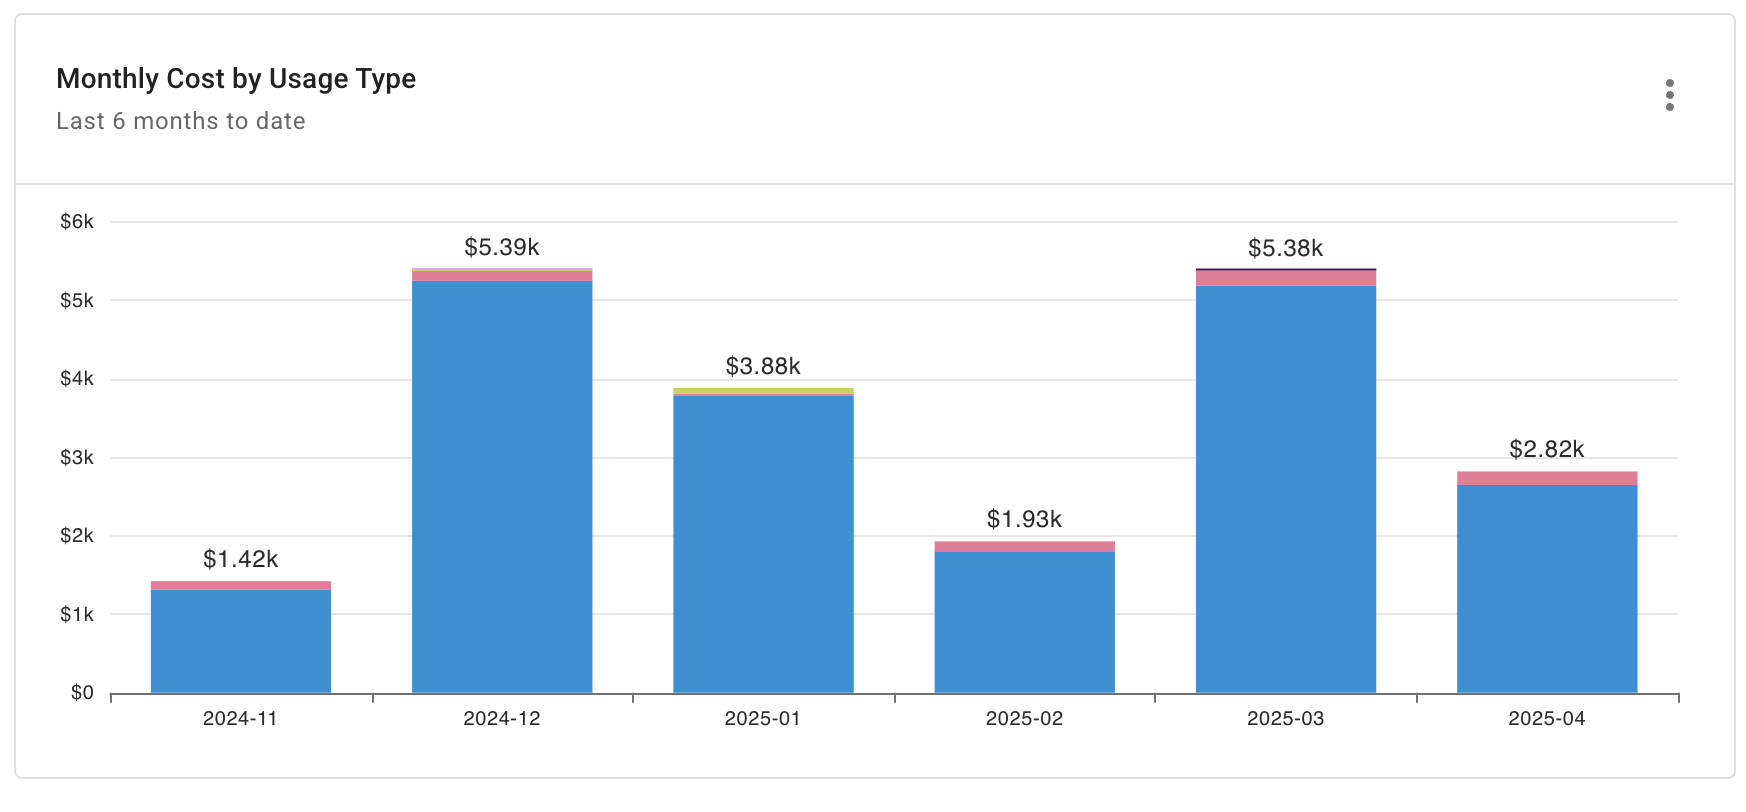
Report configuration:
- Metric: Cost
- Time Range: Last 6 months w. current
- Time Interval: Month
- Filters:
- Provider equals
OpenAI
- Provider equals
- Group by: Cost Type, Service
Daily total spend by project
Shows your daily OpenAI spend by project. By isolating expenses per project, you gain visibility into which initiatives are consuming the most resources and can assess their individual cost-effectiveness.
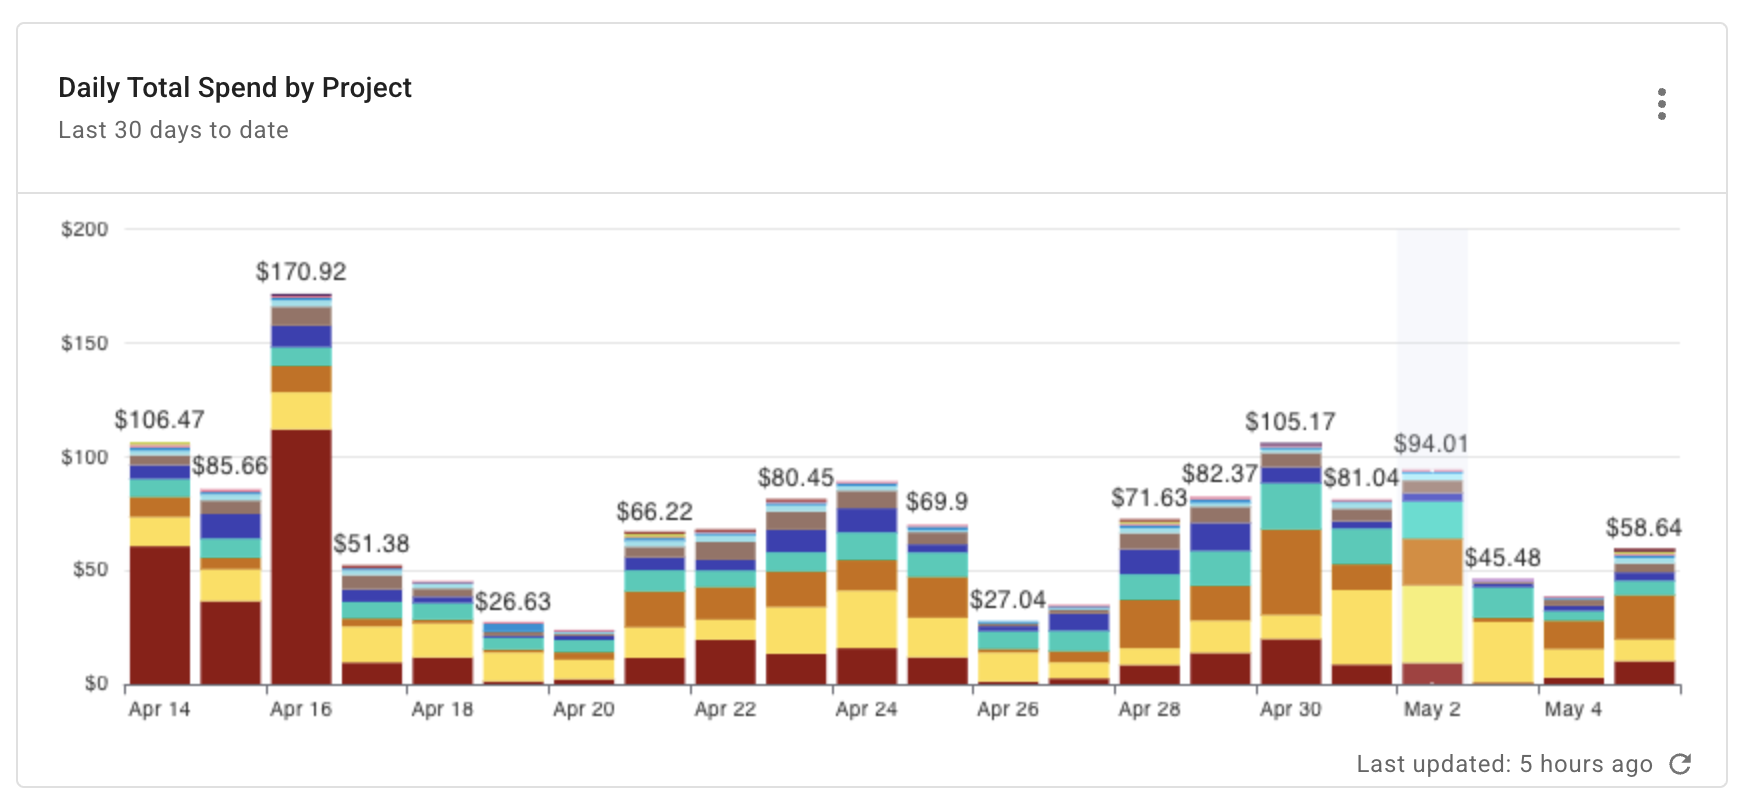
Report configuration:
- Metric: Cost
- Time Range: Last 30 days w. current
- Time Interval: Day
- Filters:
- Provider equals
OpenAI
- Provider equals
- Group by: Project/account ID
Trending usage by services, model and token types
Shows your OpenAI expenditure to date. By visualizing trends over time, you can identify patterns, detect anomalies, and understand which services, models, or input/output token types are driving your OpenAI consumption.

Report configuration:
- Metric: Usage
- Time Range: Last 60 days w. current
- Time Interval: Day
- Filters:
- Provider equals
OpenAI
- Provider equals
- Group by:
- Service
- System label:
openai/model - System label:
openai/media_format
Trending number of API calls by Service
Shows your OpenAI expenditure to date by number of service API calls. By visualizing API call trends over time, you can understand how your application's usage is evolving over time. This allows you to identify which services are becoming more or less critical, anticipate future needs, and optimize your API integration strategy for cost and performance.

Report configuration:
- Metric: Usage
- Time Range: Last 60 days w. current
- Time Interval: Day
- Filters:
- Provider equals
OpenAI
- Provider equals
- Group by: Service