Datadog Intelligence
The Datadog Intelligence helps you identify and track your Datadog cost and usage and make decisions about how and when to optimize costs, monitor performance, and more.
Required permission
To access the Datadog Intelligence, your DoiT account needs the Cloud Analytics User permission.
Datadog Intelligence dashboard
The Datadog Intelligence dashboard consists of some preset report widgets that highlight various aspects of your Datadog spend and usage. It's automatically populated when your Datadog data has been imported into the DoiT console. See Connect Datadog.
To access the Datadog Intelligence dashboard, select Dashboards from the top navigation mega menu, and then select Datadog Intelligence.
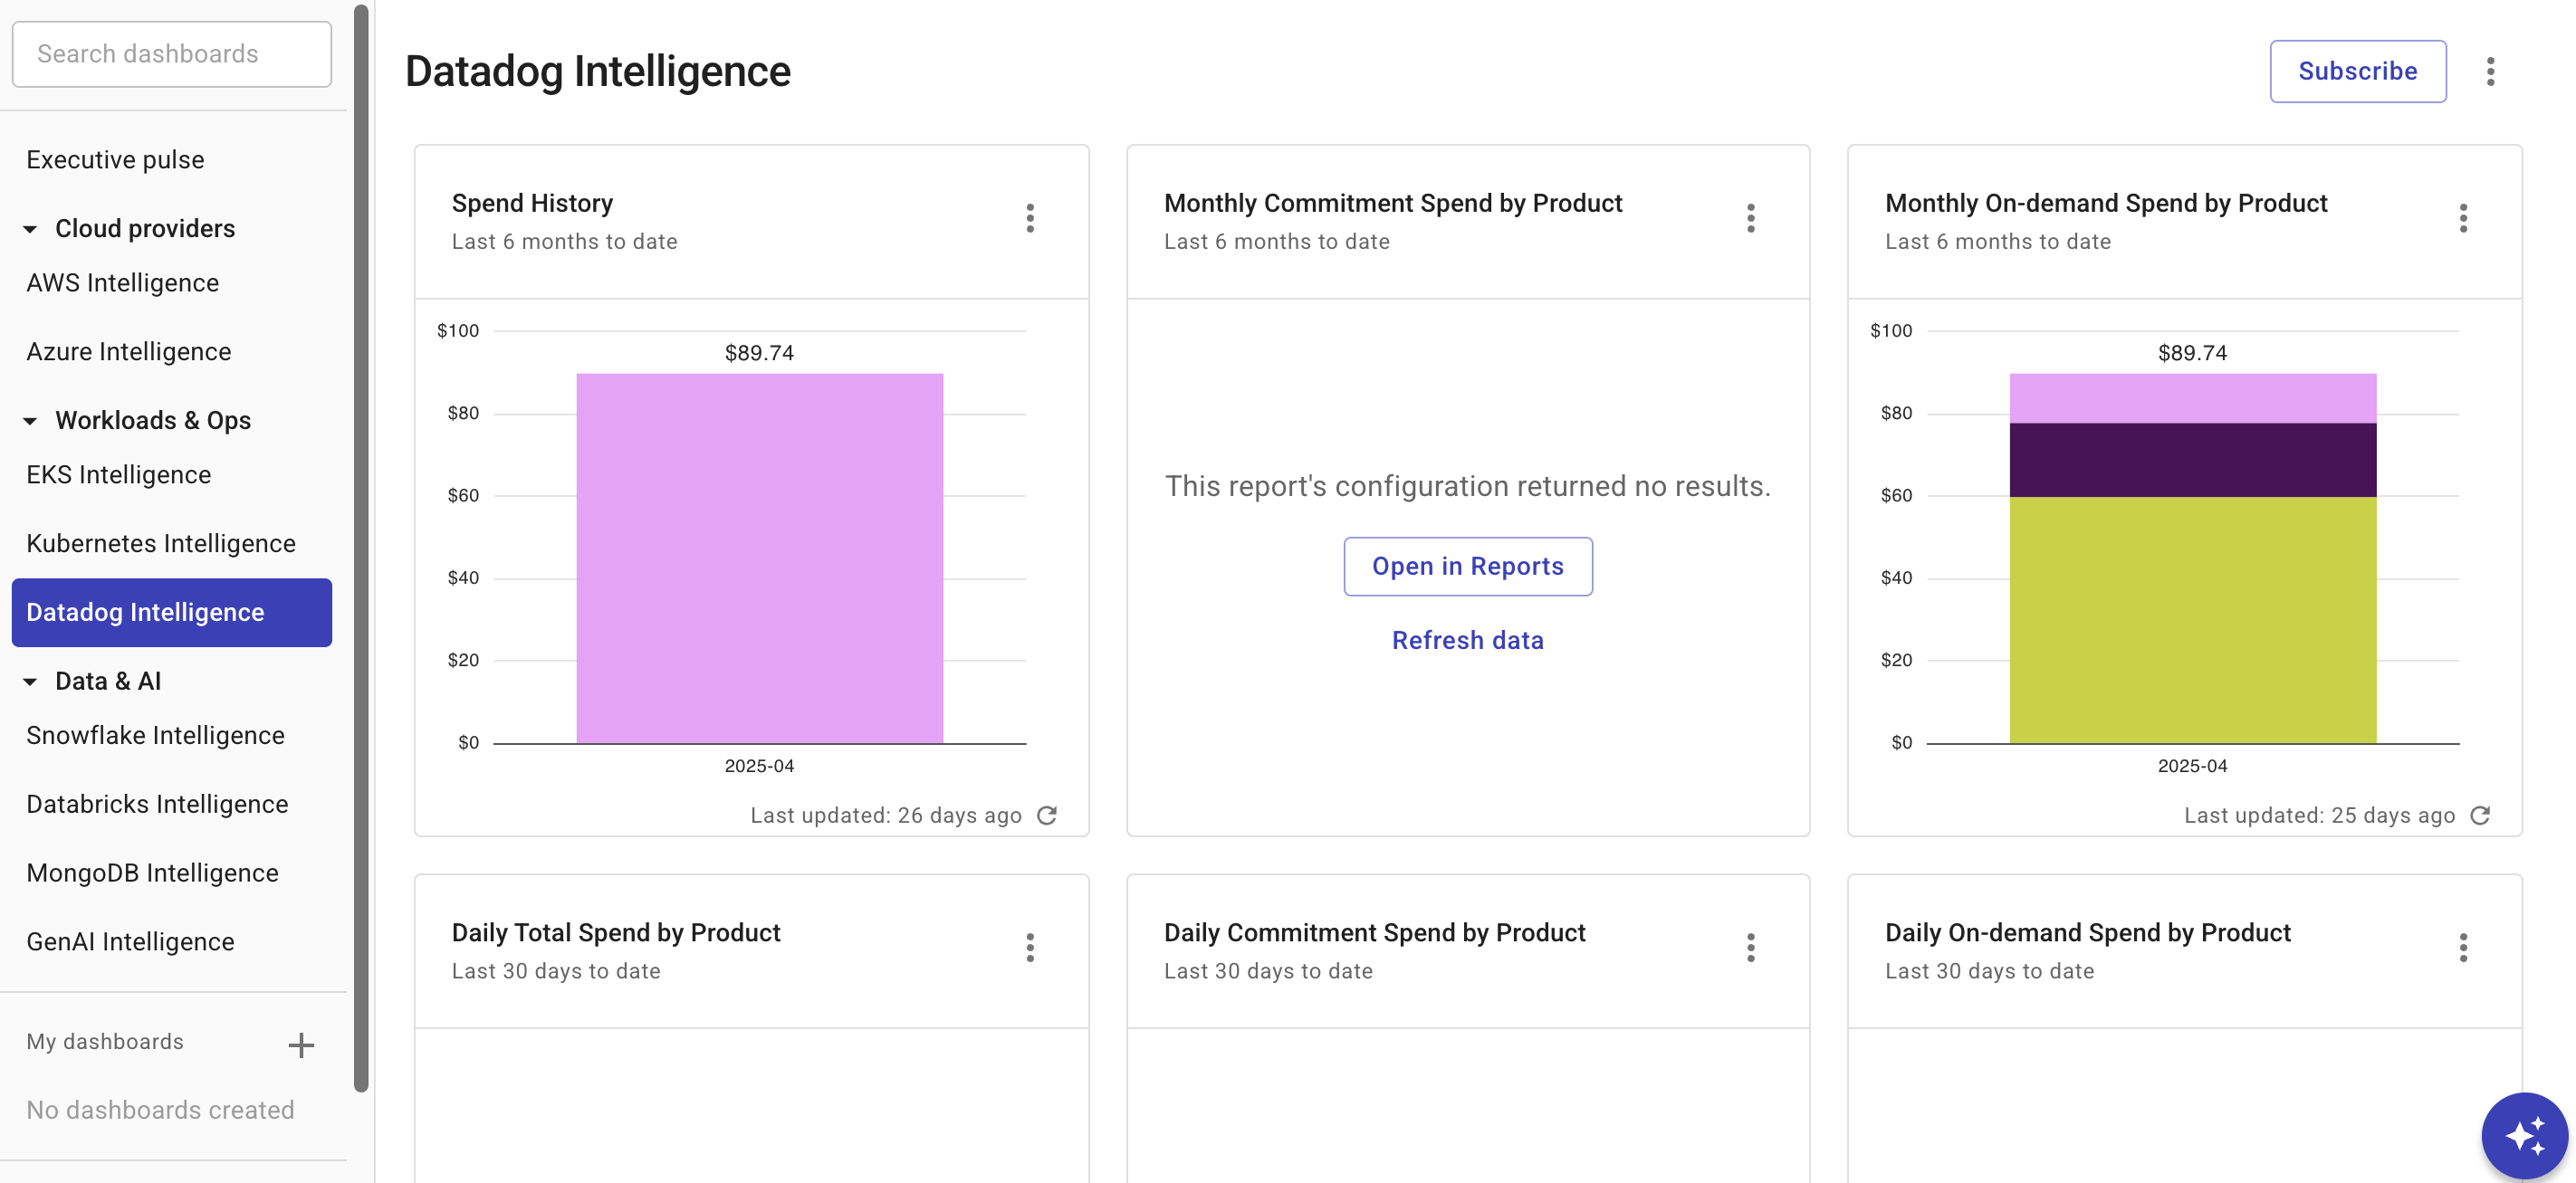
Widgets on the dashboard are updated independently of each other. See Refresh report data for more information.
You can Open full report to check the report configuration, or customize the preset report to create your own one.
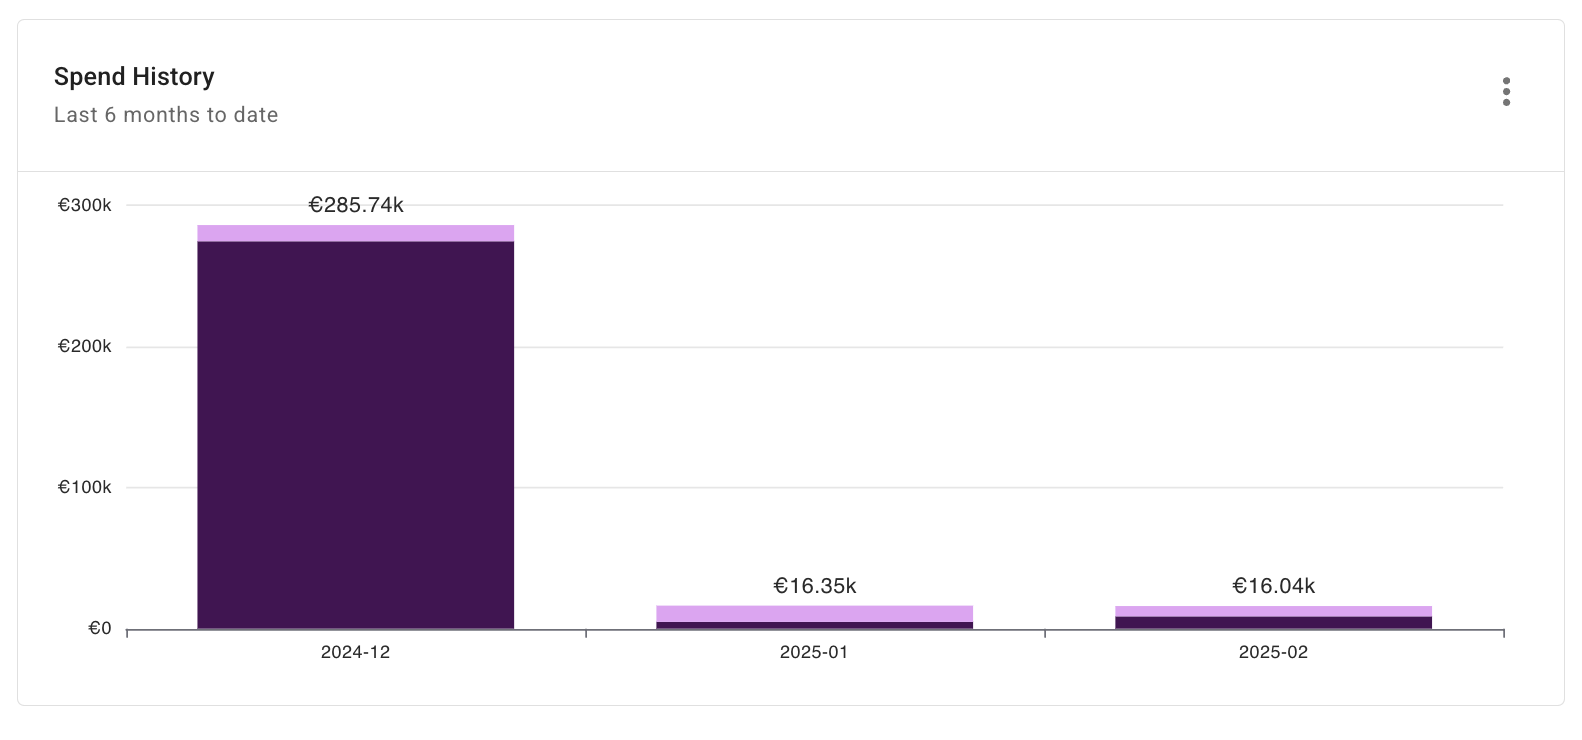
Spend history
Shows your total monthly Datadog expenditure, comparing committed vs actual usage costs. It's an aggregated view of your usage trend and the associated cost across your organization.
Report configuration:
- Metric: Cost
- Time Range: Last 6 months w. current
- Time Interval: Month
- Filters:
- Provider equals
Datadog
- Provider equals
- Group by: Cost Type
- Limit results:
- Limit by value: Cost ≠ 0
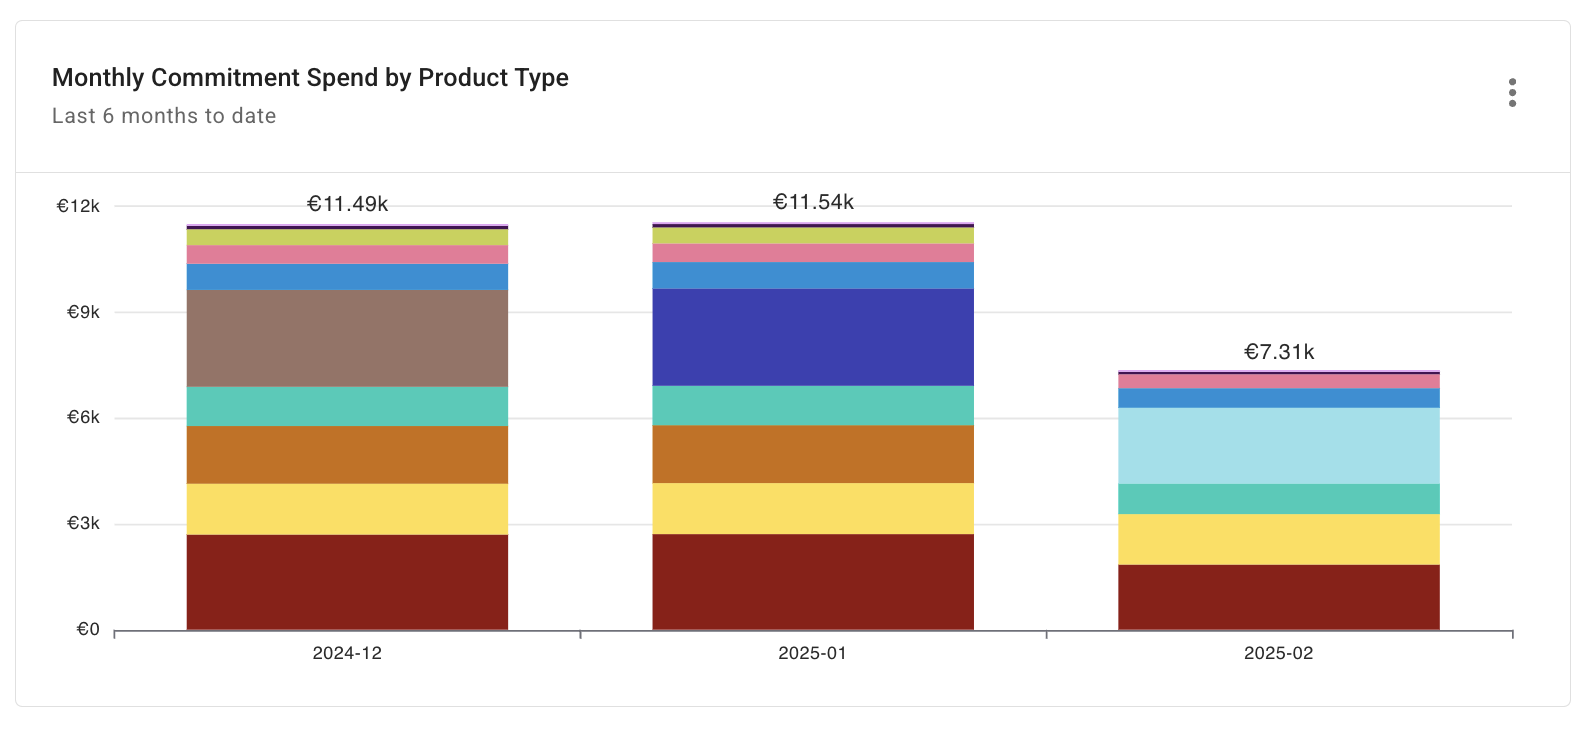
Monthly commitment spend by product
Shows the monthly commitment cost of your Datadog services and products. It allows you to quickly identify the commitment patterns of your Datadog services and whether commitment costs are increasing, decreasing, or remaining stable over time.
Report configuration:
- Metric: Cost
- Time Range: Last 6 months w. current
- Time Interval: Month
- Filters:
- Provider equals
Datadog - Cost Type matches regexp
Commitment
- Provider equals
- Group by: Service
- Limit results:
- Limit by value: Cost ≠ 0
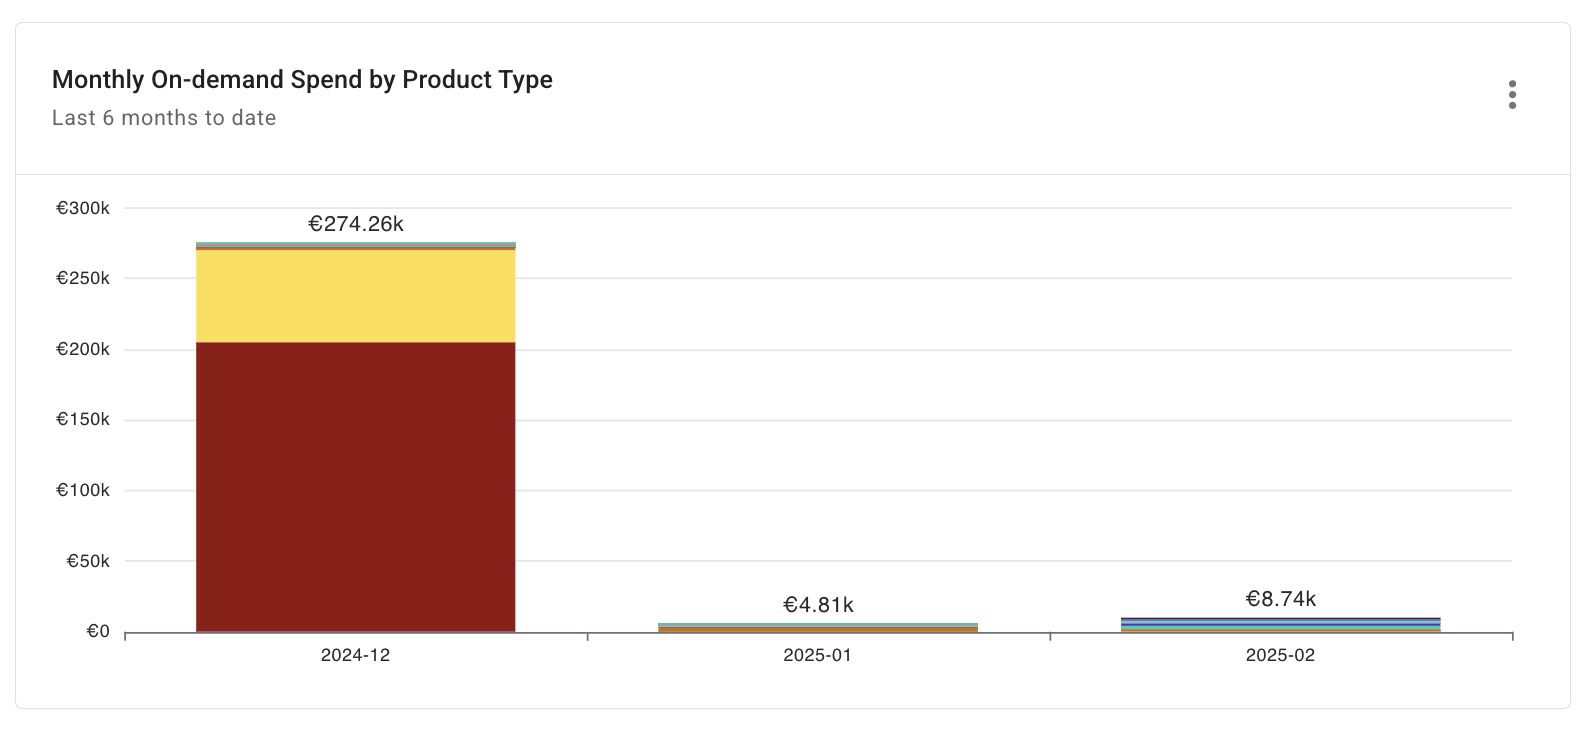
Monthly on-demand spend by product
Shows the pay-as-you-go monthly on-demand costs across your Datadog products. It helps you determine whether switching services to a commitment-based plan could reduce costs.
Report configuration:
- Metric: Cost
- Time Range: Last 6 months w. current
- Time Interval: Month
- Filters:
- Provider equals
Datadog - Cost Type matches regexp
Usage
- Provider equals
- Group by: Service
- Limit results:
- Limit by value: Cost ≠ 0
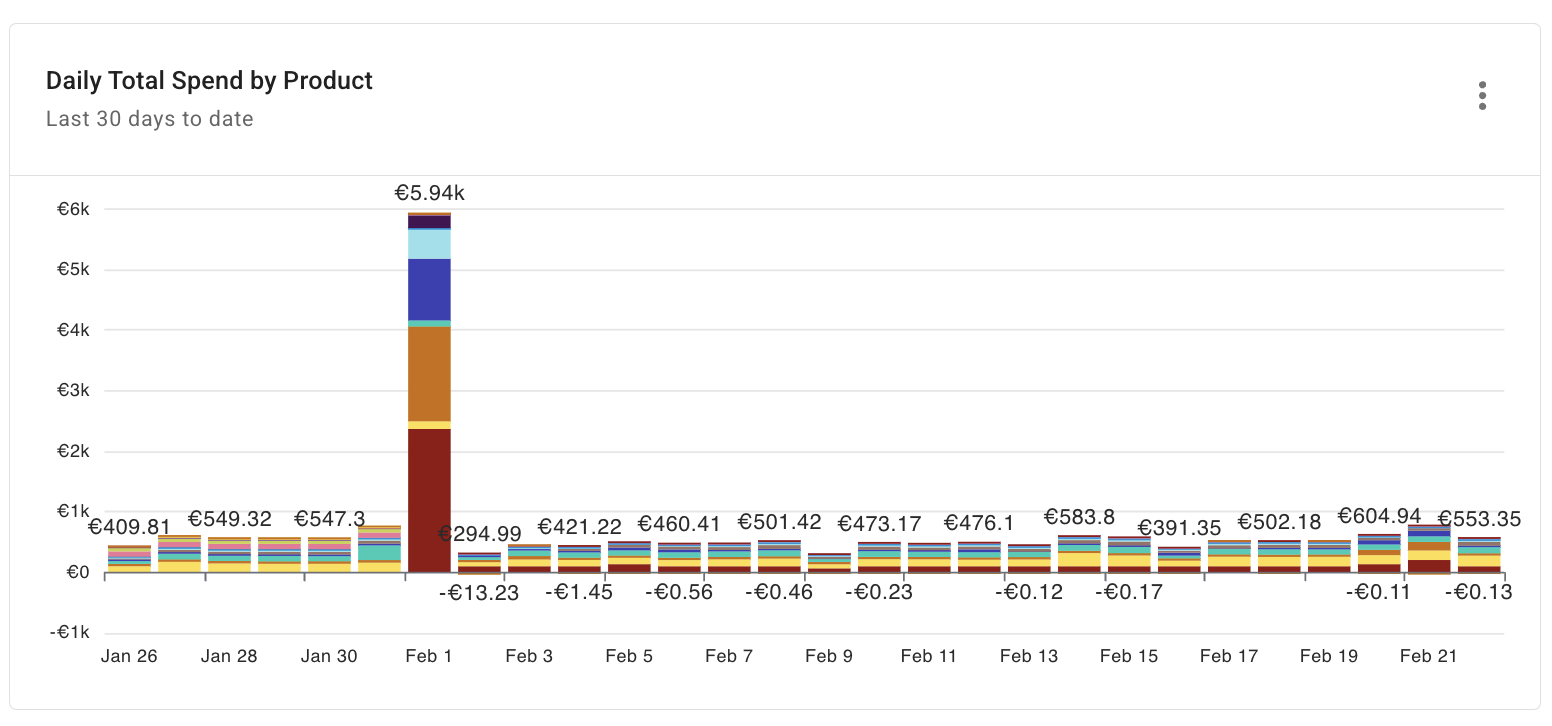
Daily total spend by product
Provides a day-to-day total of the current month's Datadog product and service costs. Instead of waiting for a monthly bill, this report enables you to track daily spending trends.
Report configuration:
- Metric: Cost
- Time Range: Last 30 days with current
- Time Interval: Day
- Filters:
- Provider equals
Datadog
- Provider equals
- Group by: Service, SKU
- Limit results:
- Limit by value: Cost ≠ 0
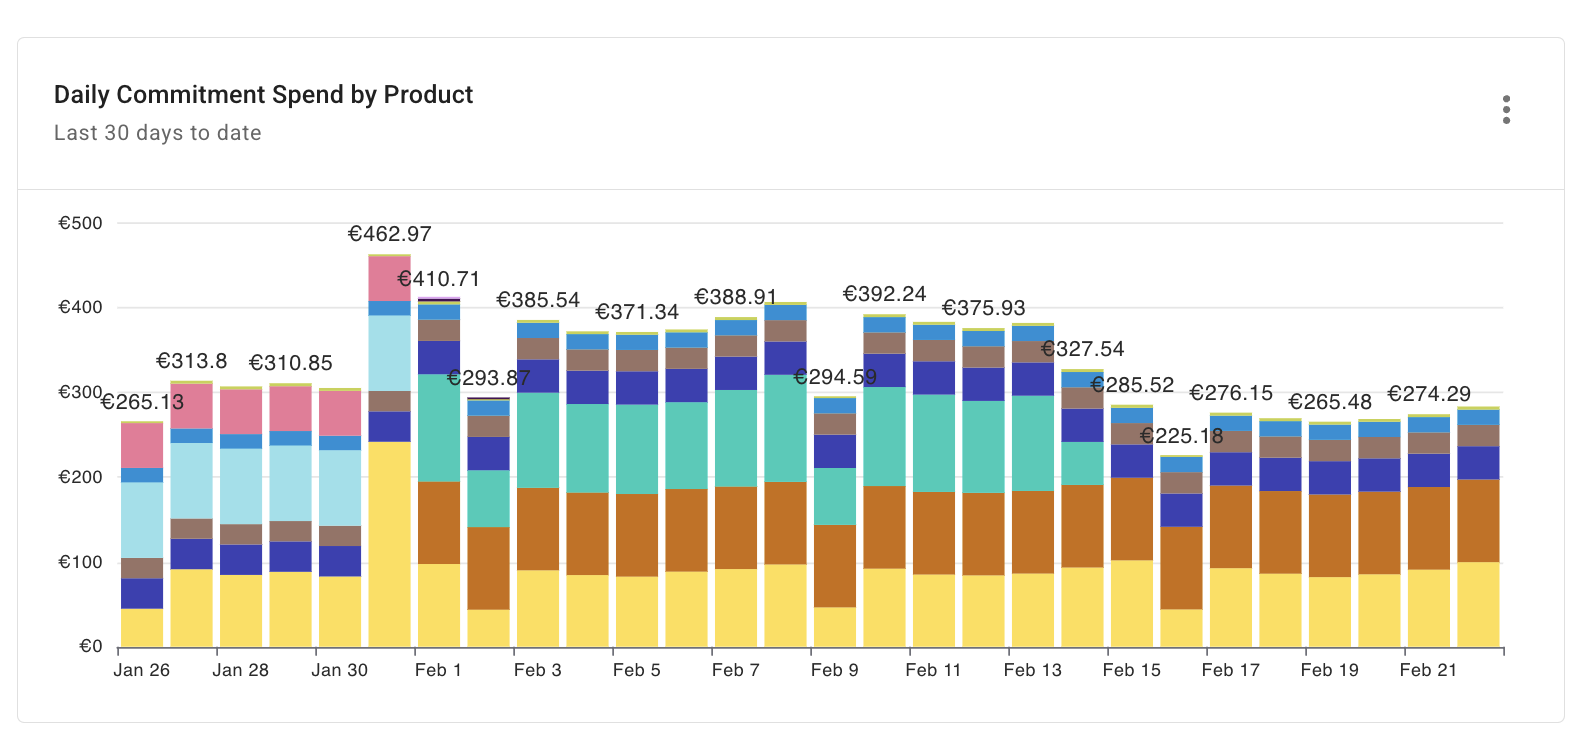
Daily commitment spend by product
Shows the daily commitment cost of your Datadog products and services for the current month to date. This report helps you track your commitment costs for the current month to date.
Report configuration:
- Metric: Cost
- Time Range: Last 30 days with current
- Time Interval: Day
- Filters:
- Provider equals
Datadog - Cost Type equals
Commitment
- Provider equals
- Group by: Service
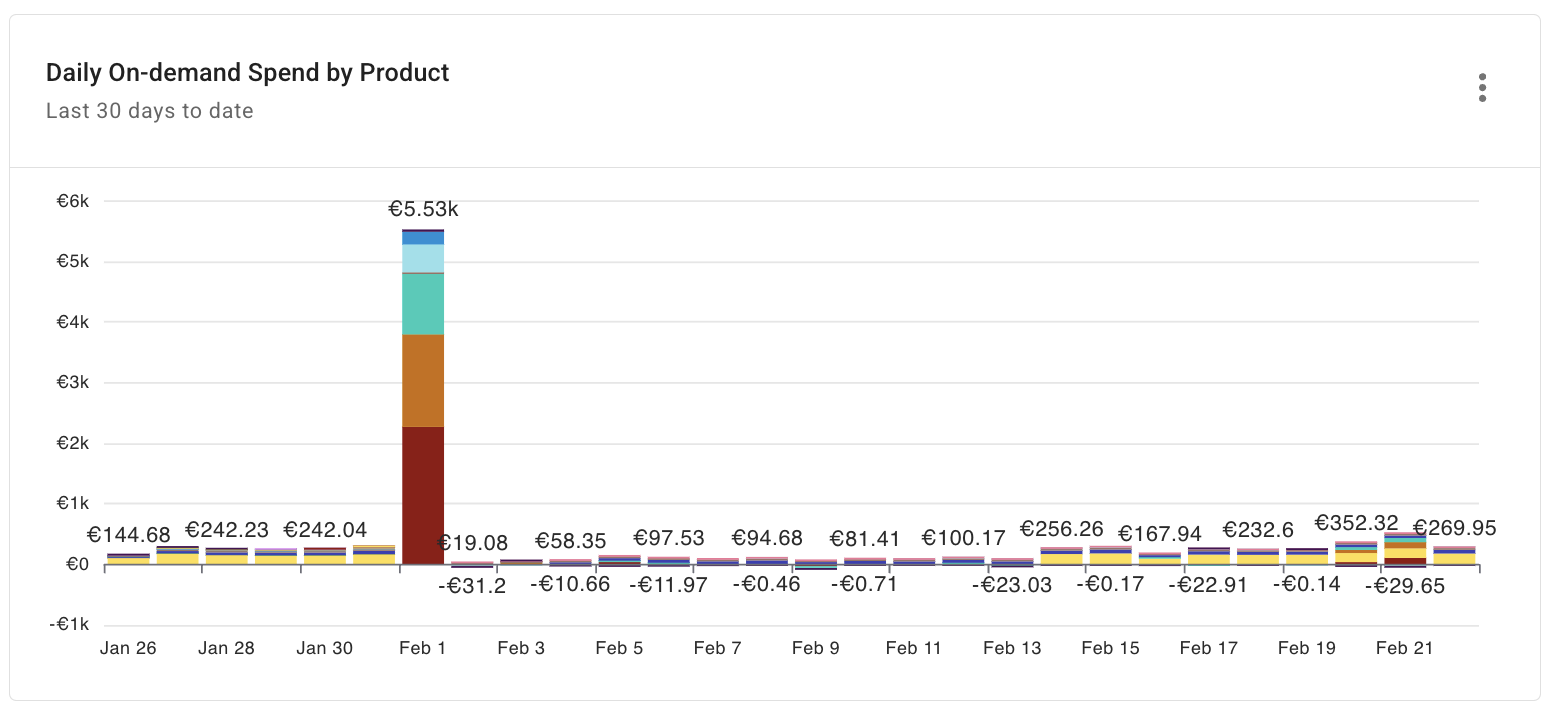
Daily on-demand spend by product
Shows the daily pay-as-you-go costs of your Datadog products and services for the current month. This report helps you determine whether switching services to a commitment-based plan could reduce costs.
Report configuration:
- Metric: Cost
- Time Range: Last 30 days with current
- Time Interval: Day
- Filters:
- Provider equals
Datadog - Cost Type equals
Usage
- Provider equals
- Group by: Service
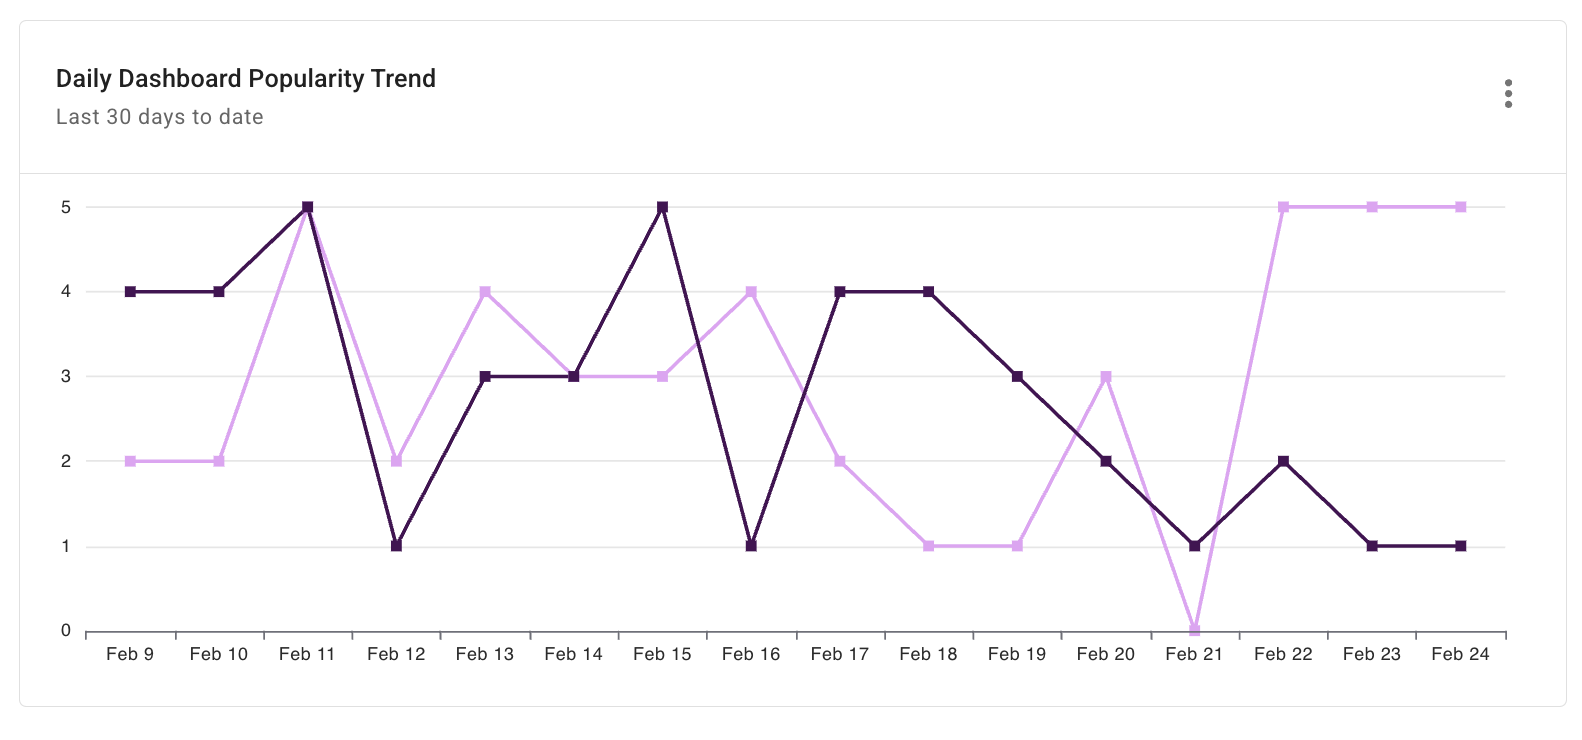
Daily dashboard popularity trend
Identifying which Datadog dashboards are popular in your organization is useful. It provides insights into priorities and areas of focus, helping improve monitoring practice and facilitate collaboration.
This widget shows the top dashboards by usage (popularity) in the last 30 days.
Report configuration:
- Metric: Usage
- Time Range: Last 30 days with current
- Time Interval: Day
- Filters:
- Provider equals
Datadog - Service equals
Dashboard Usage
- Provider equals
- Group by:
- System label:
datadog/dashboard_name - System label:
datadog/dashboard_list_name
- System label:
The DoiT console utilizes the popularity metric returned by the Datadog Get items of a Dashboard List API. The popularity metric is applicable only to dashboards that belong to a dashboard list. To retrieve the status of the popularity metric, we need to sample your Datadog data for 30 days.
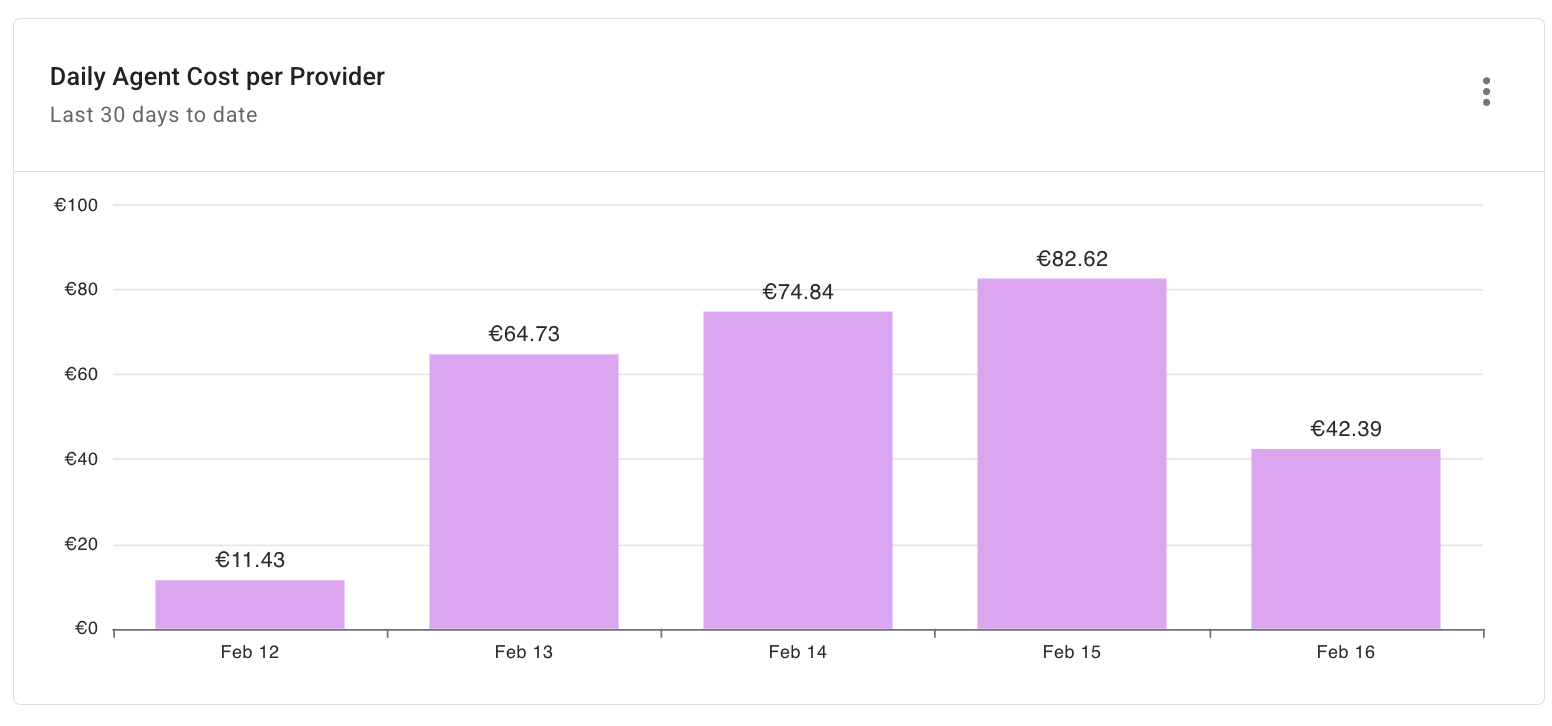
Daily agent cost per provider
Once a Datadog agent is installed, costs can rise and it's not always easy to see which resources are driving which costs.
The Daily cost per cloud provider driven by agent widget shows the daily cost of cloud providers that host Datadog agents for the current month. You can further break down the costs by the agent version or other dimensions, for example, system labels prefixed by datadog/host_.
Report configuration:
- Metric: Cost
- Time Range: Last 30 days with current
- Time Interval: Day
- Filters:
- Provider ≠
Datadog - System Label
datadog/host_is_activeequalsTrue
- Provider ≠
- Group by: Provider
When monitoring host costs in the DoiT console, note that:
-
To see the host costs of a cloud provider, you must first connect your cloud account of the provider with DoiT.
-
DoiT updates host costs once per day. If a Datadog agent was removed or added during the day, the data may not be reflected in the DoiT console.