Resource details
When viewing the recipe results in table view, you can select a resource to open its details panel.
The panel organizes information across several tabs, giving you a comprehensive view of the resource and its context within your cloud environment.
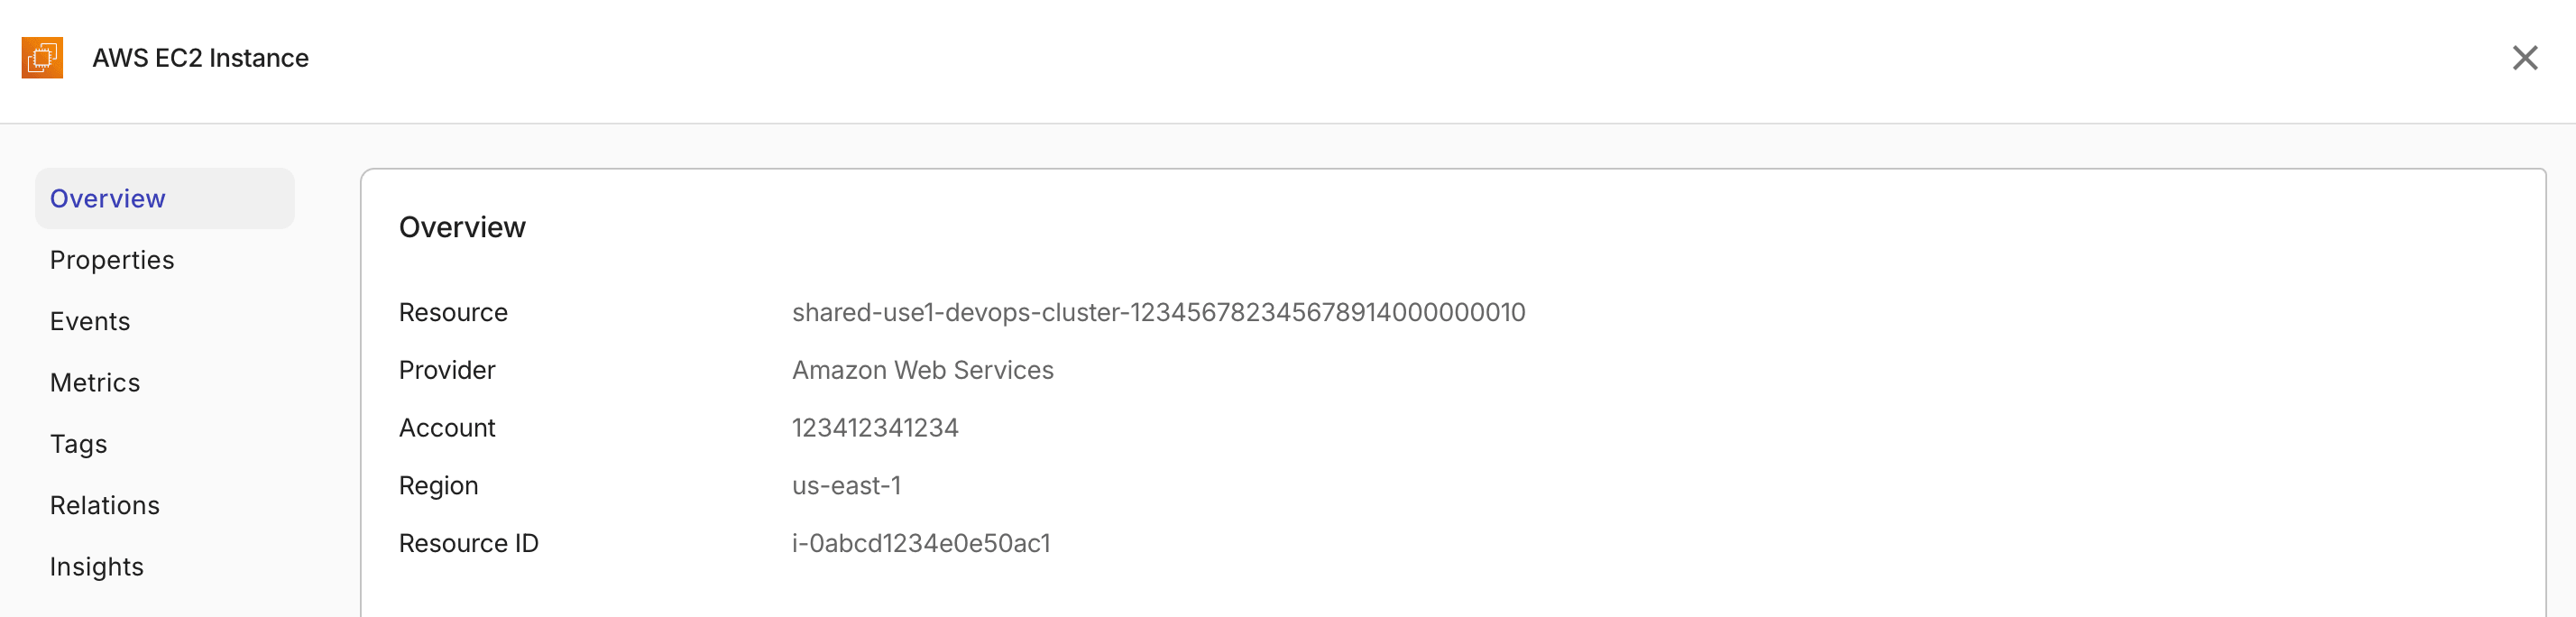
Overview
The Overview tab displays a summary of the resource's key attributes.
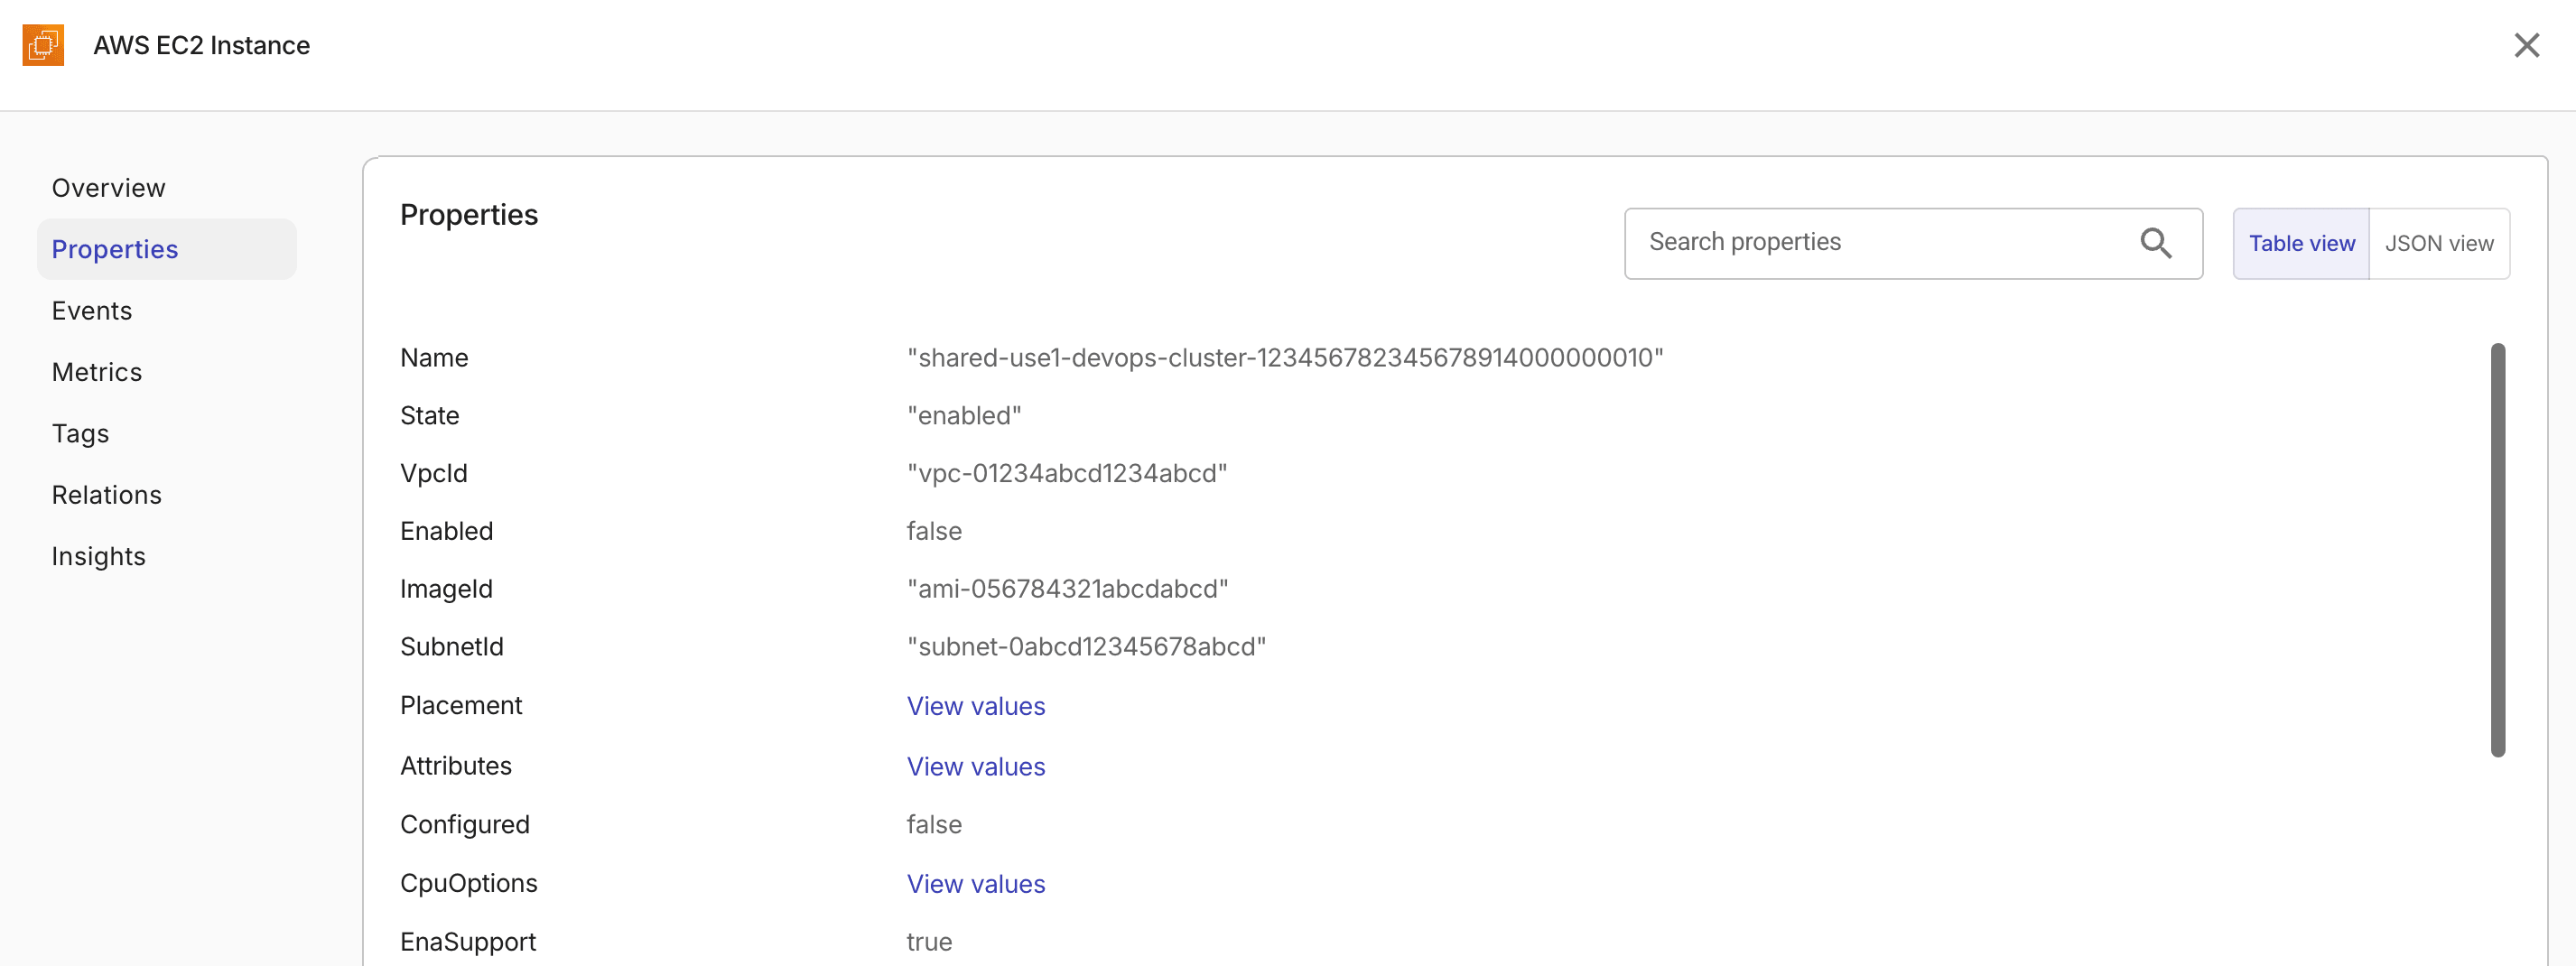
Properties
The Properties tab shows detailed configuration properties of the resource.
You can search for specific properties, or switch between the table and JSON views.
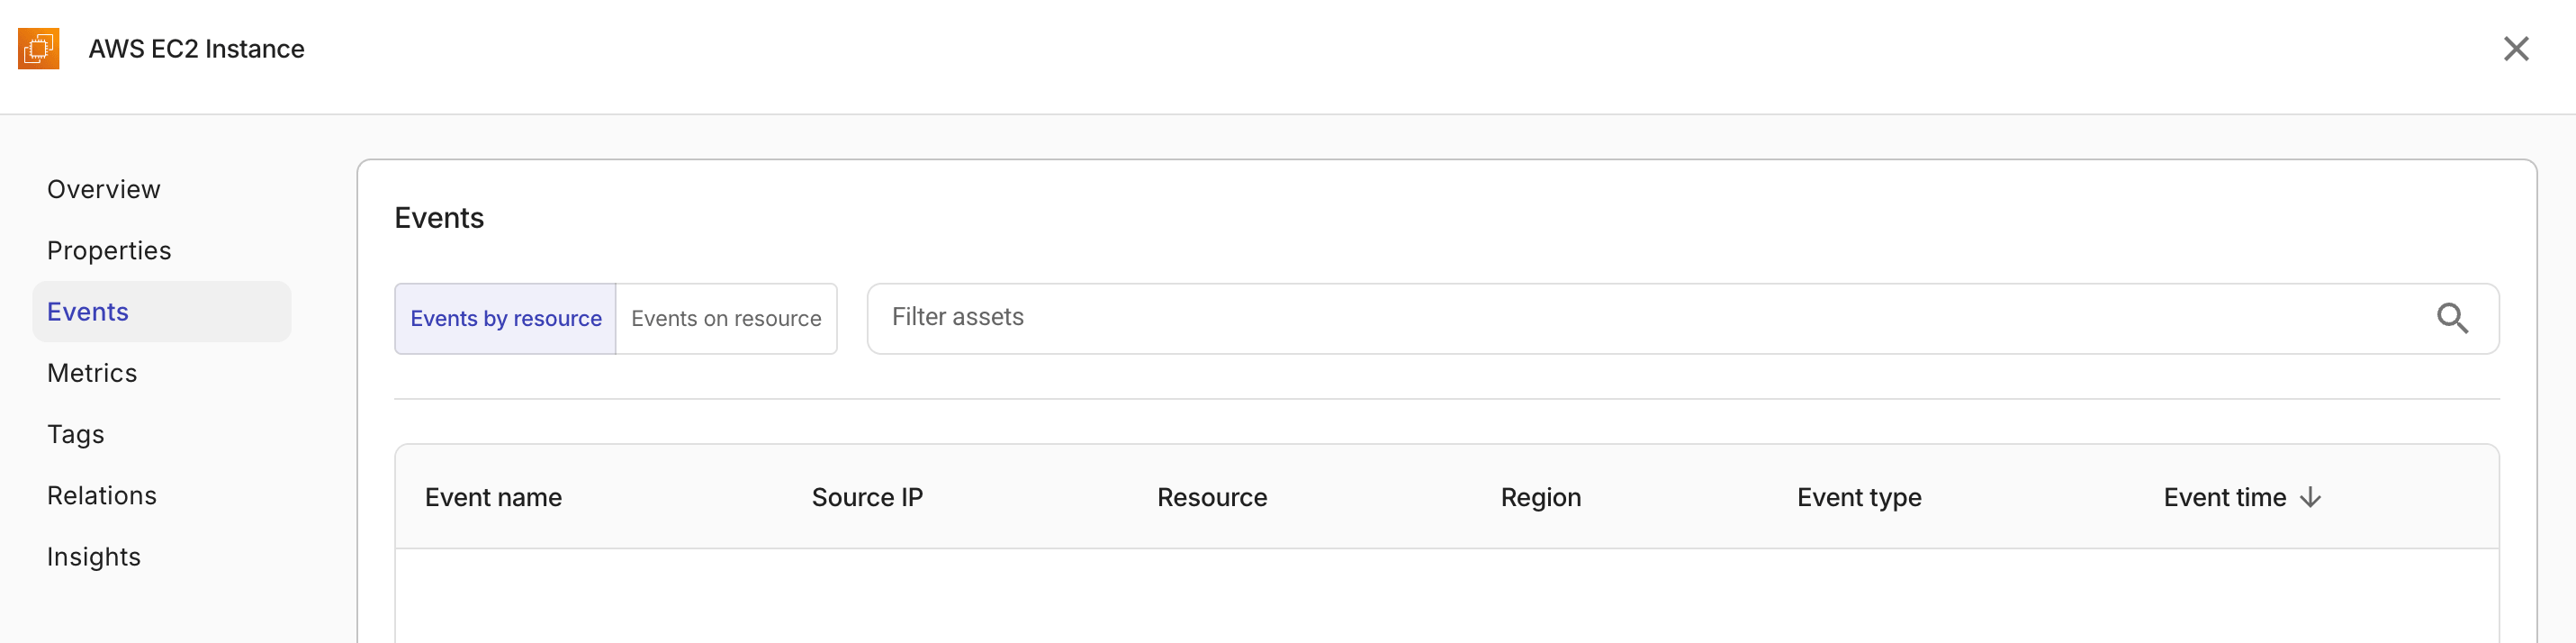
Events
The Events tab displays events associated with the resource.
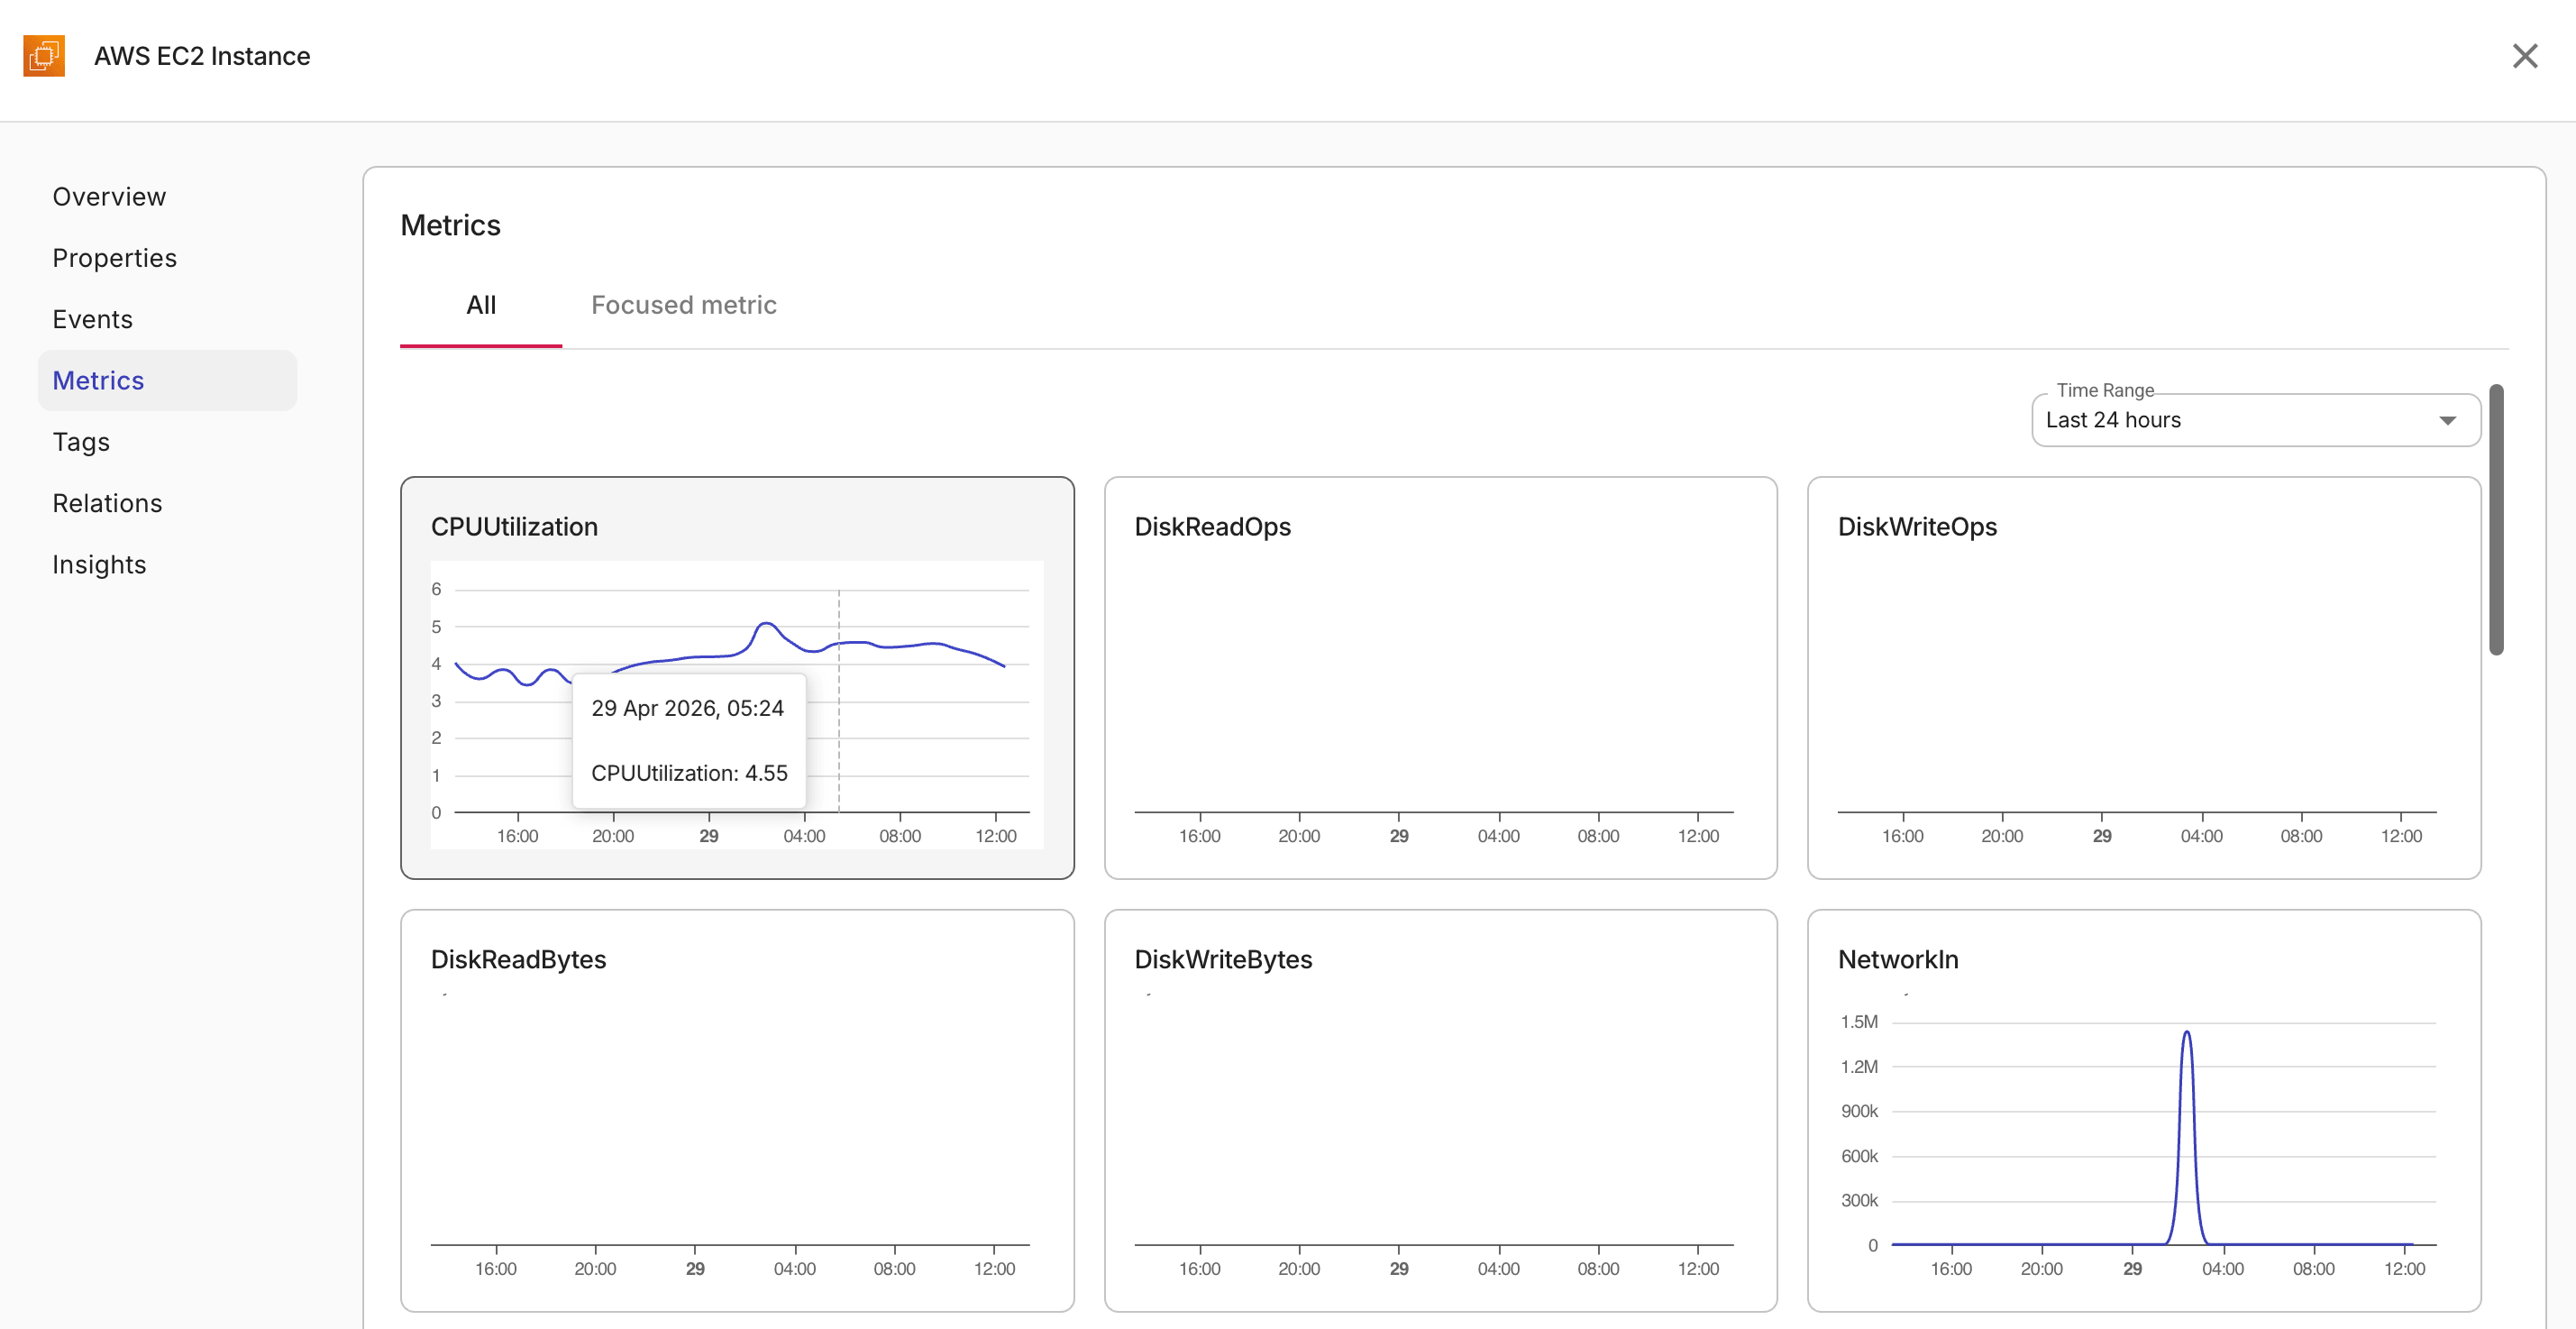
Metrics
For resource types that have metric data, the Metrics tab displays performance metrics for the resource.
The Metrics tab has two views:
-
All. Displays a grid of metric cards, each for a specific metric. You can use the Time range option to adjust the time window for all charts. Available time ranges are last hour, last 3 hours, last 12 hours, last 24 hours, last 7 days, and last 30 days. Select any metric card will open it in the Focused metric view.
-
Focused Metric. Displays a single metric with additional controls:
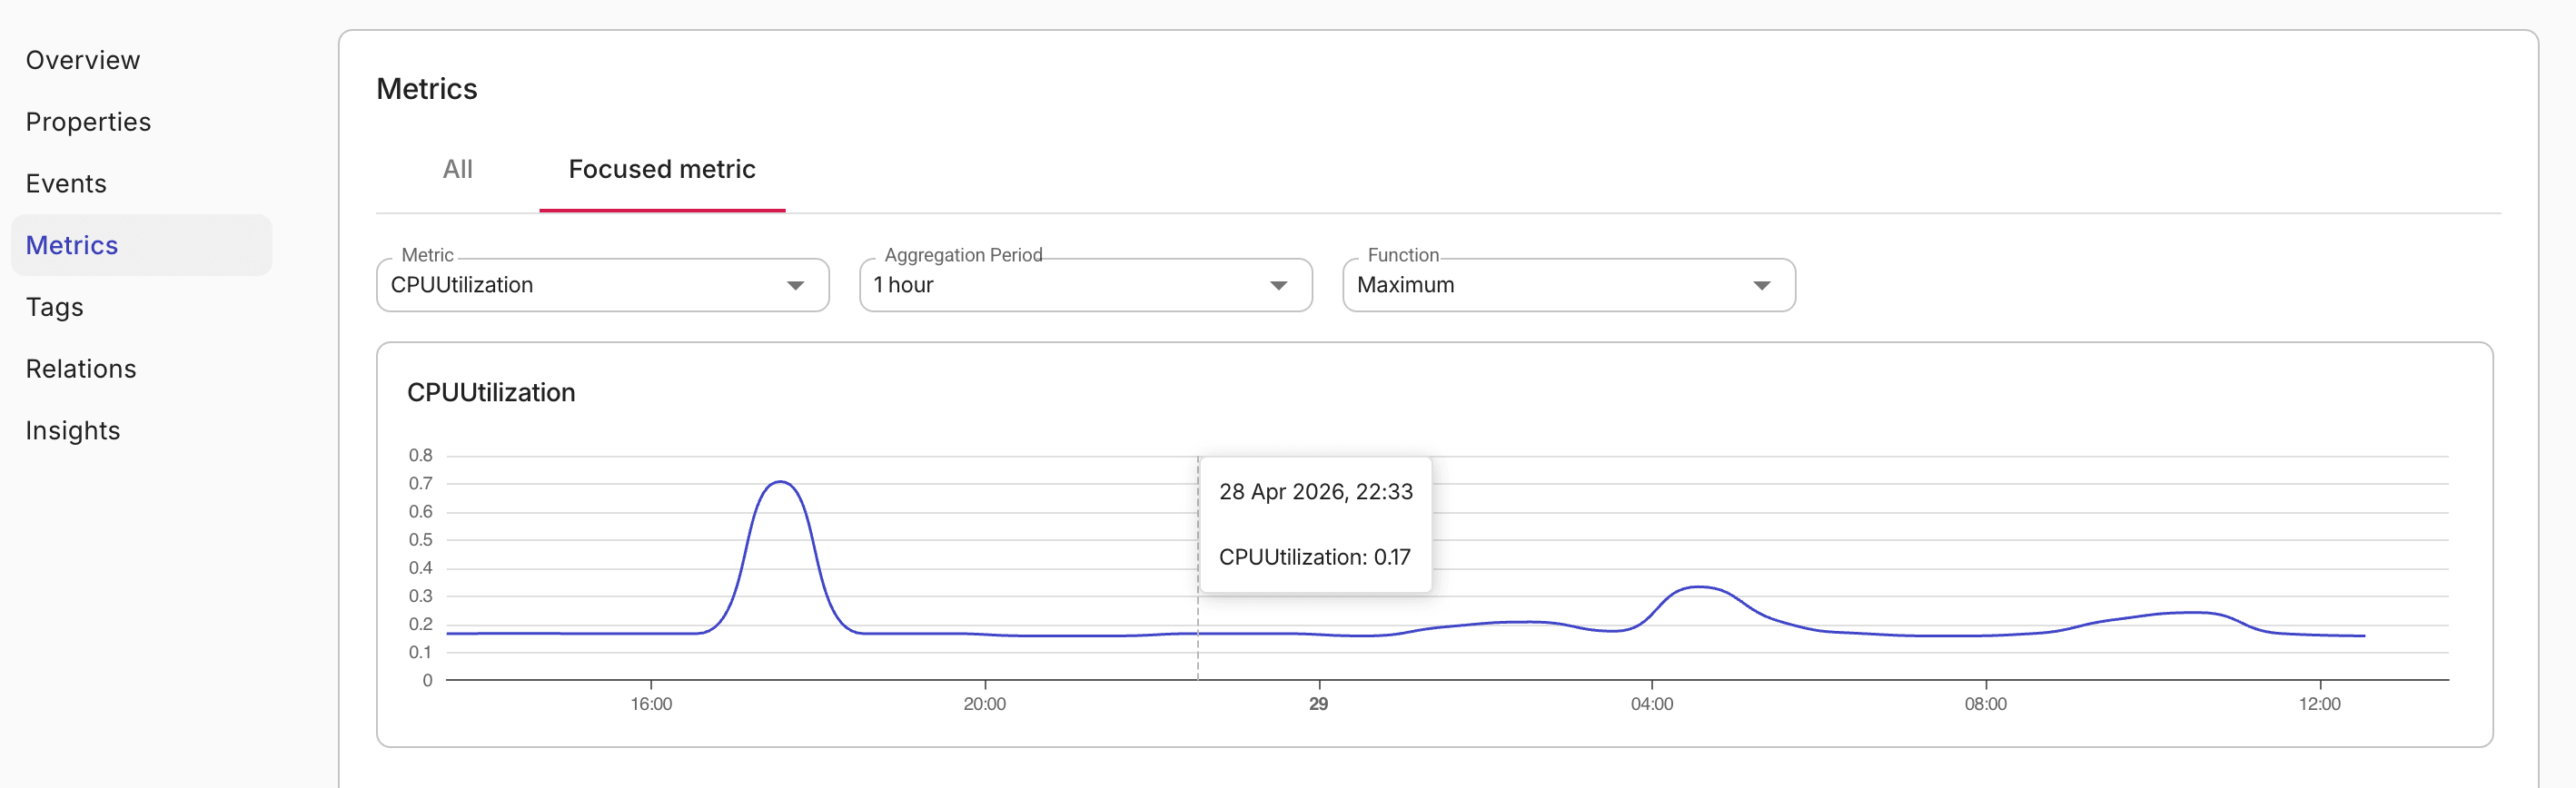
-
Metric: Select a metric to display.
-
Aggregation period: Choose the time interval for data aggregation. For example, 5 minutes, 1 hour, or 1 day. The available periods depend on the selected metric.
-
Function: Choose the aggregation function. For example, Maximum, Minimum, Average. The available functions depend on the selected metric.
-
Cost
The Cost tab displays billing cost data for the resource over the previous month. Cost values are displayed in your organization's configured currency.
The Cost tab is available for resources from the following cloud providers:
- Amazon Web Services (AWS)
- Google Cloud (GCP)
- Microsoft Azure
The Cost tab is hidden for resource types from other cloud providers. For supported providers, the tab may still be empty when there is no matching billing data for the previous month.
For Azure Kubernetes Service (AKS) clusters, the Cost tab shows only the infrastructure cost of the cluster's node pools. Azure creates a separate managed resource group for node pool VMs and related resources; costs billed in that resource group are attributed to the cluster.
The displayed cost does not include resources deployed outside that managed resource group, such as load balancers created by ingress controllers or persistent volumes provisioned in other resource groups.
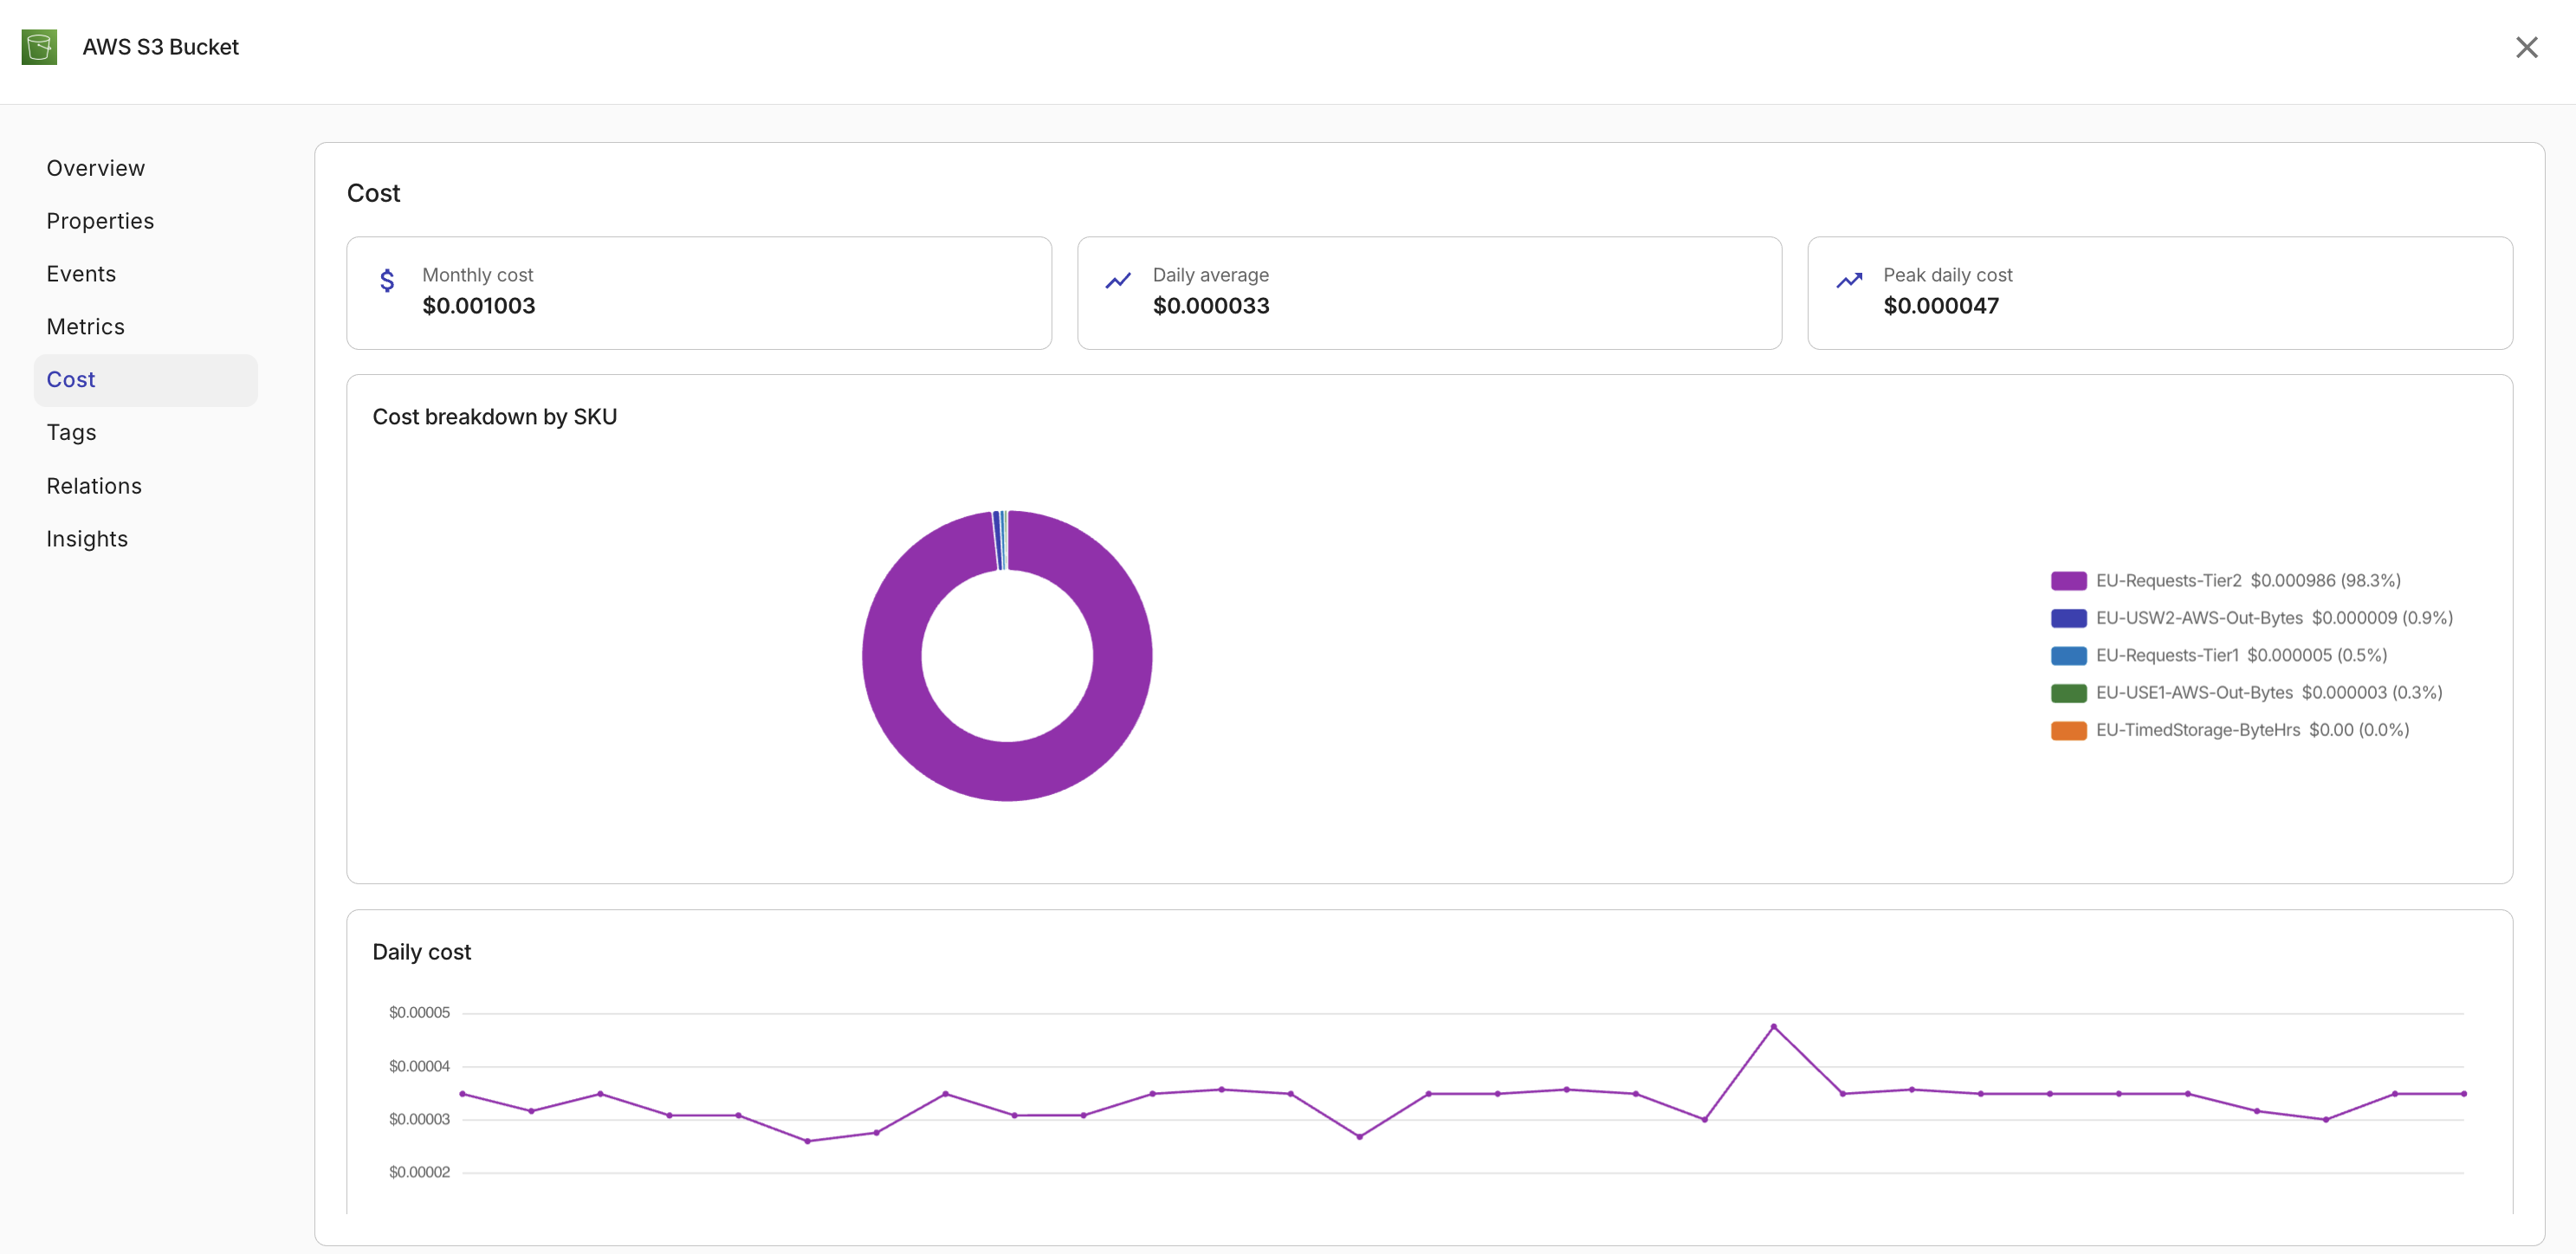
The Cost tab displays the following metrics:
-
Monthly Cost: The total cost for the previous month.
-
Daily Average: The average daily cost over the previous month.
-
Peak Daily Cost: The highest single-day cost during the previous month.
A Cost breakdown by SKU pie chart shows how costs are distributed across SKU descriptions. The chart displays the top 10 SKUs by cost, with any remaining SKUs grouped under Other SKUs.
A Daily cost line chart shows the day-by-day cost trend for the previous month.
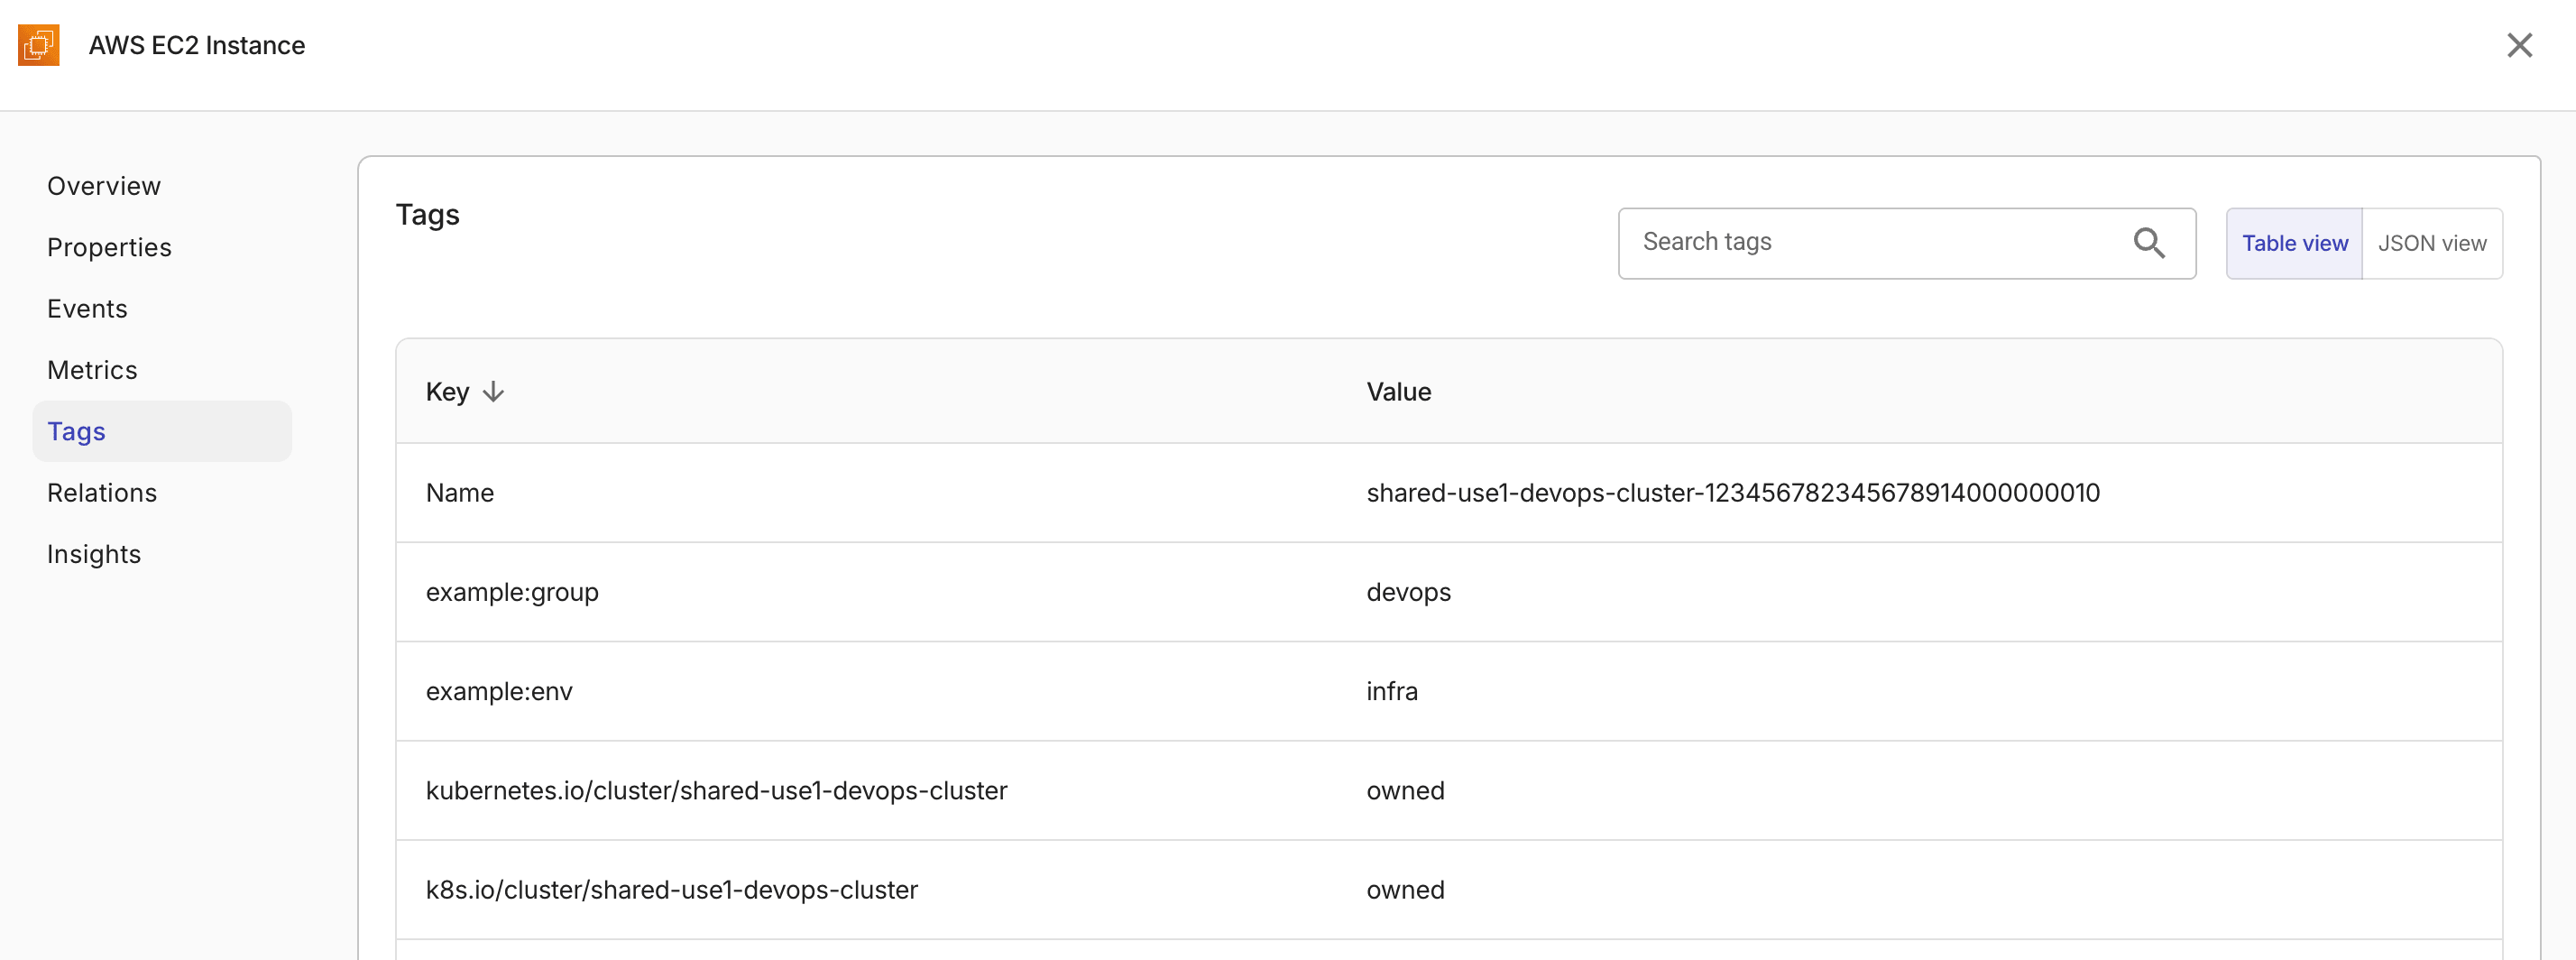
Tags
The Tags tab displays tags (key-value pairs) associated with the resource.
You can search for specific tags, or switch between the table and JSON views.
Relations
The Relations tab shows all resources that are related to the current resource, such as parent resources, child resources, or other dependencies within the same account. It helps you understand resources dependencies and connections in your cloud infrastructure.
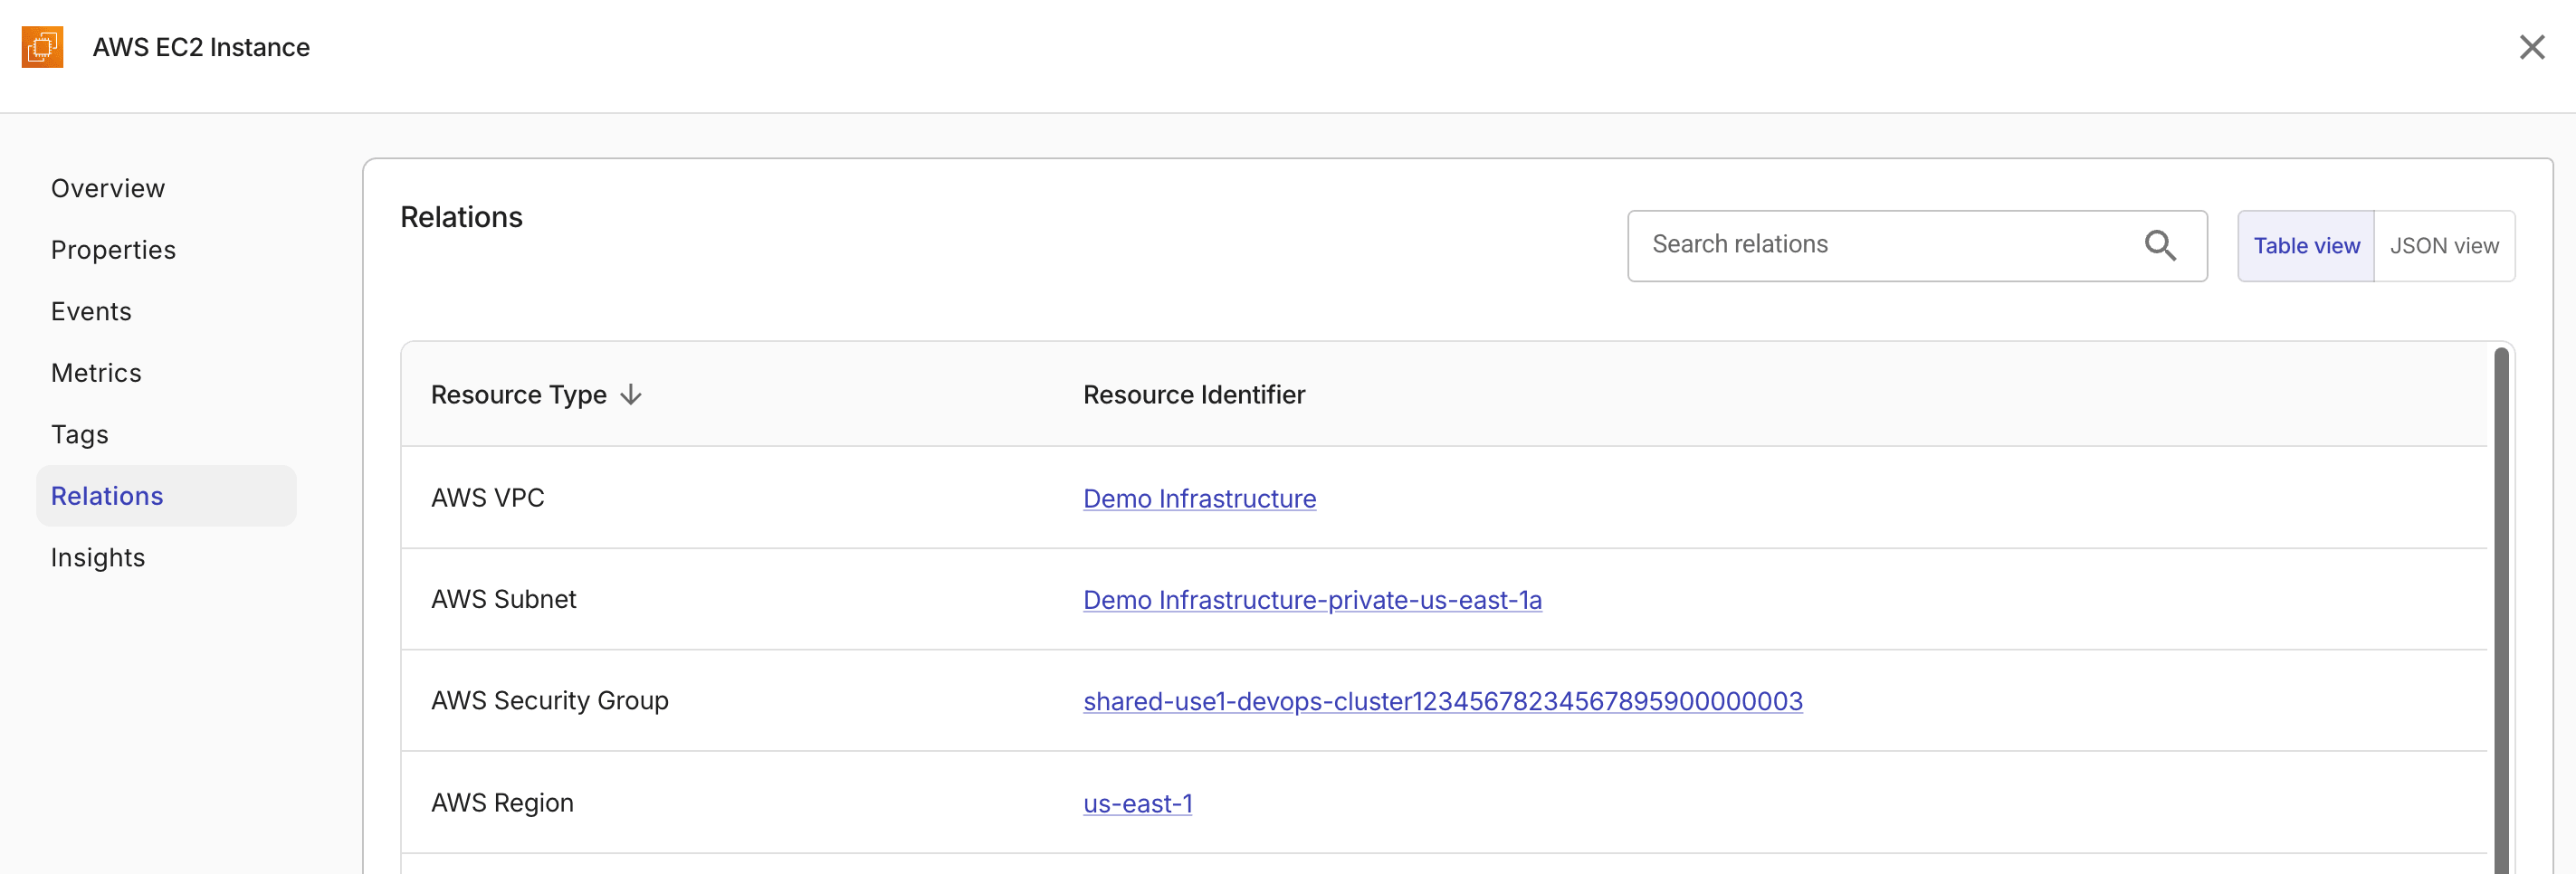
You can filter relations by resource type or identifier, or switch between the table and JSON views.
-
Selecting a resource identifier in the table view opens the resource's details panel.
-
The JSON view displays the raw relation data, including fields such as source and target identifiers, relation type, and properties.
Insights
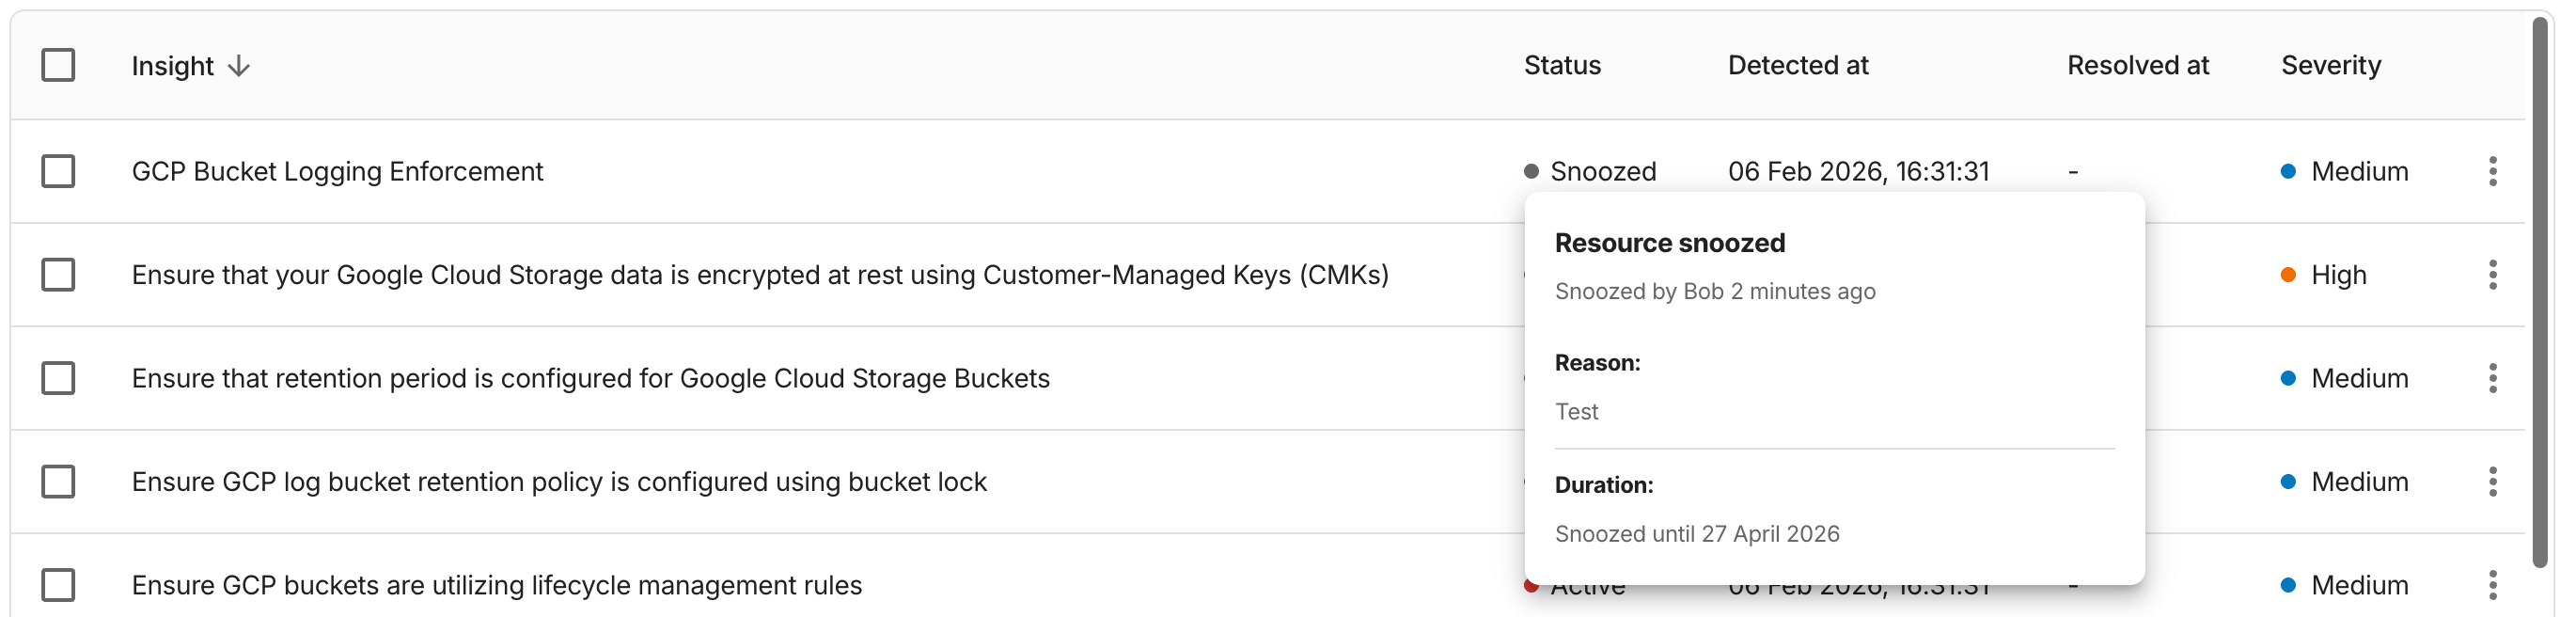
The Insights tab displays active Insights associated with the resource. Each row in the table represents an insight result, showing the insight name, status, severity, and detection and resolution timestamps.
You can search for specific insights by name, or select an insight name to open the insight details page.

Each insight displays one of the following statuses:
-
Active: The insight is currently active for this resource.
-
Resolved: The issue that caused the insight has been resolved.
-
Snoozed: The insight has been temporarily snoozed. Select the status to view snooze details, including who snoozed it, when, and for how long.
Snooze a resource
You can snooze a resource for a specific insight. Snoozing a resource for one insight does not affect other insights related to the same resource.
To snooze a resource:
-
Locate the insight of interest, select the kebab menu (⋮) at the rightmost end of the row, and then select Snooze resource for this Insight.
Alternatively, select one or more insights using the checkboxes, select Actions, and then select Snooze resources for the selected Insights.
-
Choose the snooze duration:
-
Snooze indefinitely: The resource remains snoozed until manually unsnoozed.
-
Snooze for a specific duration: Select an end date using the date picker.
-
-
Enter a reason for snoozing the resource (maximum 1,000 characters).
-
Select Snooze.
Ask an expert
If you need further guidance on one or more insights, select Ask an expert from the kebab menu or the Actions button to create an expert inquiry.