Create custom metrics
In the DoiT console, custom metrics are defined using base metrics (basic metrics, extended metrics, and DataHub metrics) and allocations. The allocations must already exist before you can create a custom metric out of them.
Required permissions
- Cloud Analytics User, Metrics Manager
Create a metric
You can create a new metric either from scratch or based on an existing one.
To create a new metric from scratch:
-
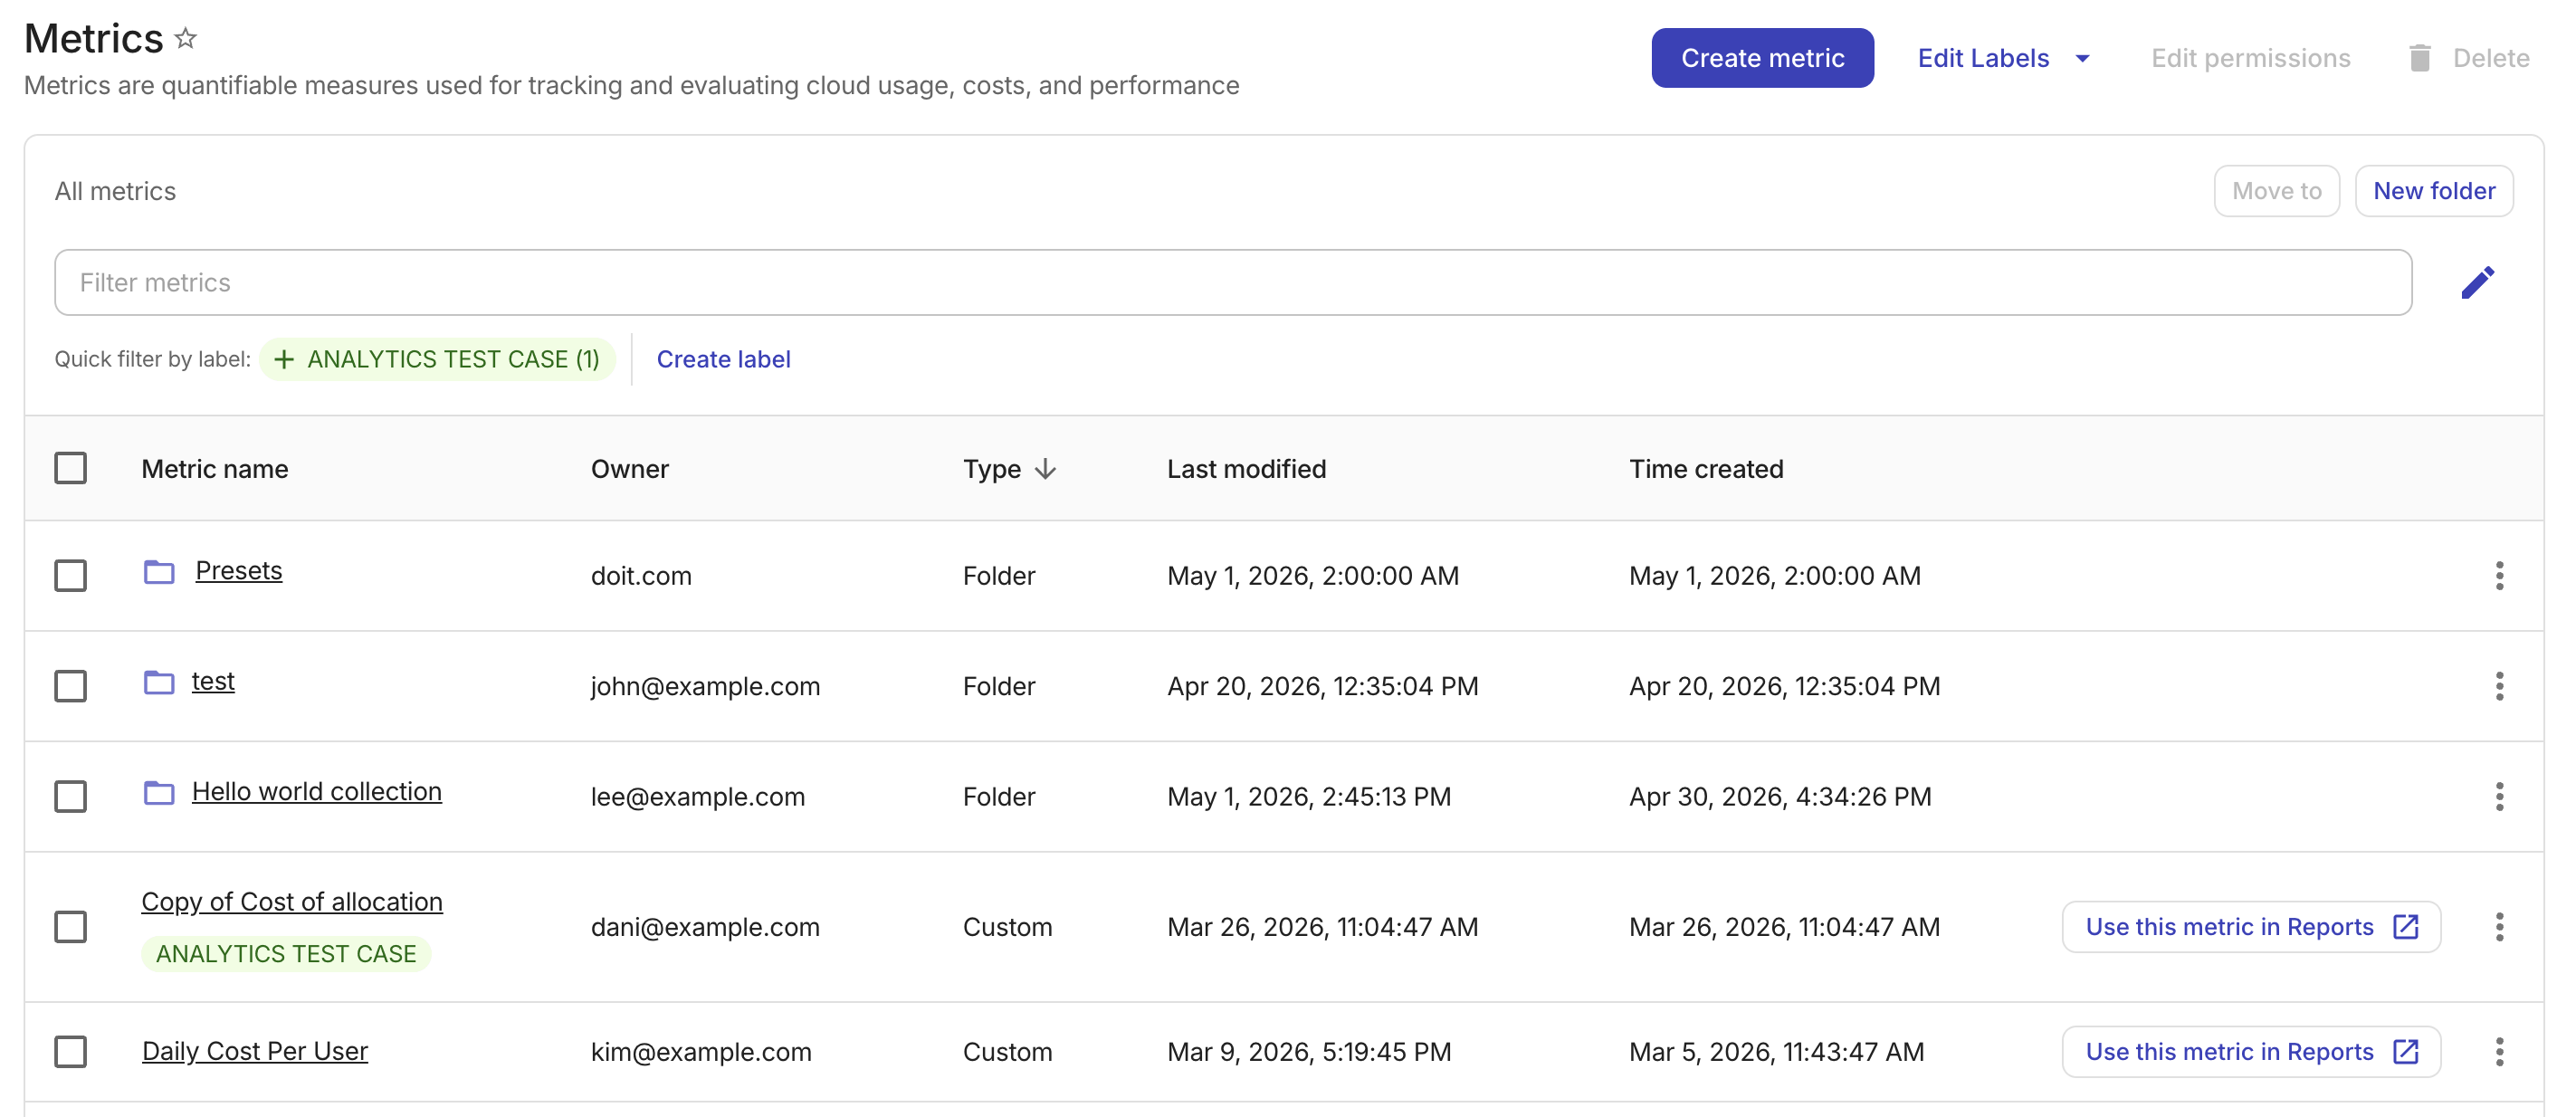
Sign in to the DoiT console, select Reporting and analytics from the top navigation mega menu, and then select Metrics.
-
Select Create metric in the upper-right corner.
To make a copy of an existing metric, follow either of the approaches below:
-
On the main Metrics screen, select the kebab menu (⋮) at the rightmost end of the metric entry, and then select Duplicate.
-
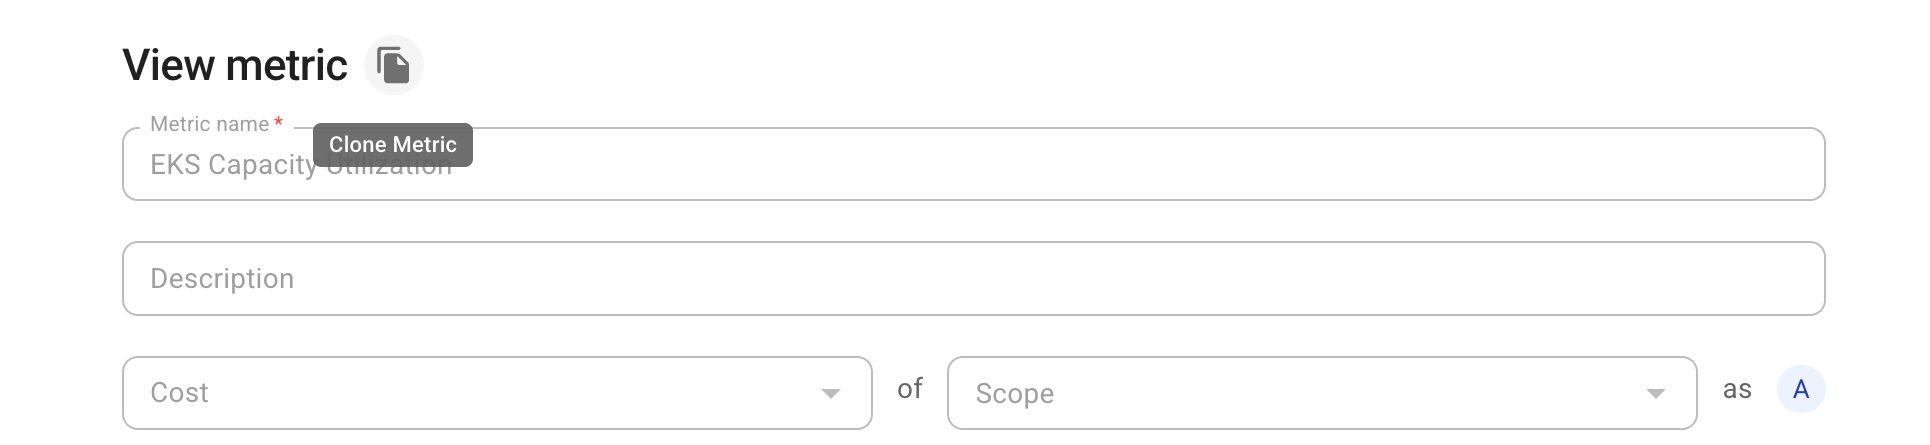
On the configuration page of the metric, select the Clone metric icon.
Configure the metric
-
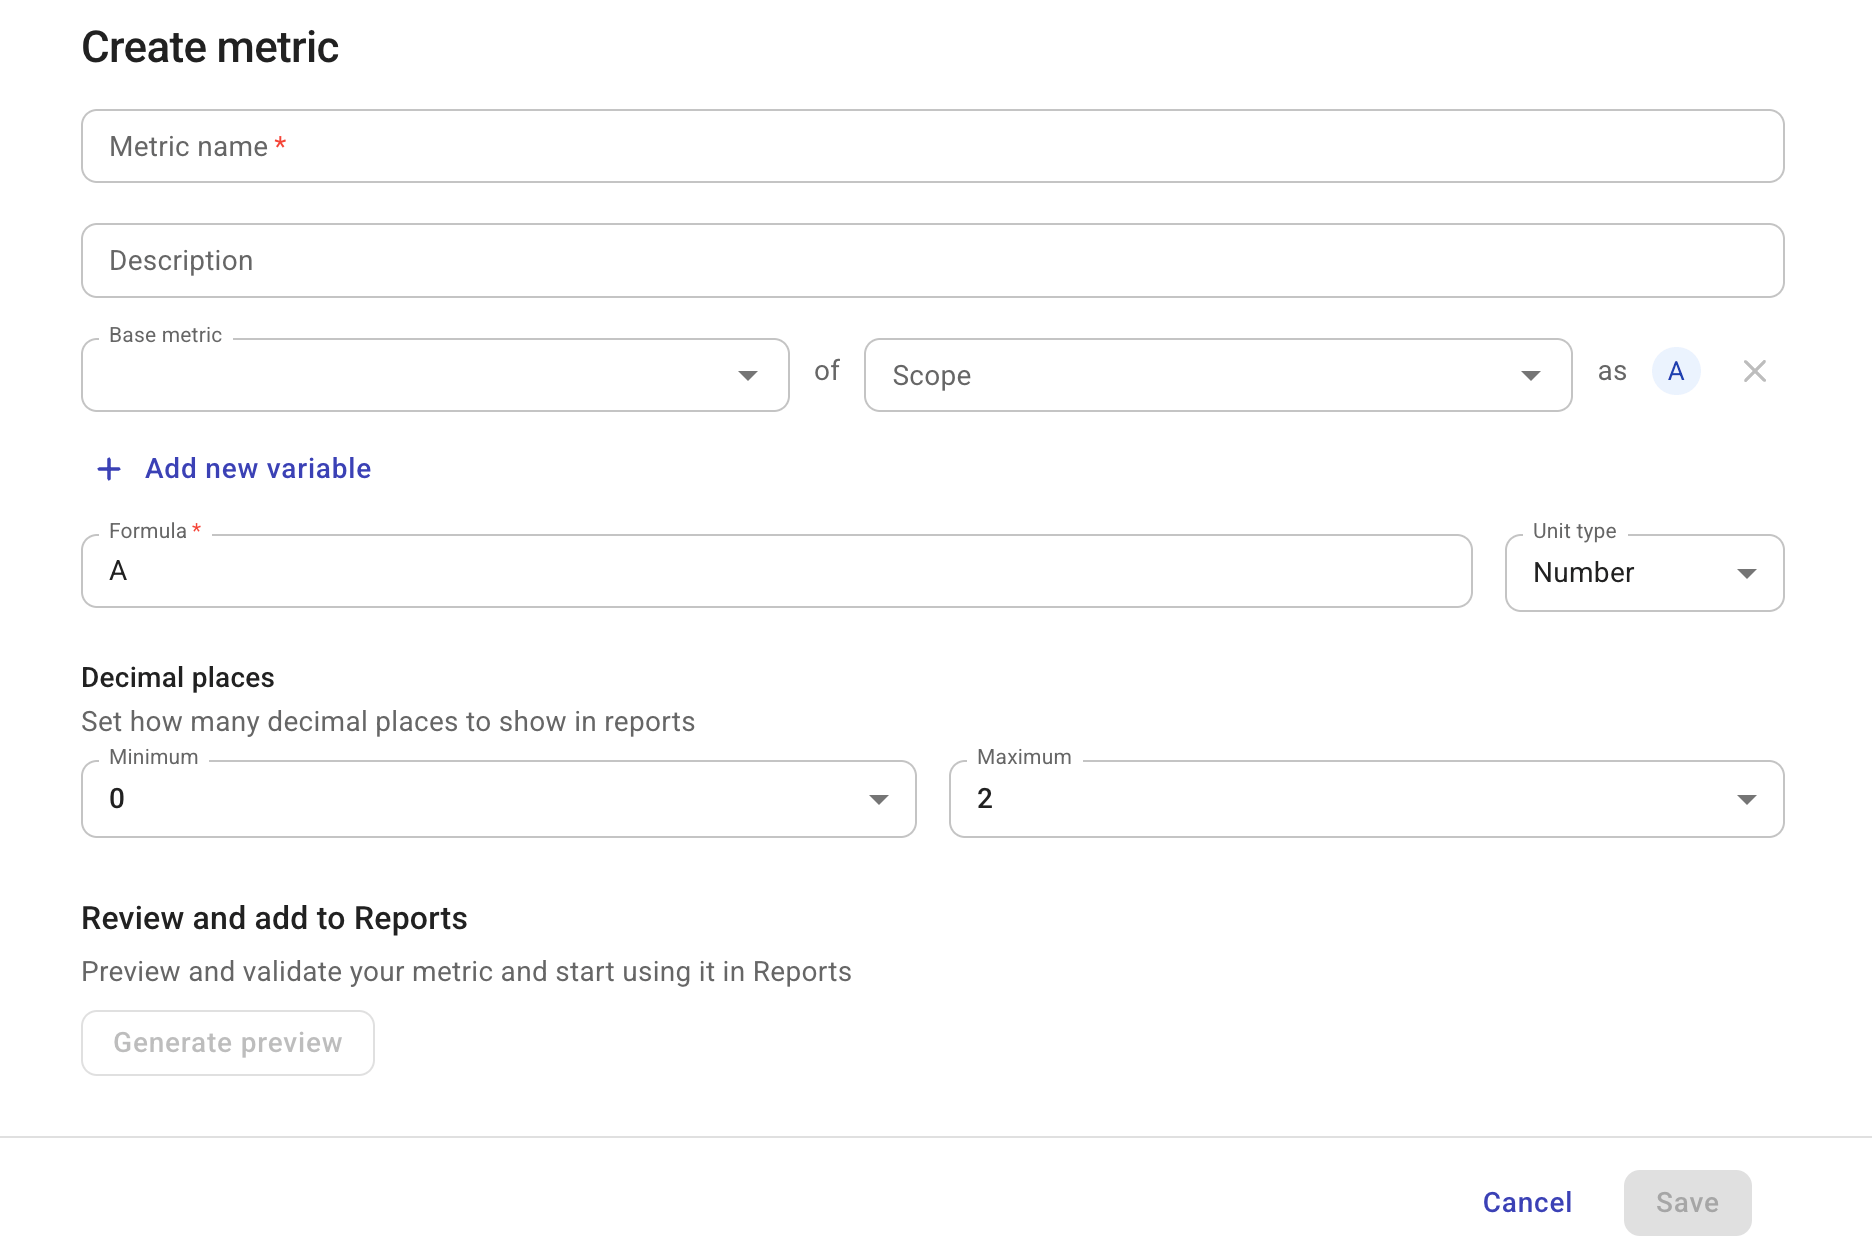
Enter a name for the new metric. You can also add a description to the metric.
-
Define metric variables. Each variable consists of two parts:
-
base metric: This could be a basic metric, an extended metric, or a DataHub metric.
-
scope: An allocation rule.
Select Add new variable to add more if necessary.
-
-
Formulate your metric.
-
The variables defined in the previous step are indicated as variables
A,B,Cetc., according to the order they are defined. -
Supported operators:
+,-,*,/,(, and). Custom metric formulas support standard order of operations. -
You also need to set the unit type for the metric: Number, percentage (%), or Currency.
-
-
Specify the minimum and maximum number of decimal places (digits to the right of the decimal point) to display in reports. The supported range is
0–5.By default, the minimum decimal places value is
0, and the maximum is2. -
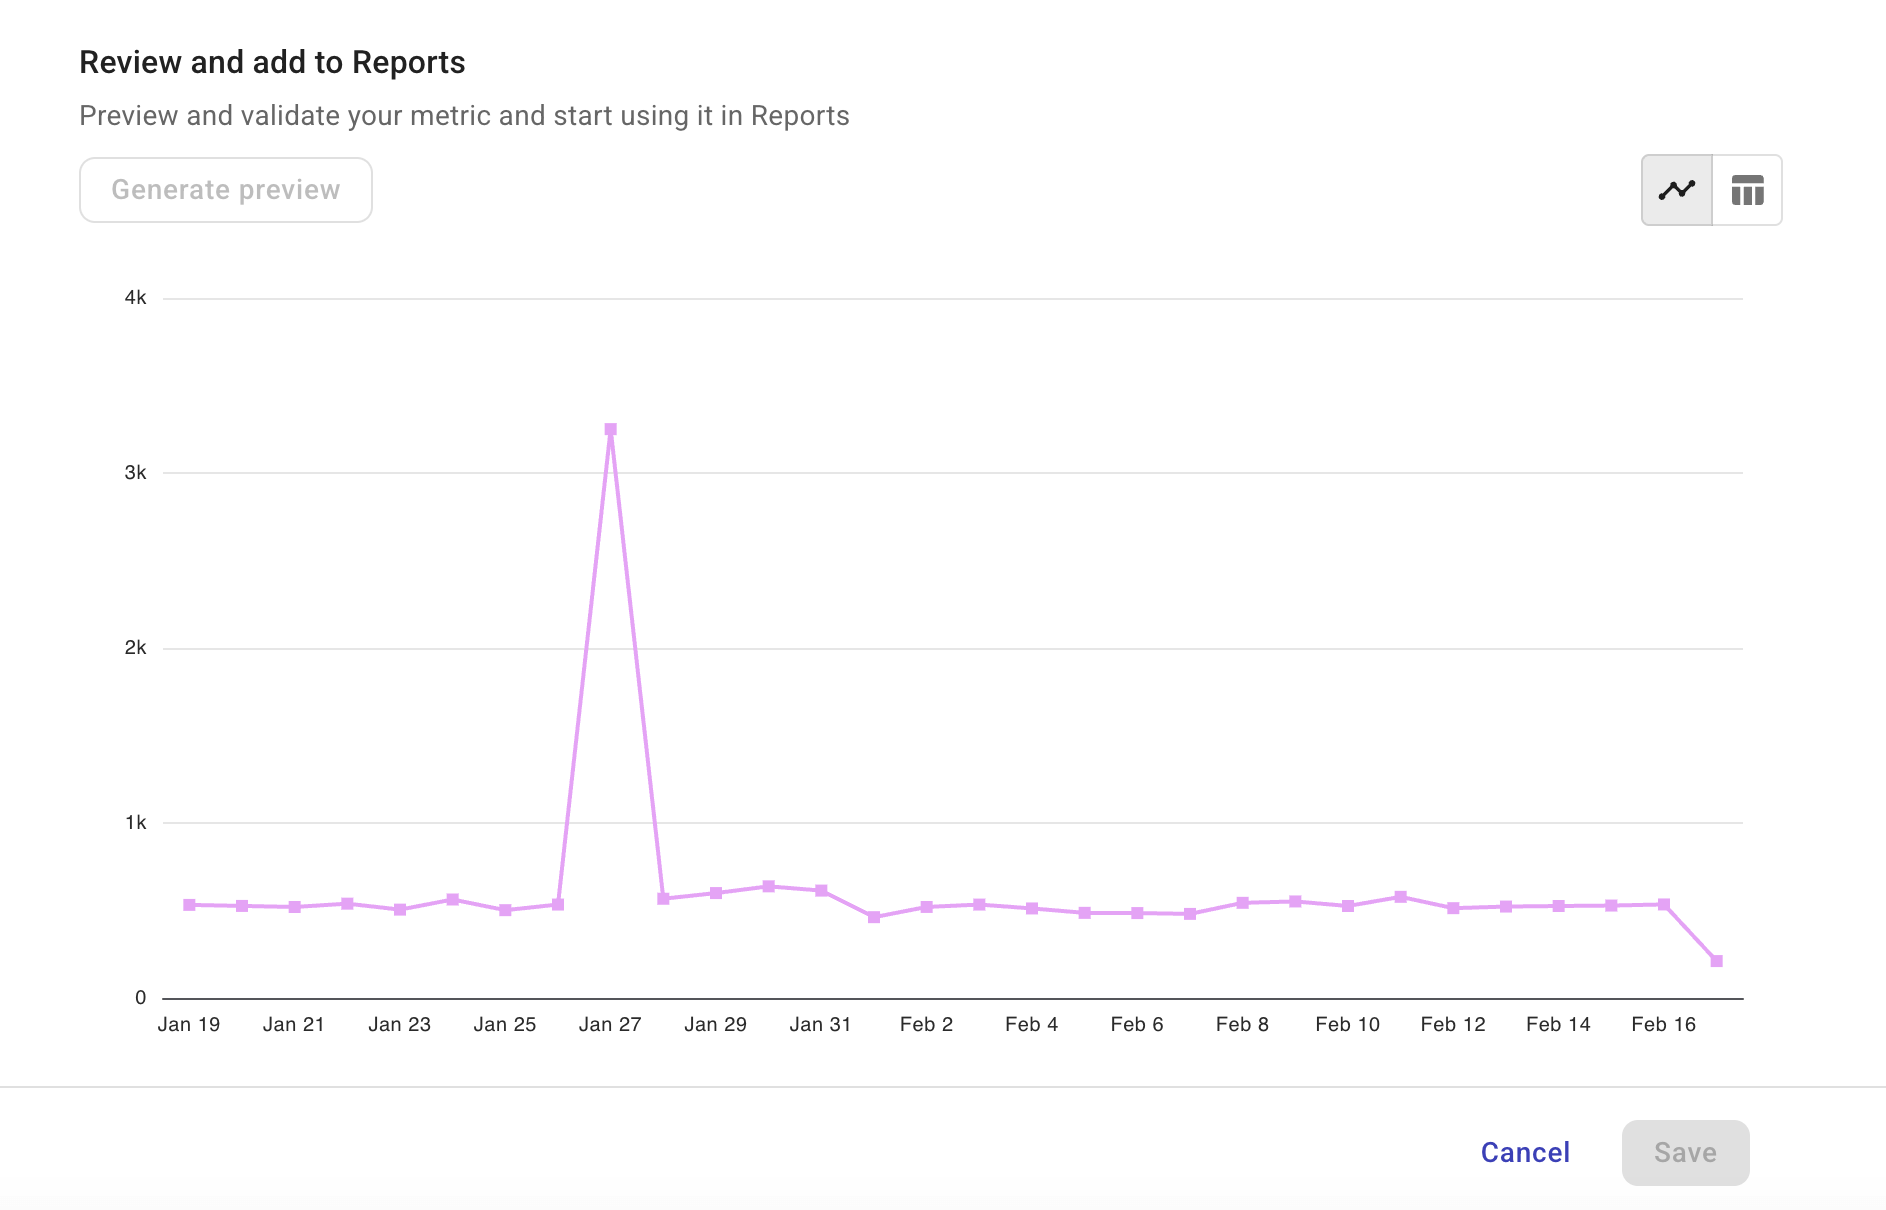
(Optional) Select Generate preview to validate your metric.
You can switch between the Line Chart view and the Table view.
-
Save your configuration.