Accounts overview
The Accounts Overview page gives you visibility into your existing commitments across payer and billing accounts, as well as at the individual account level.
Required permissions
- PerfectScale Commitments Admin, or PerfectScale Commitments Read Only
Accounts Overview
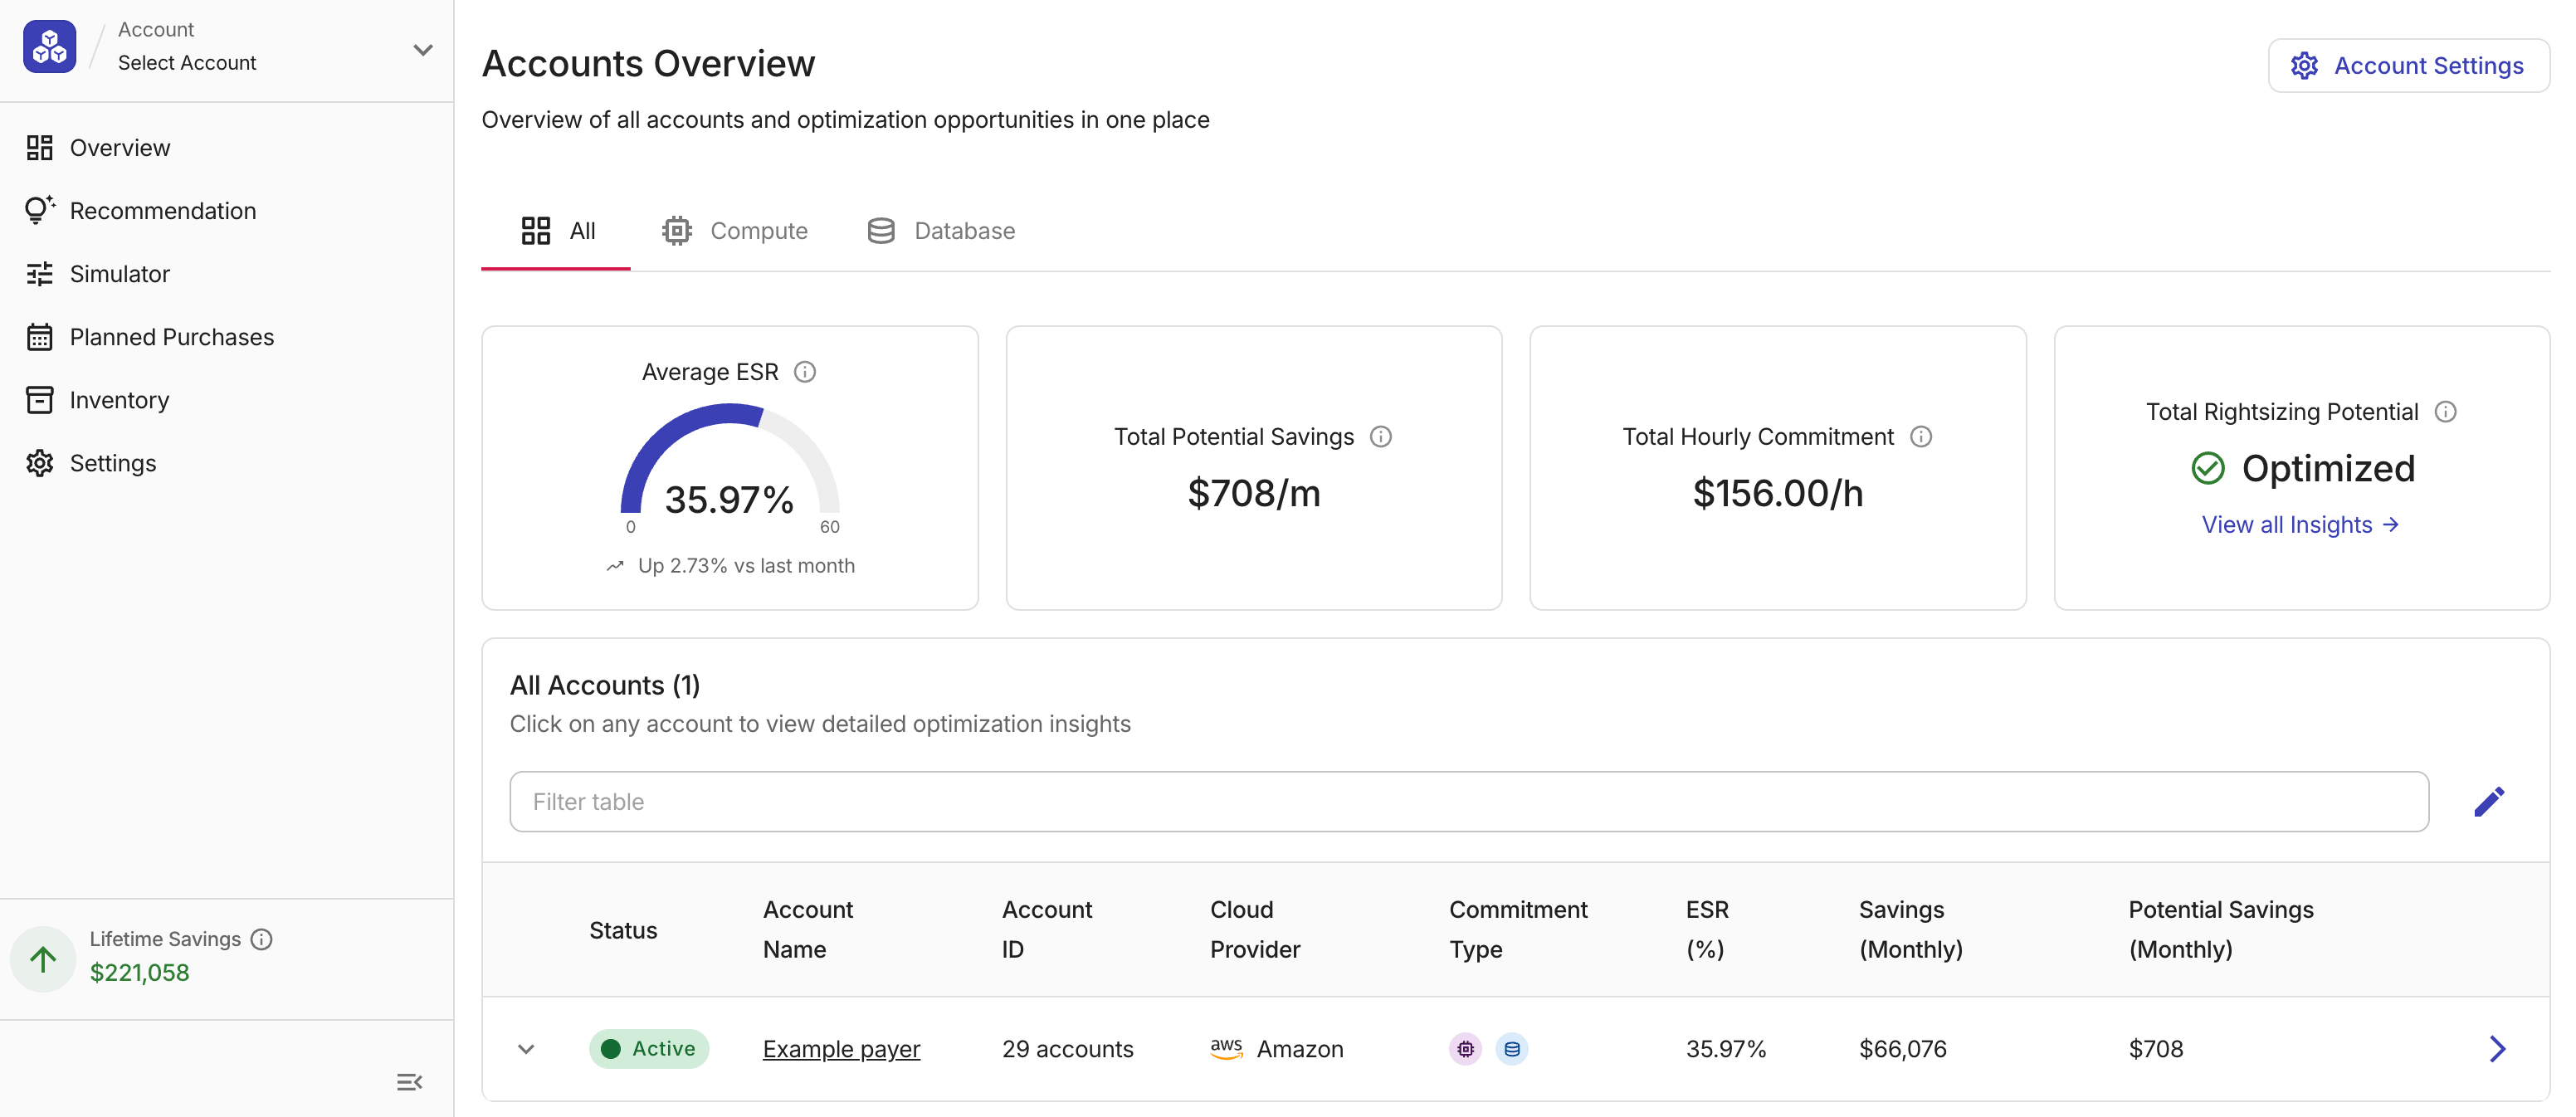
After initial setup, PerfectScale for Commitments opens to Accounts Overview: a cross-account summary of all configured payer and billing accounts so you can compare performance and optimization opportunities in one place.
If you have enabled multiple commitment types, use the tabs (All, Compute, Database (AWS), Cloud SQL (Google Cloud)) at the top of the page to filter data.
Metric cards
The Accounts Overview page shows four metric cards with organization-wide totals, calculated from Active accounts (see All accounts for status definitions).
-
Average ESR (%): The average Effective Savings Rate across all active accounts over the last 30 days, displayed as a semicircular gauge scaled from 0 to 60%.
-
The 60% ceiling is the practical maximum for commitment-based discounts such as Savings Plans and CUDs.
-
A trend caption below the gauge shows the month-over-month change (previous calendar month vs the month before) as a directional arrow with the percentage-point delta.
-
-
Total Potential Savings ($/month): Combined estimated monthly savings from commitment recommendations across onboarded accounts.
- Displays
Optimizedwhen all accounts are fully optimized and potential savings are near $0.
- Displays
-
Total Hourly Commitment ($/h): Total active hourly commitment rate summed across all active accounts.
-
Total Rightsizing Potential ($/month): Estimated monthly savings from rightsizing your environment based on actual usage patterns.
-
Displays
Optimizedwhen no rightsizing opportunities remain. -
You can select View all Insights to open the Insights page for detailed recommendations.
-
All accounts table
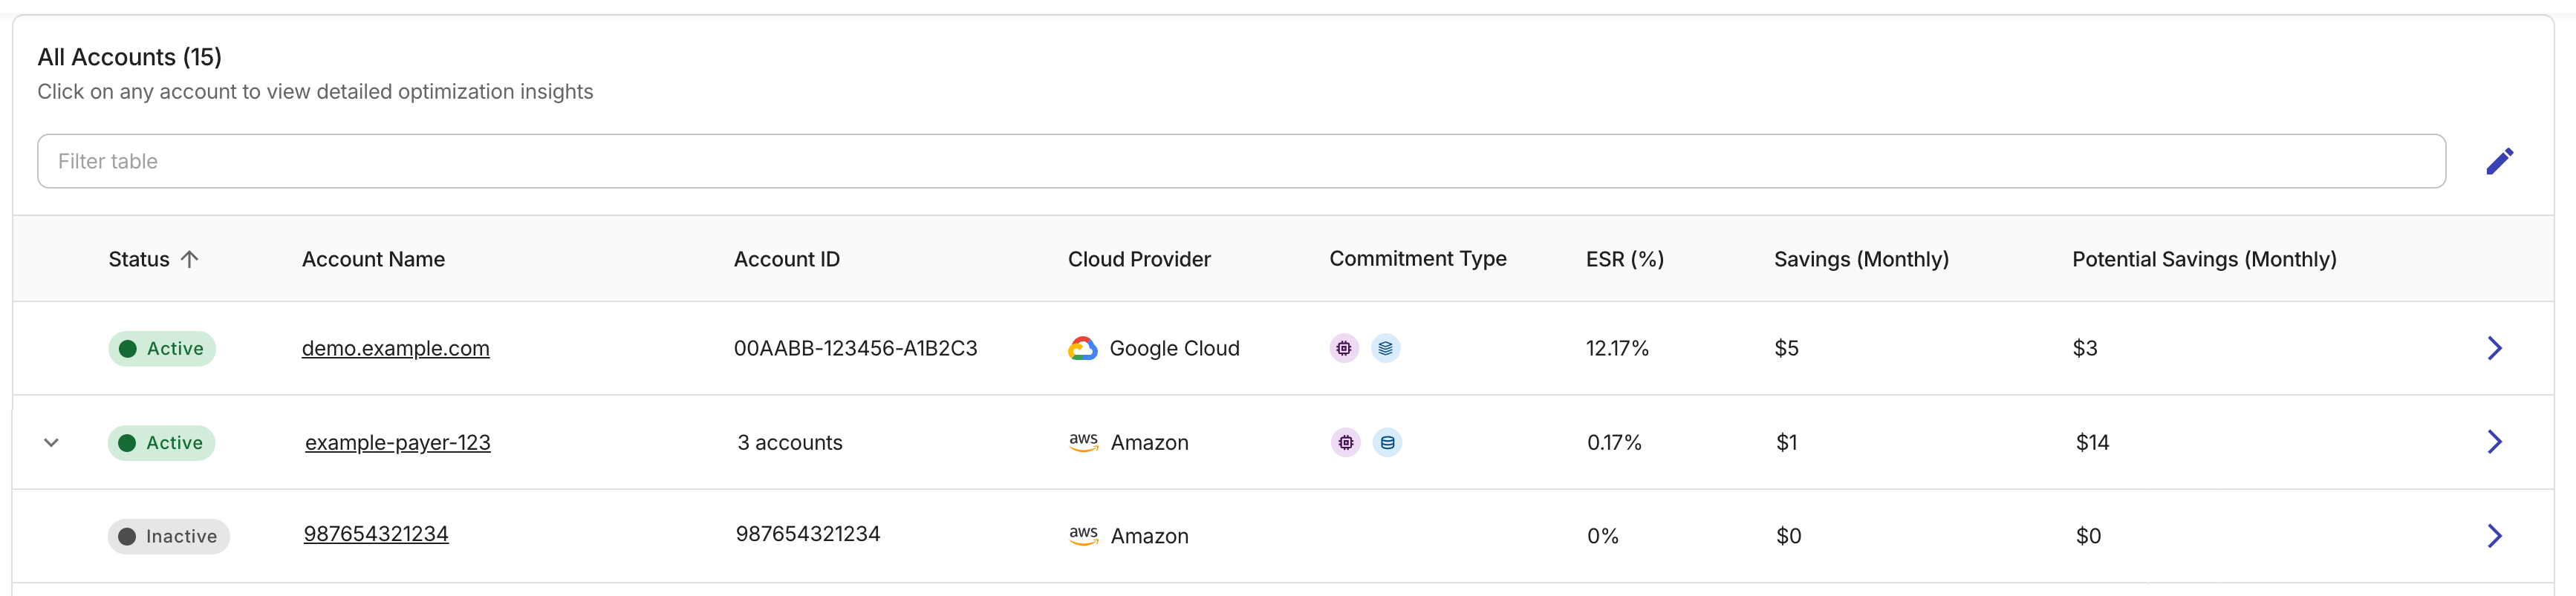
The All accounts table lists each configured account.
-
Status:
-
Active: The account has onboarded with at least one enabled commitment type. -
Inactive: Not yet onboarded for PerfectScale for Commitments (Commitment Simulator only), or enabled for a different commitment type.
-
-
Account Name: The display name of the payer or billing account. You can select this field to open the Overview page of the specific account.
-
Account ID: The cloud account or billing account ID. For an AWS payer account with linked accounts, this column displays the linked account count.
-
Cloud Provider: The cloud provider of the account.
-
Commitment Type: Icons for commitment types.
-
A colored icon means the commitment type is enabled, a gray icon means the commitment type is detected in your cloud but not yet enabled, and no icon appears when a type has no coverage and is not enabled.
-
To enable a detected commitment type, select Add new accounts on the Account Settings page and complete onboarding for that commitment type.
-
-
ESR (%): Effective Savings Rate over the last 30 days. Savings realized through active commitments compared with equivalent on-demand cost. Higher ESR means greater realized savings.
- For AWS, ESR on the All tab is a savings-weighted average across enabled commitment types.
-
Savings (Monthly): Total savings realized over the last 30 days from active commitments.
- For AWS, the figure on the All tab is the sum across enabled commitment types.
-
Potential Savings (Monthly): Estimated additional monthly savings if you move from the current commitment level to the recommended level for the account. A checkmark appears instead of an amount when the account is fully optimized.
AWS payer account
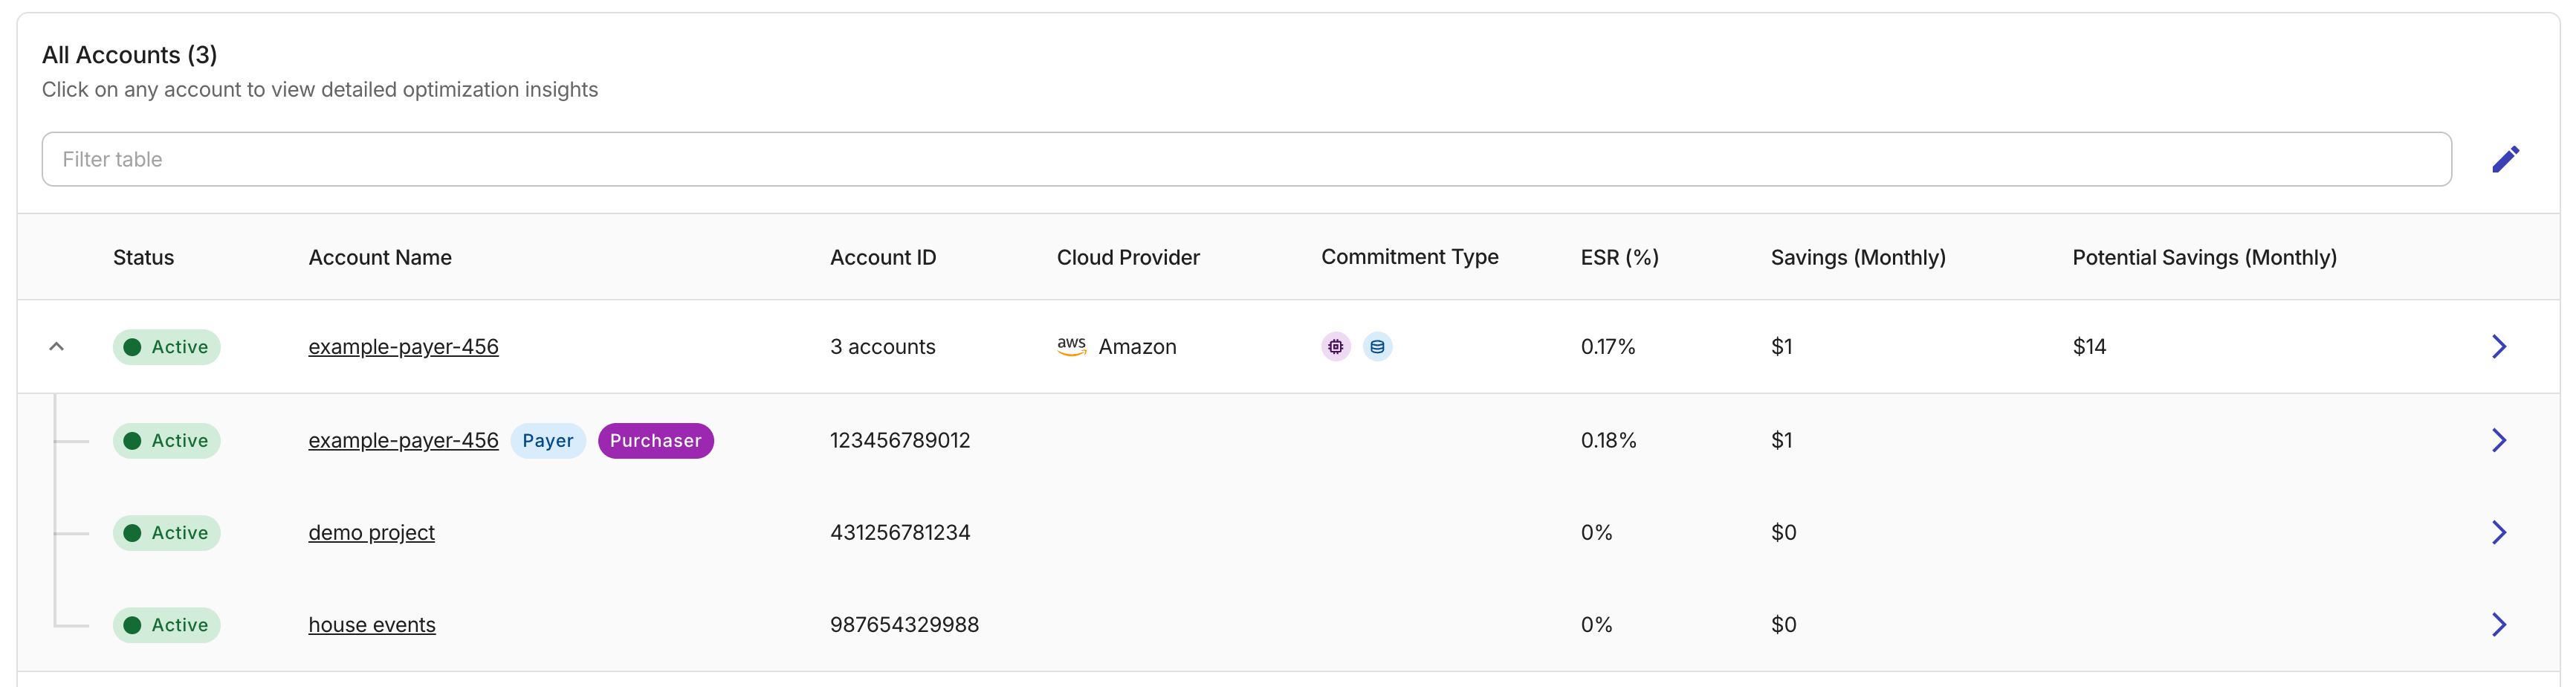
An AWS payer account with linked accounts can be expanded.
-
The account with a Payer label is the payer account (management account).
-
The account with a Purchaser label is the commitments purchasing account. It can be the same one as the payer account.
Google Cloud Billing account
A Google Cloud Billing account with linked projects can be expanded in the same way.
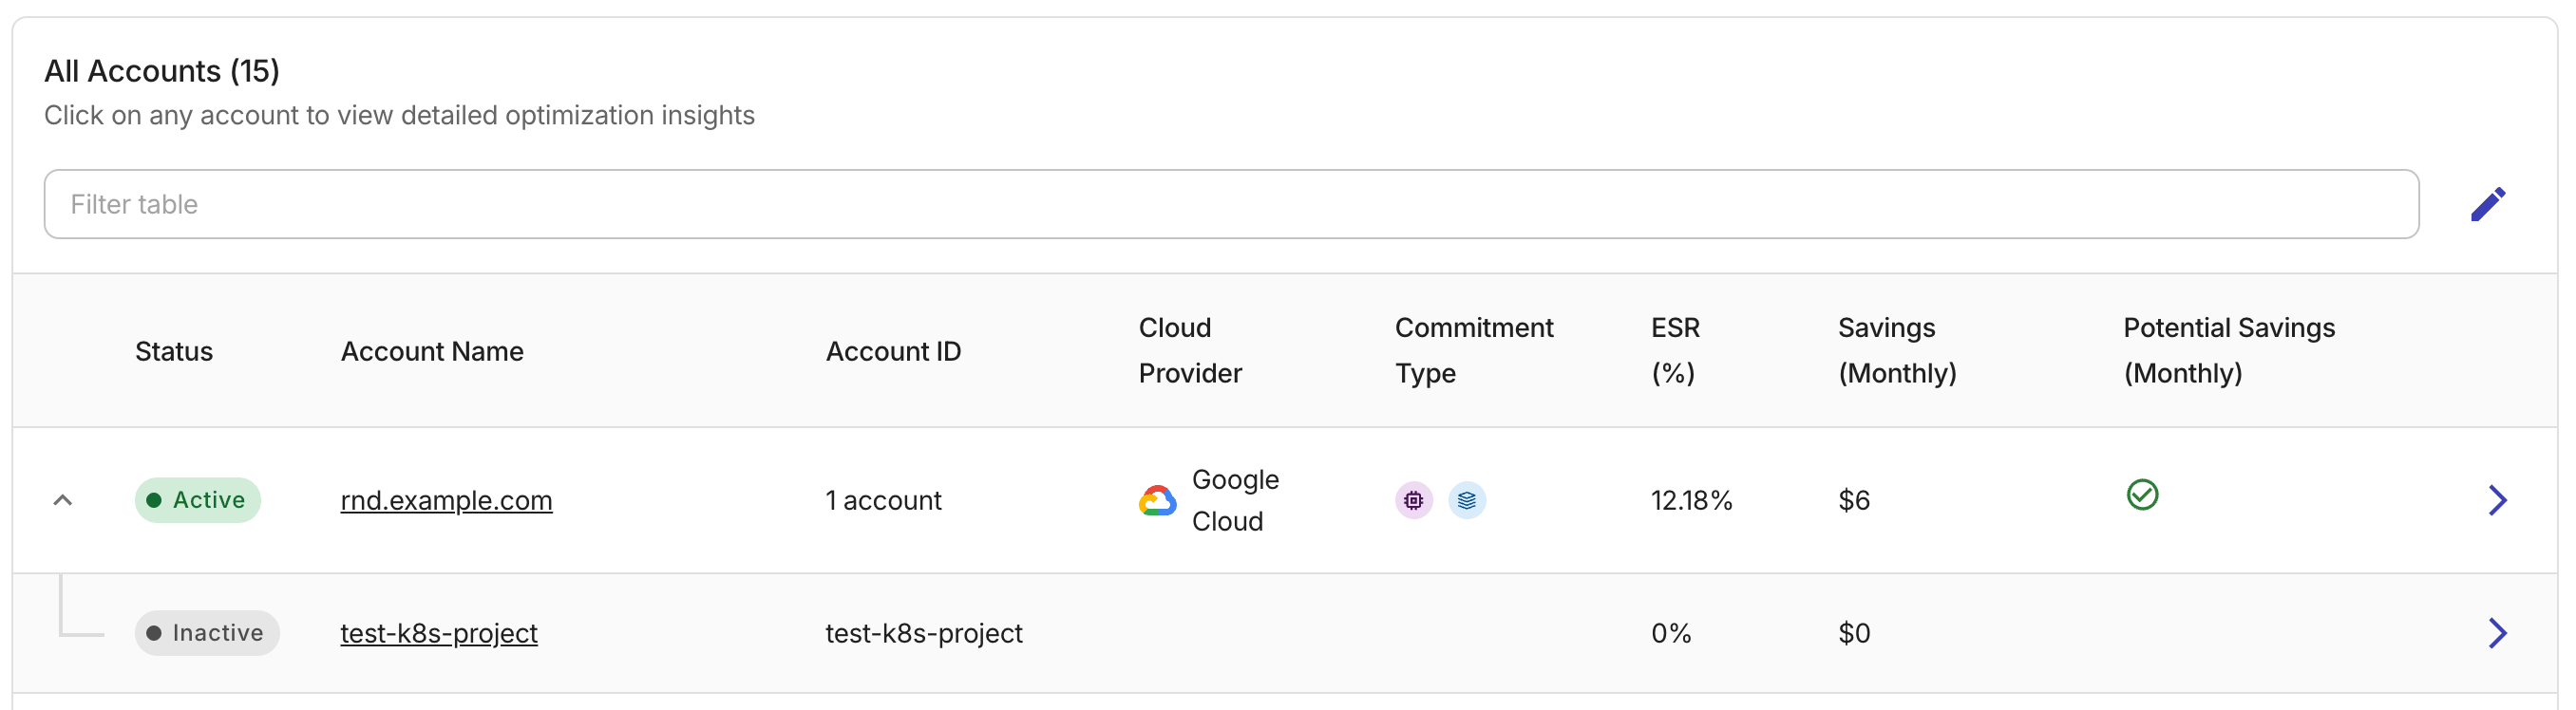
Each child row shows the project's ESR, monthly savings, and a link to drill down into the project-level Overview.
Overview (individual account)
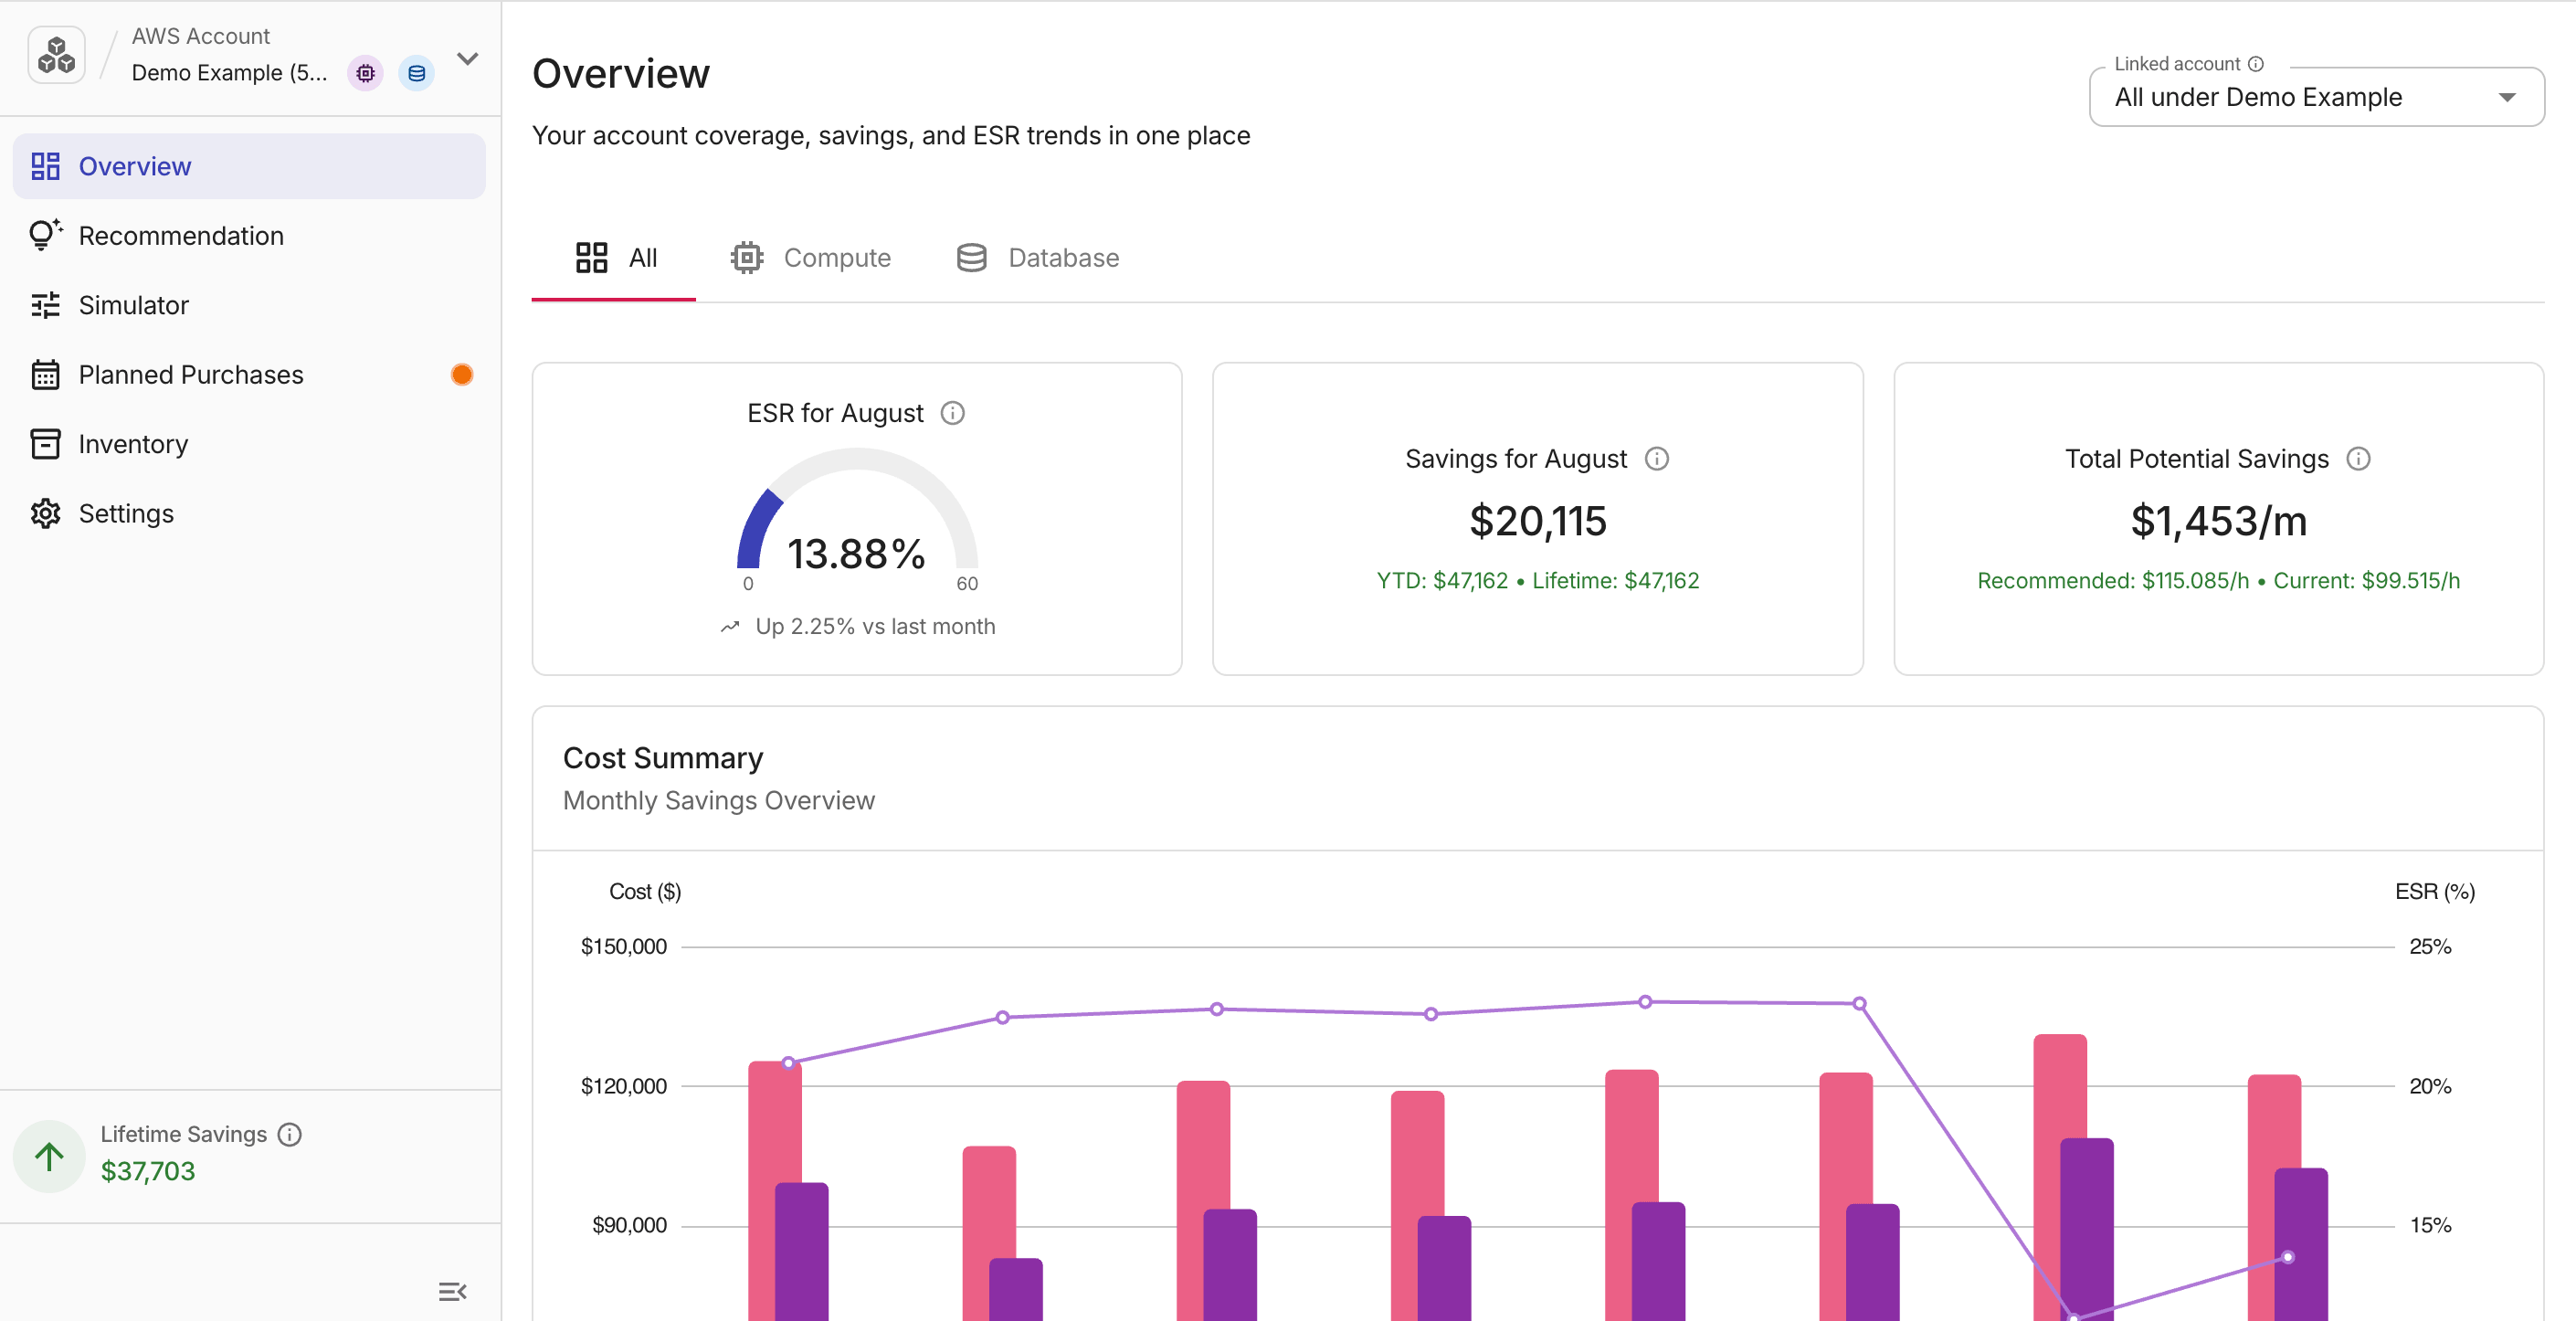
To view the coverage, savings, and ESR trends of a specific account, select its Account Name or the right arrow (>) in the All accounts table.
-
For AWS payer accounts with linked accounts, a Linked account selector appears in the page header.
-
For Google Cloud Billing accounts with linked projects, a Project selector appears in the page header. A Region selector is also available on the Cloud SQL tab.
Metric cards
The Overview shows three metric cards for the selected account:
-
ESR (%): The account's Effective Savings Rate for the previous calendar month, displayed as a semicircular gauge scaled from 0 to 60%.
-
The 60% ceiling is the practical maximum for commitment-based discounts such as Savings Plans and CUDs.
-
A trend caption below the gauge shows the month-over-month change (previous calendar month vs the month before) as a directional arrow with the percentage-point delta.
-
-
Savings ($): Total savings for the previous calendar month, with year-to-date and lifetime totals.
-
Total Potential Savings ($/month): Estimated monthly savings available by applying PerfectScale recommendations.
-
Displays
Optimizedwhen potential savings are near $0. -
For an AWS payer account or a Google Cloud billing account, the card shows recommended and current commitment rates ($/h).
-
For an AWS linked account, the card shows that account's share of payer-level potential savings (without recommended-vs-current), or N/A if no share is available.
-
Cost summary
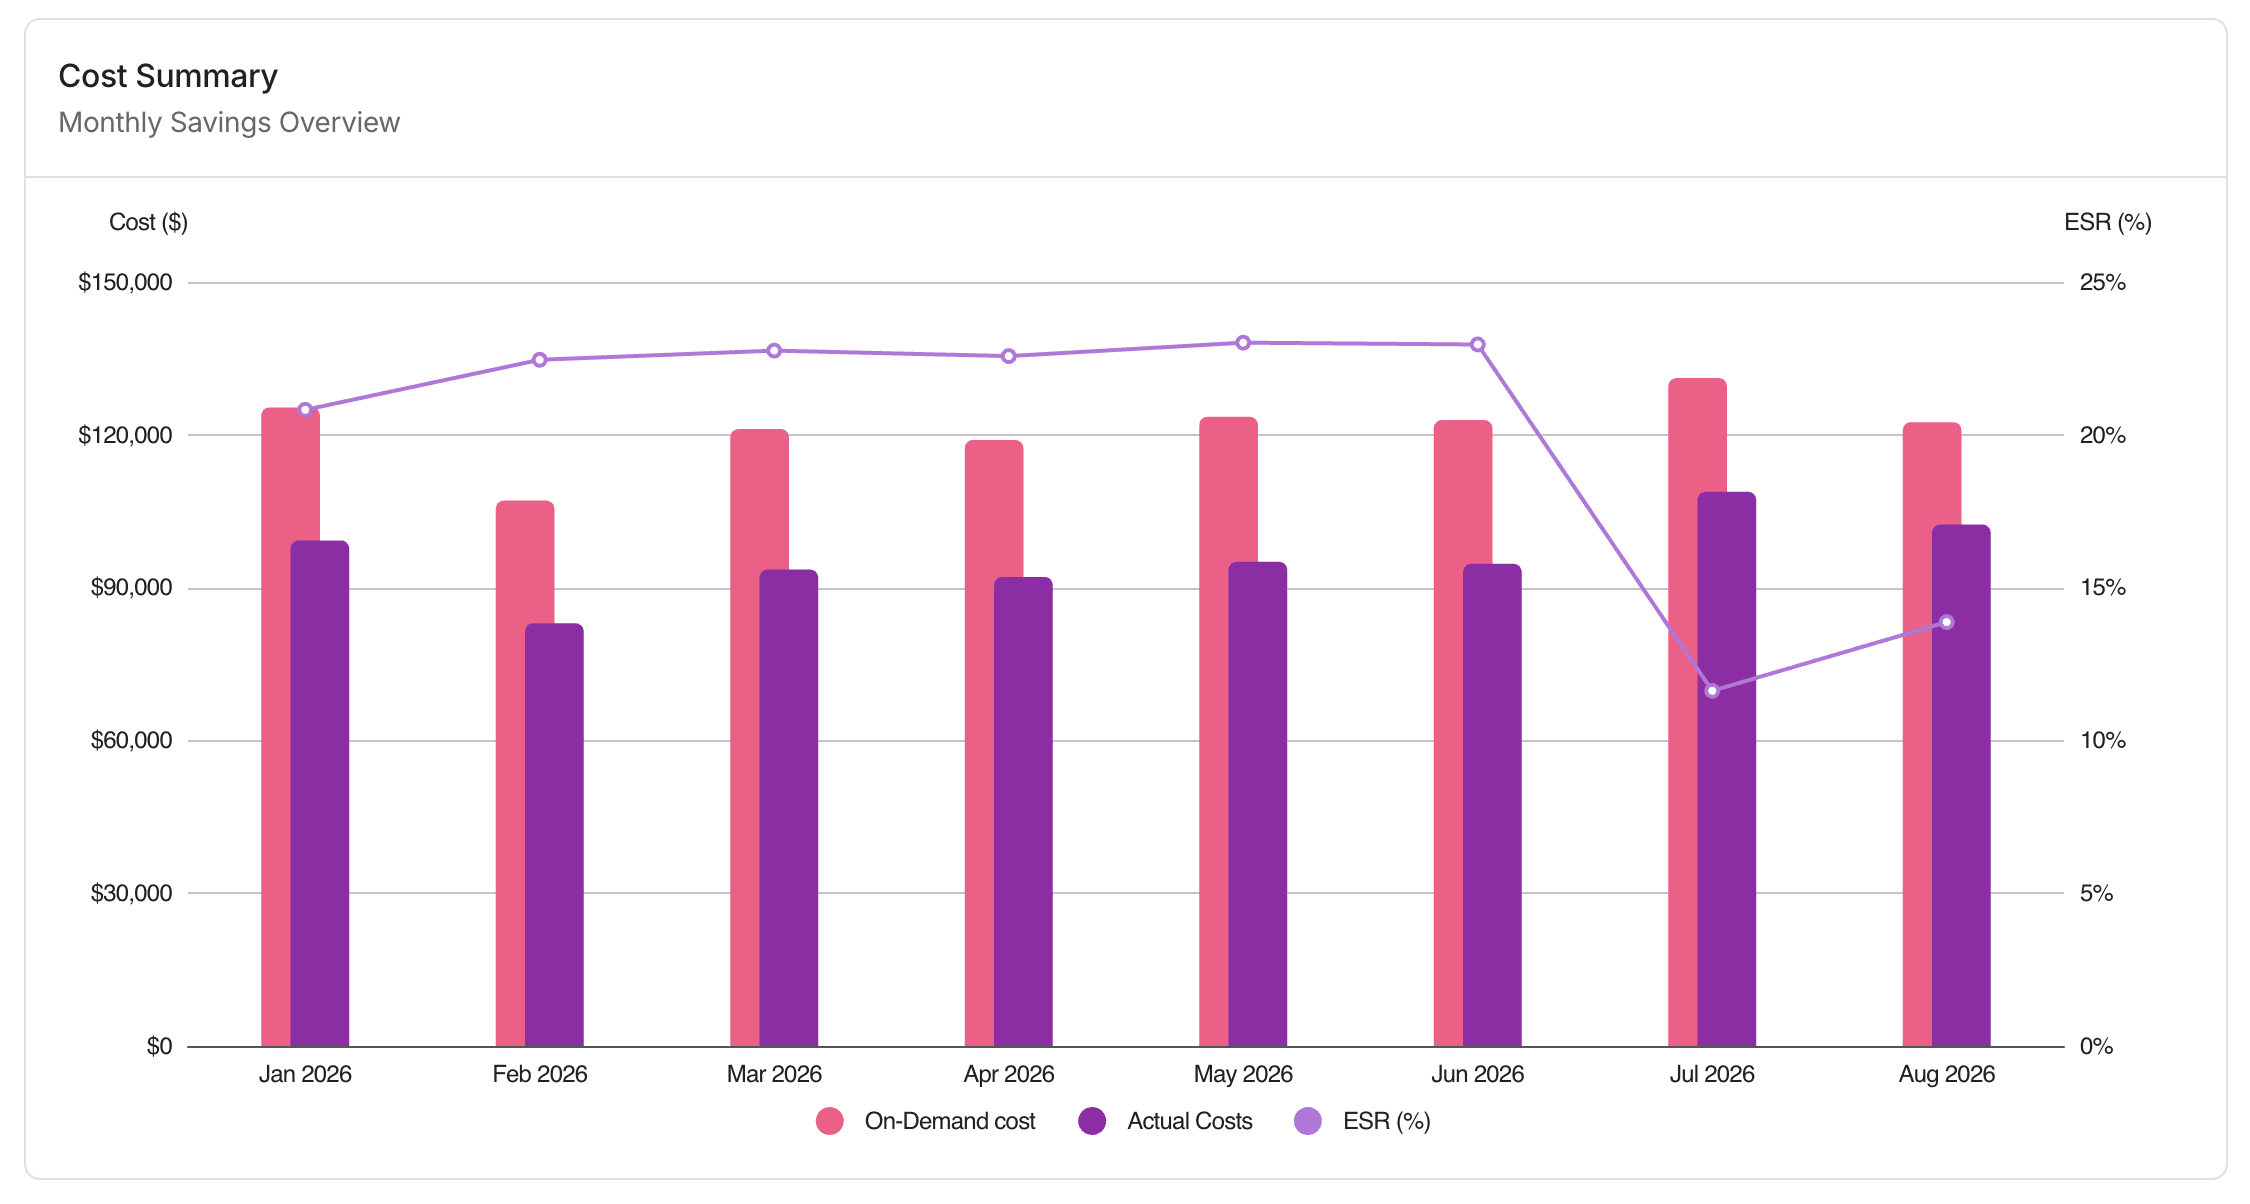
The Cost Summary chart plots monthly spend as overlapping bars, with Effective Savings Rate as a line on the secondary axis.
-
On-Demand Cost: What the same eligible usage would have cost at full on-demand rates, before commitment discounts.
-
Actual Costs: What you paid for that eligible usage after commitment discounts. For example, Savings Plans, Reserved Instances, and Flexsave on AWS, or CUDs on Google Cloud.
Use the chart to see whether your savings rate is improving or declining over time and how it correlates with overall spend. The gap between the bars is the savings realized that month. A widening gap with a rising ESR line usually means commitment coverage is improving relative to spend.
Commitment coverage
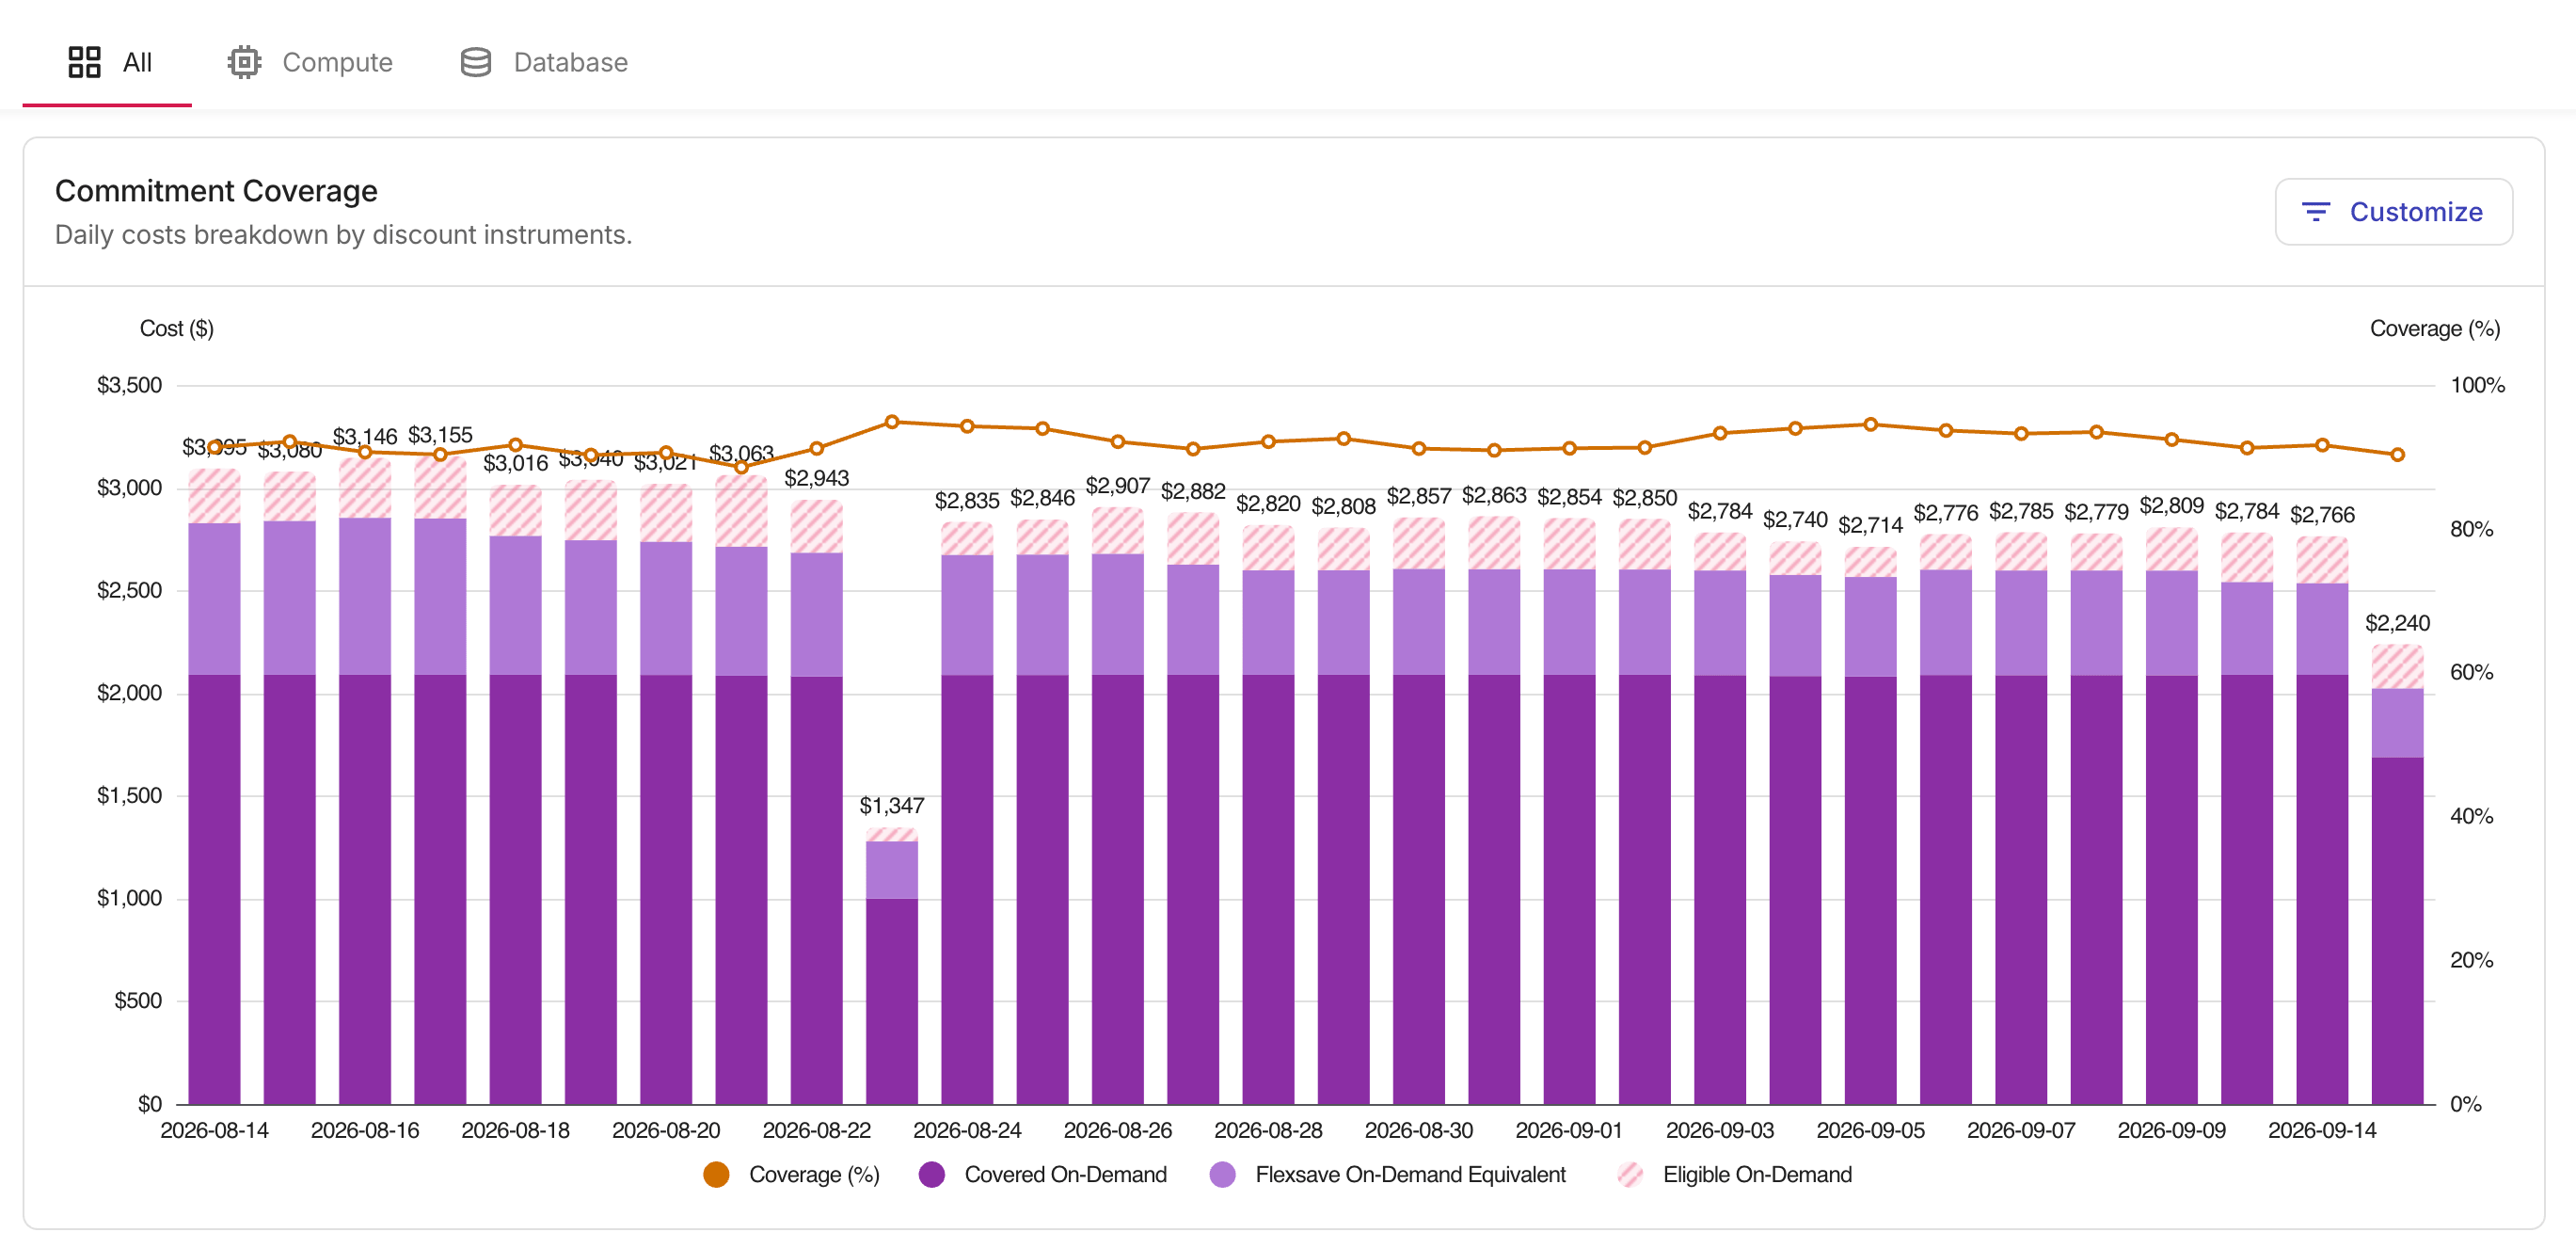
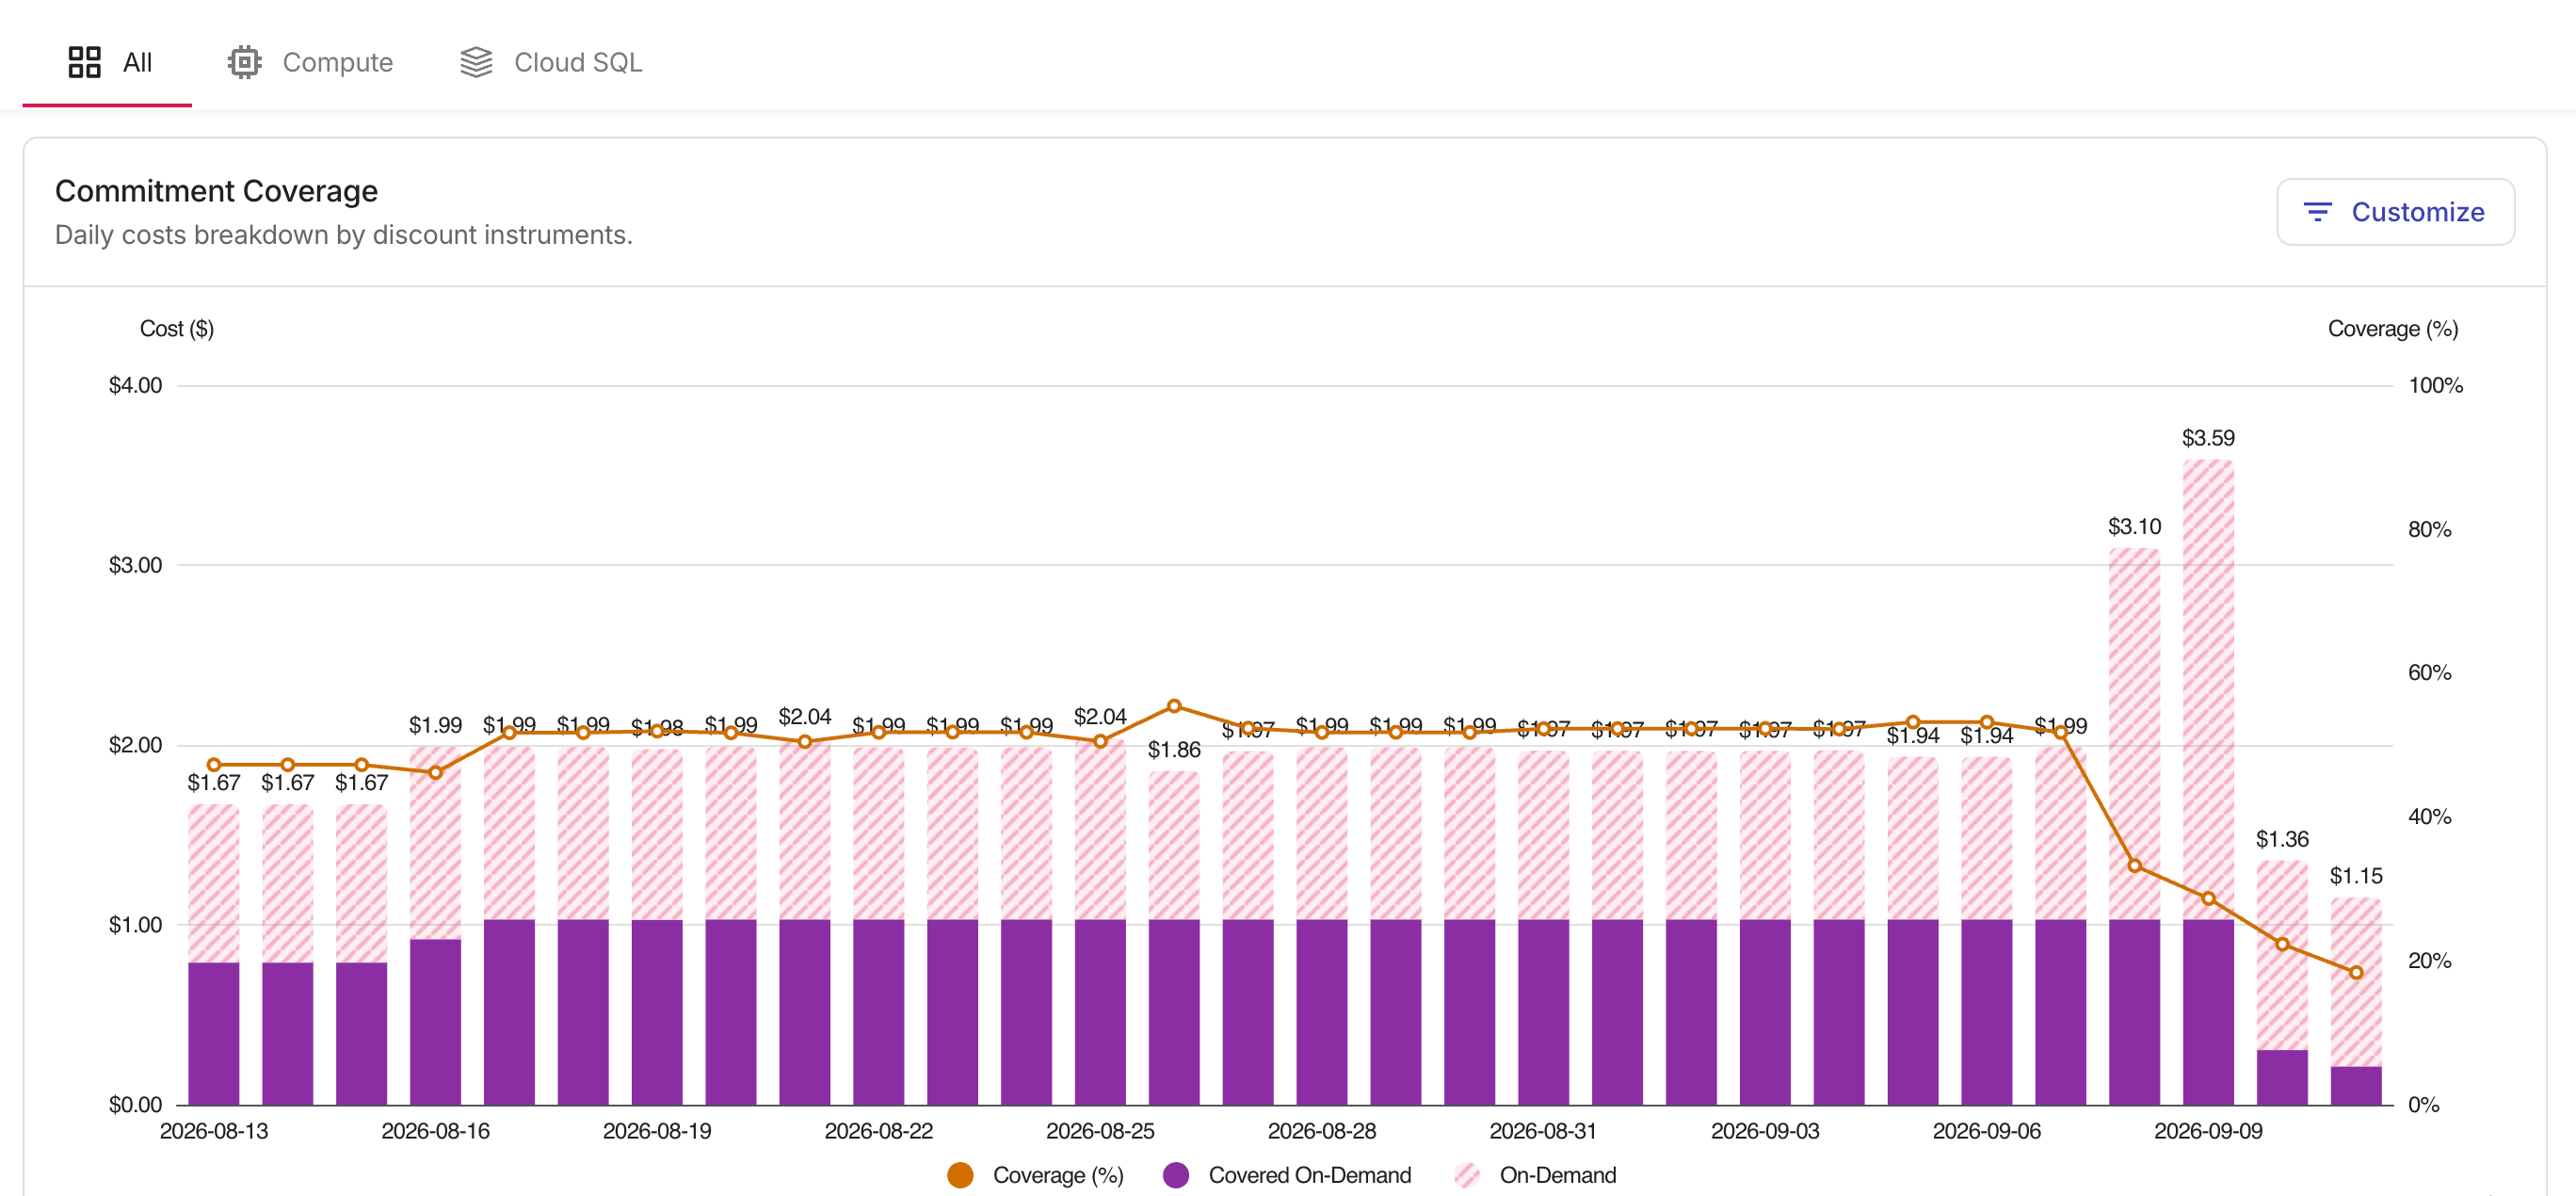
The Commitment Coverage chart shows daily spend broken down by discount type over the last 30 days.
Recommendations use a 60-day analysis of your cost, coverage, and utilization to calculate the commitment level needed to cover eligible on-demand spend.
- AWS commitment coverage
- Google Cloud commitment coverage
-
Coverage (%): The percentage of total daily spend covered by commitments, plotted as a line on the right axis.
-
Covered On-Demand: Spend covered by customer-purchased Savings Plans or Reserved Instances.
-
Eligible On-Demand: Spend charged at full on-demand rates, not covered by a Savings Plan or Reserved Instance.
-
Spot Instances (optional): Compute spend served by Spot Instances. Hidden by default; enable it from Customize when the account has Spot spend in the displayed period.
-
Flexsave On-Demand Equivalent (AWS Flexsave customers only): Spend covered by Flexsave Savings Plans. This series appears in Customize only when the account has Flexsave spend in the displayed period.
Select Customize to show or hide series, or Reset to default to restore the original selection.
-
Coverage (%): The percentage of total eligible spend covered by CUDs, plotted as a line on the right axis.
-
Covered On-Demand: Spend covered by active CUDs, including both spend-based and resource-based commitments.
-
On-Demand: Spend charged at full on-demand rates, not covered by any CUD.
Select Customize to show or hide series, or Reset to default to restore the original selection.
If you open an account that appears in Commitment Simulator but is not configured for PerfectScale for Commitments, choose Commitment Simulator to plan commitment levels, or Configure account to set up PerfectScale for Commitments.
After onboarding, return to Accounts Overview to monitor ESR and coverage, then use Recommendation and Planned purchases for purchase plans.
Account selector
The Account selector at the top of the left sidebar lets you switch between views.
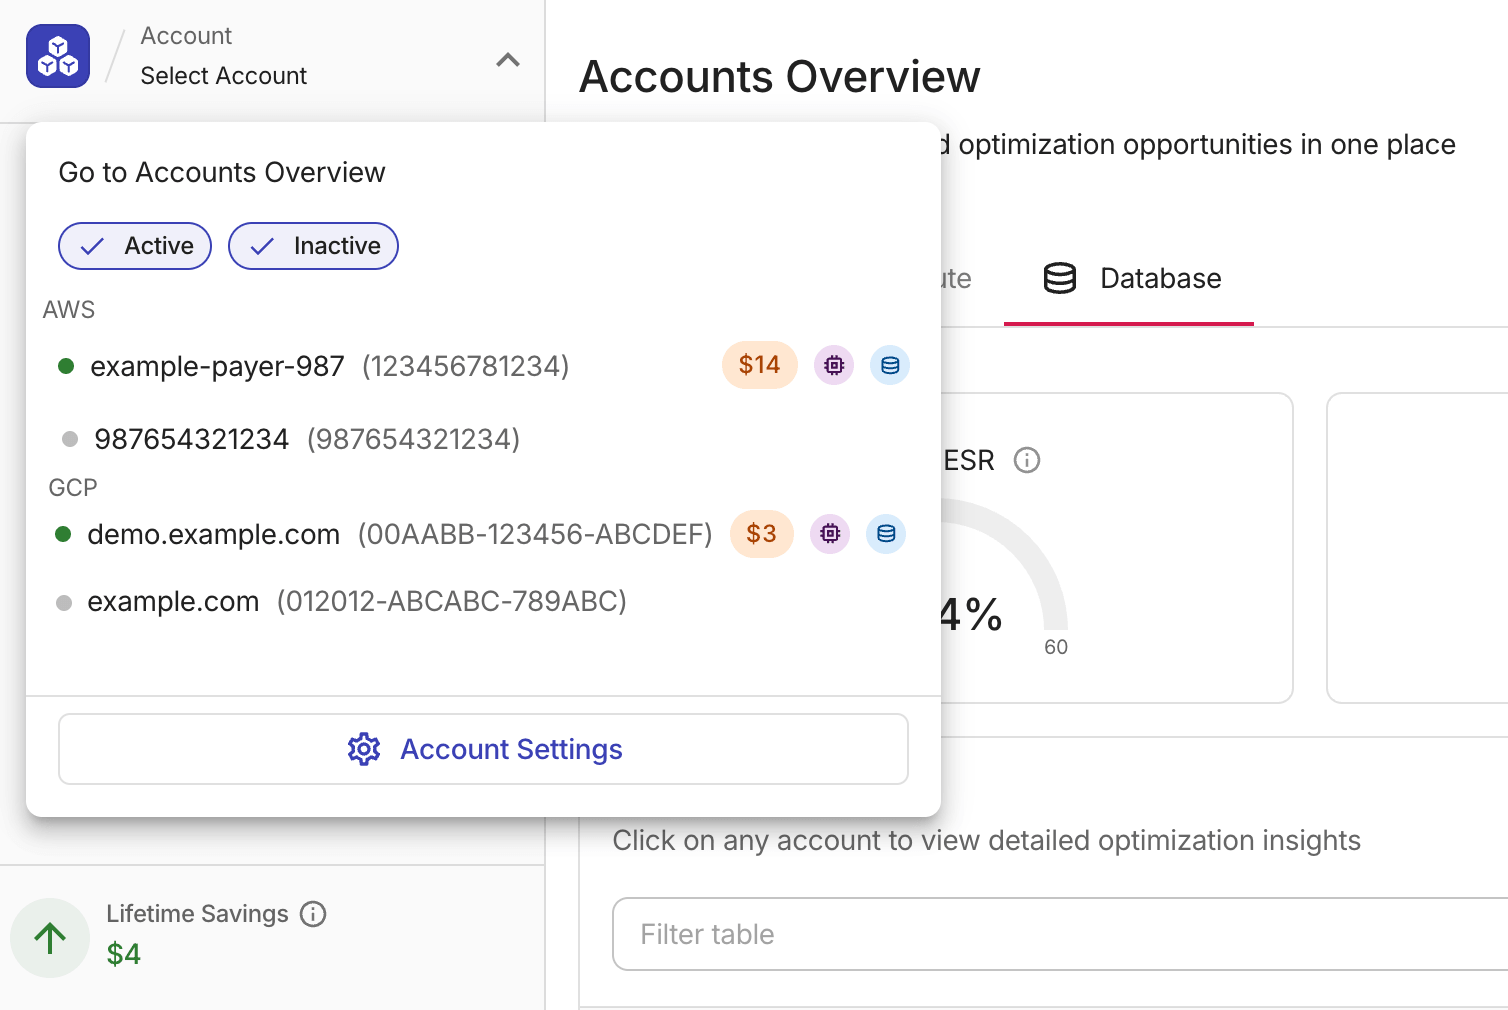
In the list, an active account displays a green checkmark if it is fully optimized, or a savings badge with the estimated monthly potential savings, plus icons for the enabled commitment types.
-
Select a specific account to open its Overview page.
-
Select Go to Accounts Overview to open the Accounts Overview page.
-
Select Account Settings to open the Account Settings page.
Switching views does not affect the Lifetime Savings figure displayed at the bottom.