View anomaly details
When viewing the details of a specific anomaly, you have access to multiple resources that help you investigate and address the anomaly.
Required permissions
- Allocations Admin, Anomalies Viewer, Cloud Analytics User
View a cost anomaly
To view a specific cost anomaly:
-
Sign in to the DoiT console, select Policy and governance from the top navigation mega menu, and then select Cost anomalies.
-
On the Cost anomalies page, find the anomaly of interest.
-
Select View at the rightmost end of the anomaly entry to launch the cost anomaly details page.
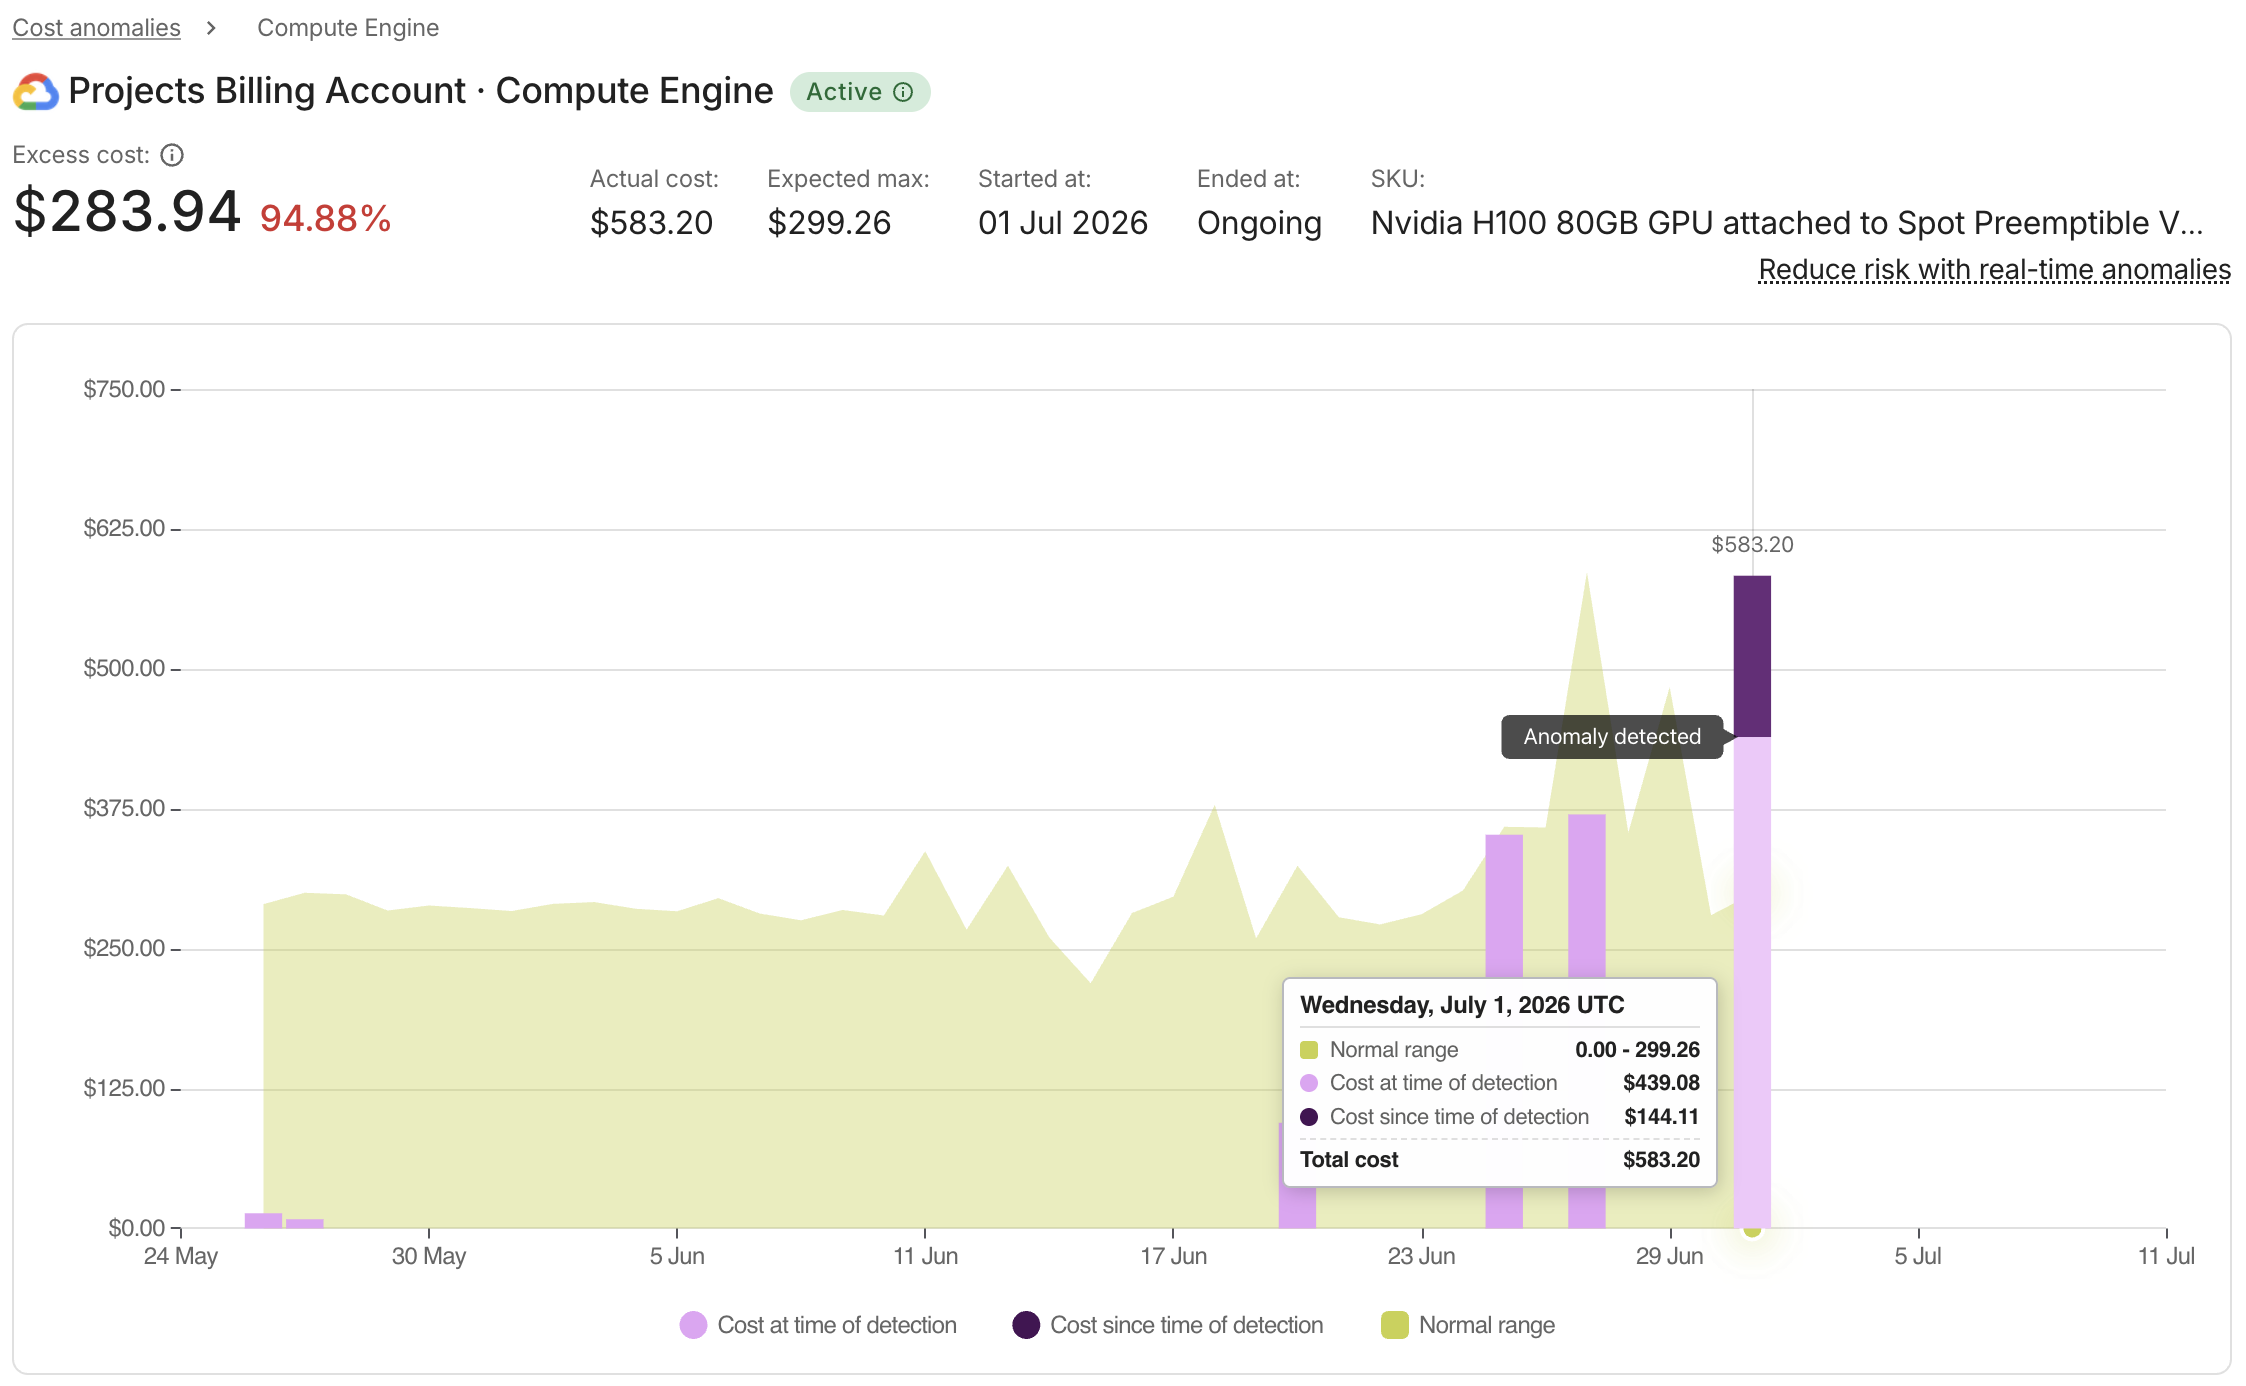
An example anomaly based on billing data (daily granularity):
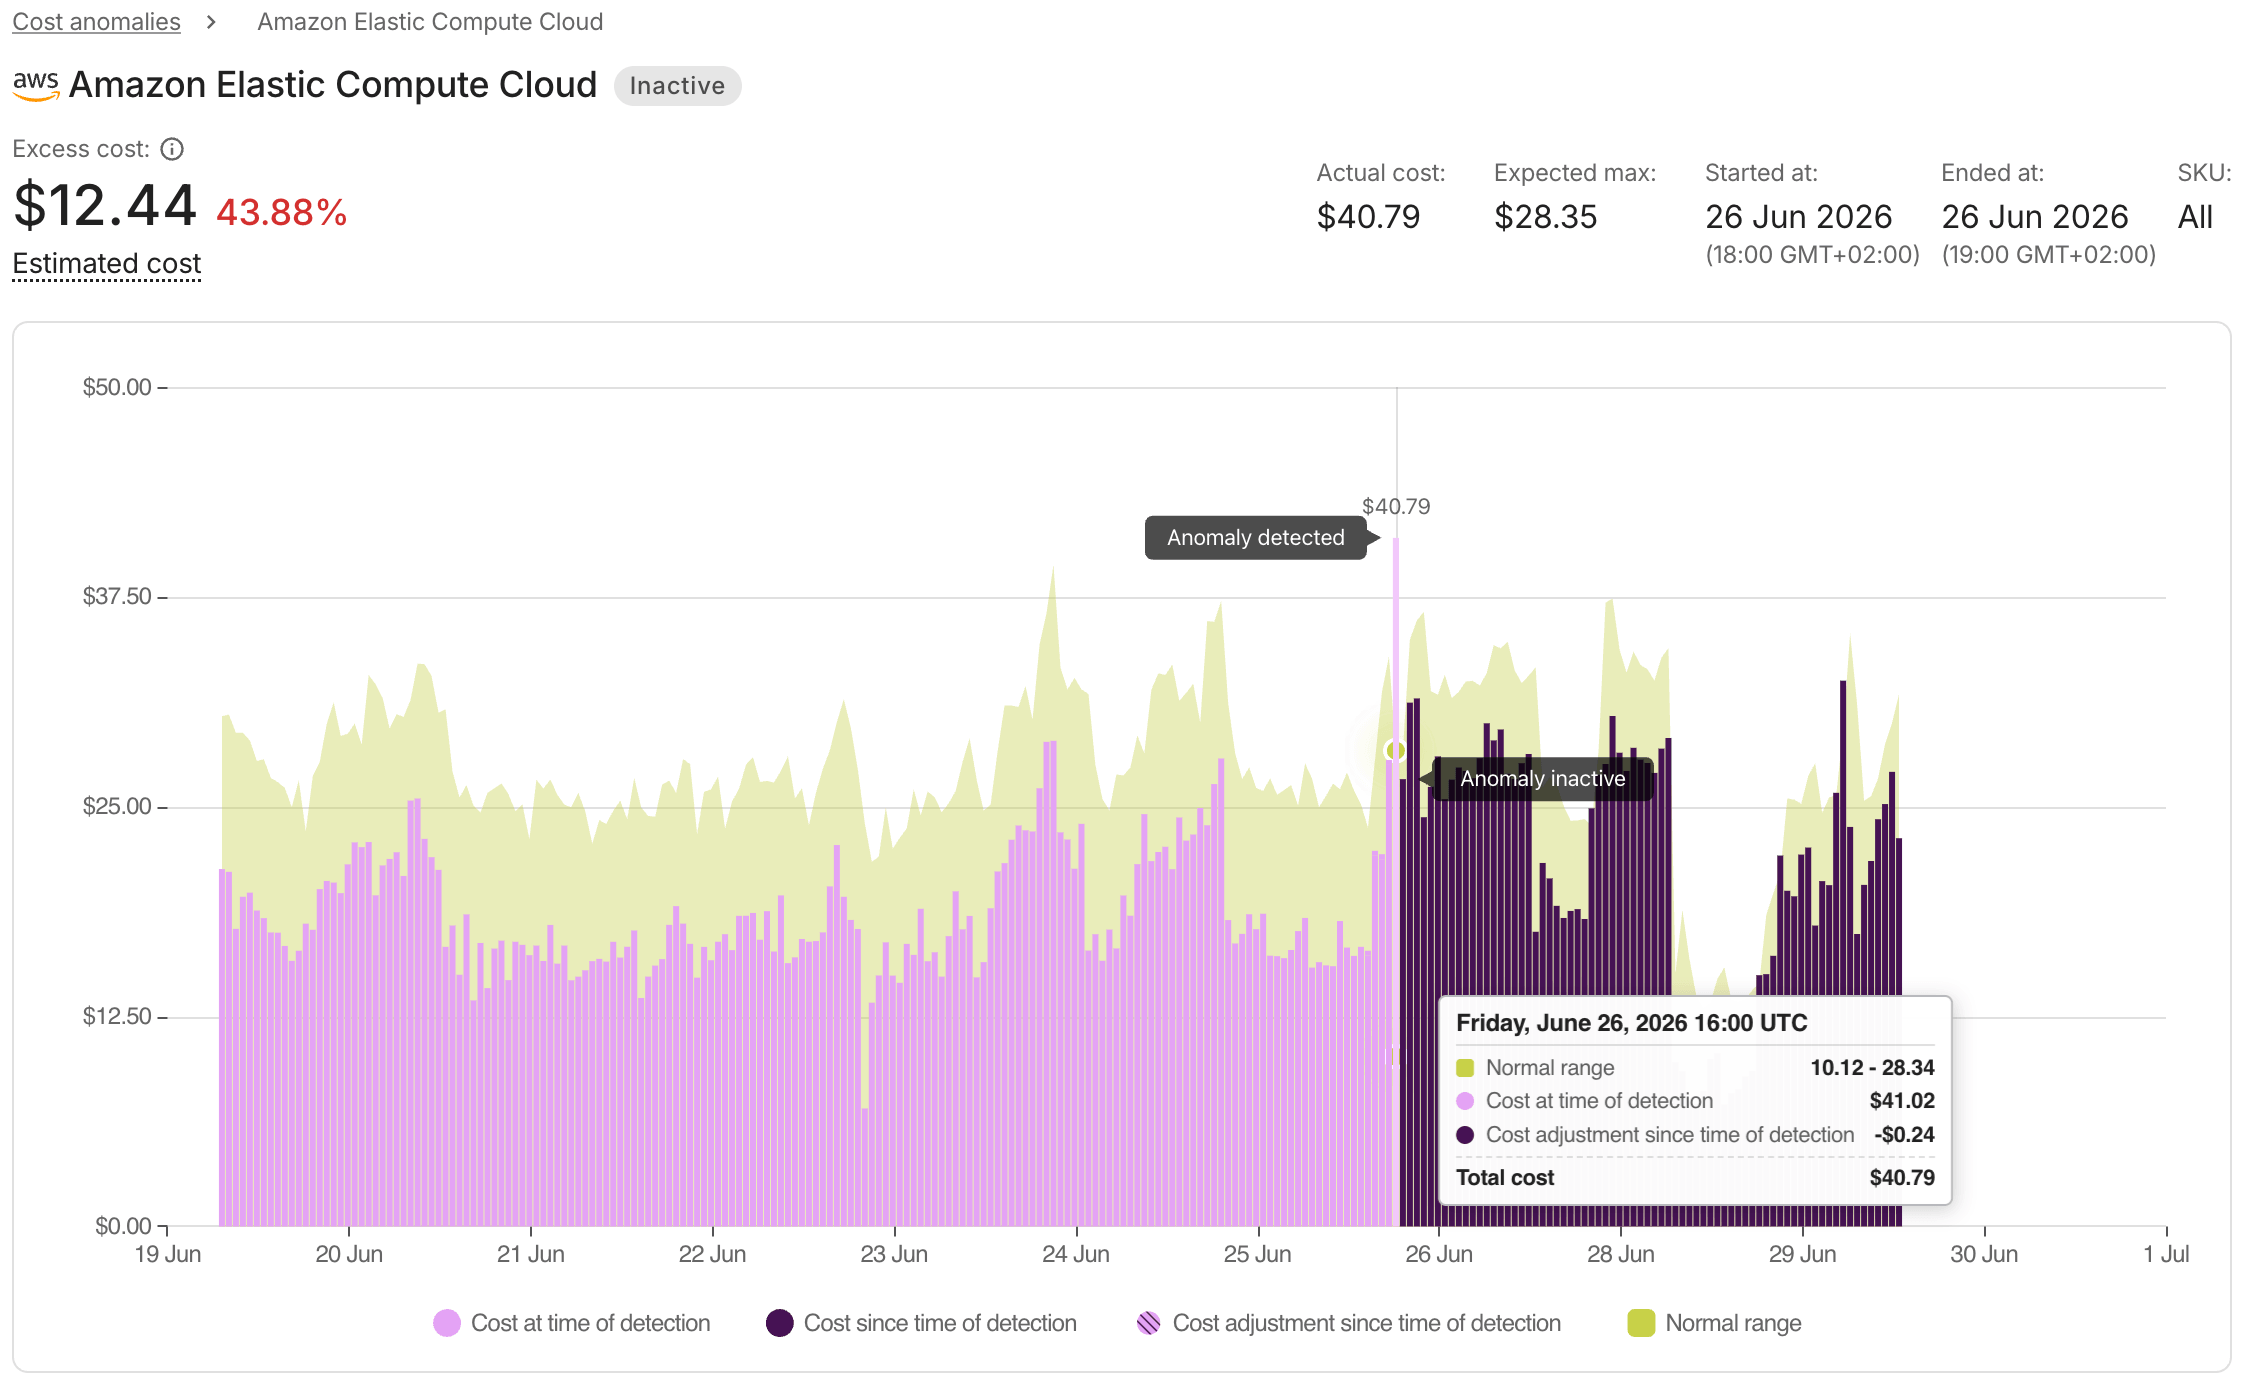
An example anomaly based on AWS CloudTrail events (Real-time anomaly, hourly granularity):
Summary
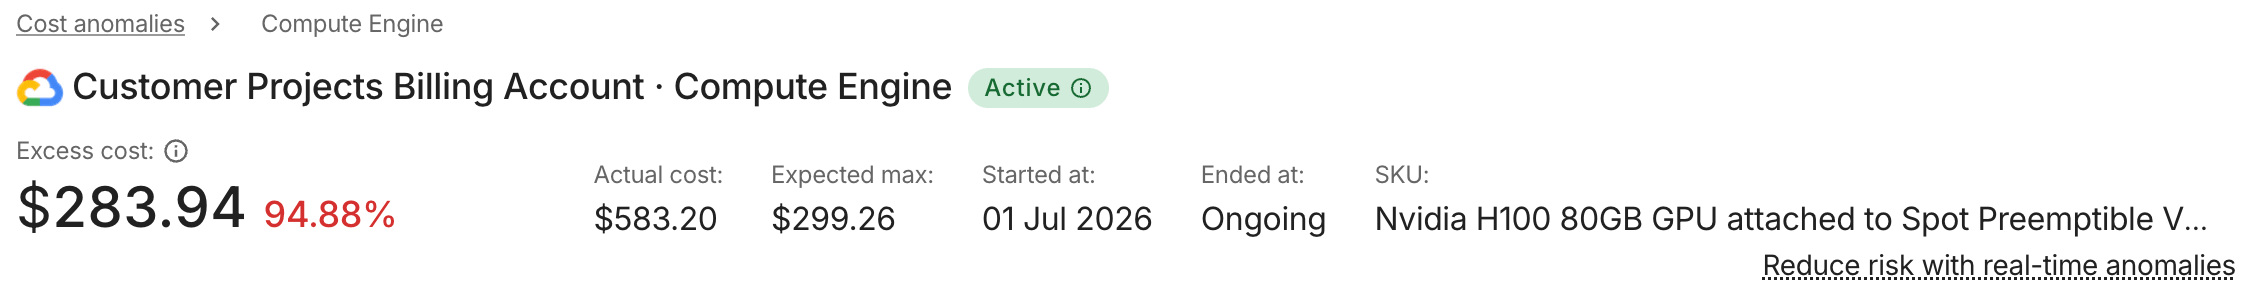
At the top of the anomaly details page, a header row displays the cloud provider logo, a title combining the billing account name (or project/account ID) and service name, and a status chip indicating whether the anomaly is Active or Inactive.
Below the header, the anomaly details page displays the following metrics:
-
Excess cost: The difference between the actual cost and the upper bound of the normal range, displayed prominently. For real-time anomalies, this value is labeled as an estimate. Next to the excess cost, the percentage by which the excess cost exceeds the expected maximum is displayed as
X%. -
Actual cost: The observed cost at the time the anomaly started.
-
Expected max: The upper bound of the normal cost range at the time the anomaly started.
-
Started at: When the anomalous usage began. For real-time anomalies, this includes the time.
-
Ended at: When the anomaly became inactive, or Ongoing if it is still active.
-
SKU: See Resource metadata: SKU. Shows the SKU name for SKU-level anomalies, or All for service-level anomalies. Near real-time anomalies are detected at the service level only.
For older anomalies that predate the current detection system, Actual cost and Expected max display a dash (—) and the deviation is hidden.
Side panel
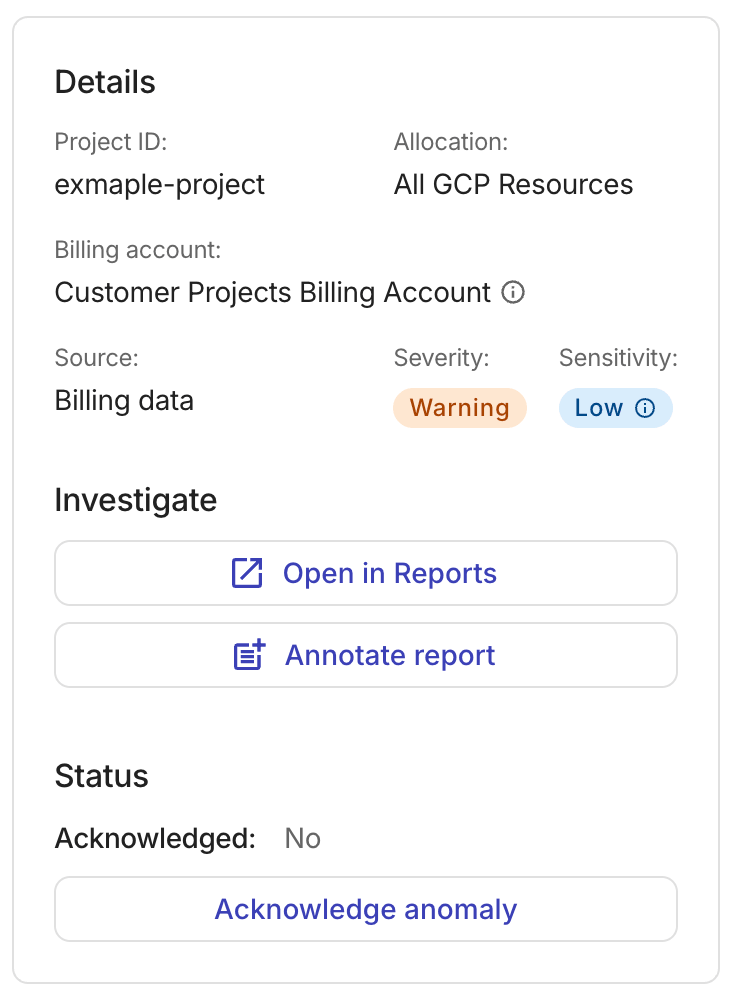
On desktop, a side panel to the right of the main content area groups Details, Investigate, and Status. On mobile, the same content is displayed inline below the header metrics. The Details section includes the following properties:
-
Project ID: The project or account associated with the anomaly. The label varies by provider (for example, Project ID for Google Cloud, Account number for AWS). For a complete list, see Hierarchy property 2 in Provider-specific labels. Shows All if the anomaly was detected at the service level.
-
Allocation: The allocation associated with the anomaly, if applicable.
-
Billing account: The billing account, subscription, or organization associated with the anomaly. The label varies by provider. For a complete list, see Hierarchy property 1 in Provider-specific labels. For Google Cloud and Microsoft Azure, an info icon shows the billing account ID.
-
Source: Whether the anomaly is based on billing data or real-time usage data.
-
Severity: The severity level of the anomaly (Info, Warning, or Critical).
-
Sensitivity: Shown only for non-default sensitivity settings. Indicates whether the anomaly was detected with low or high sensitivity. See Sensitivity.
The Investigate section provides shortcuts to explore the anomaly in other parts of the console:
-
Open in Reports: Opens a pre-filtered Cloud Analytics report scoped to the anomaly's provider, service, billing account, project or account, and allocation. See Open in reports.
-
Open in Cloud Diagrams: Opens the anomaly's resources in a cloud diagram with the cost heatmap active, when Cloud Diagrams is enabled for your tenant. If Cloud Diagrams is not yet enabled, this section offers a link to enable it instead. See Open in Cloud Diagrams.
-
Annotate report: Creates a report annotation prefilled with anomaly data, when Ava is available on your DoiT plan. Existing annotations linked to the anomaly are listed in this section. See Annotate report.
The Status section shows whether the anomaly has been reviewed:
- Acknowledged: Whether the anomaly has been classified after review (Yes or No). When acknowledgement is enabled for your organization, select Acknowledge anomaly (or Edit acknowledgement) to record whether the spend is a true anomaly or a false alarm. See Acknowledge anomalies.
Provider-specific labels
The table below lists the provider-specific labels for the organizational hierarchy properties:
| Provider/Platform | Hierarchy property 1 | Hierarchy property 2 |
|---|---|---|
| Amazon Web Services | Management account/Account name (AWS account name) | Account number |
| Databricks | Organization | Account ID |
| Datadog | Account name | Workspace ID |
| Google Cloud | Billing account (Google Cloud Billing account display name and ID) | Project ID |
| Microsoft Azure | Subscription (Azure subscription display name and ID) | Resource group |
| MongoDB Atlas | Account name | Organization |
| OpenAI | Organization | Workspace |
| Snowflake | Organization | Account |
Cost anomaly chart
On a cost anomaly chart, you'll see two annotations indicating when a spike was identified as an anomaly (Anomaly detected) and when the anomaly became inactive (Anomaly inactive, see Dynamic updates).
The chart shows the following values for each time step:
-
Normal range: The lower and upper bounds of the expected cost range at that time step, shown as a shaded area on the chart.
-
Cost at time of detection: The cost recorded when the anomaly was first detected at that time step.
-
Cost since time of detection: Additional cost recorded after detection at that time step. The anomaly detection system keeps updating this value until the anomaly becomes
Inactive. -
Cost adjustment since time of detection: Shown only when later billing data revises the cost downward after detection. Displays as a negative value in the tooltip.
-
Total cost: The sum of the cost components shown for that time step.
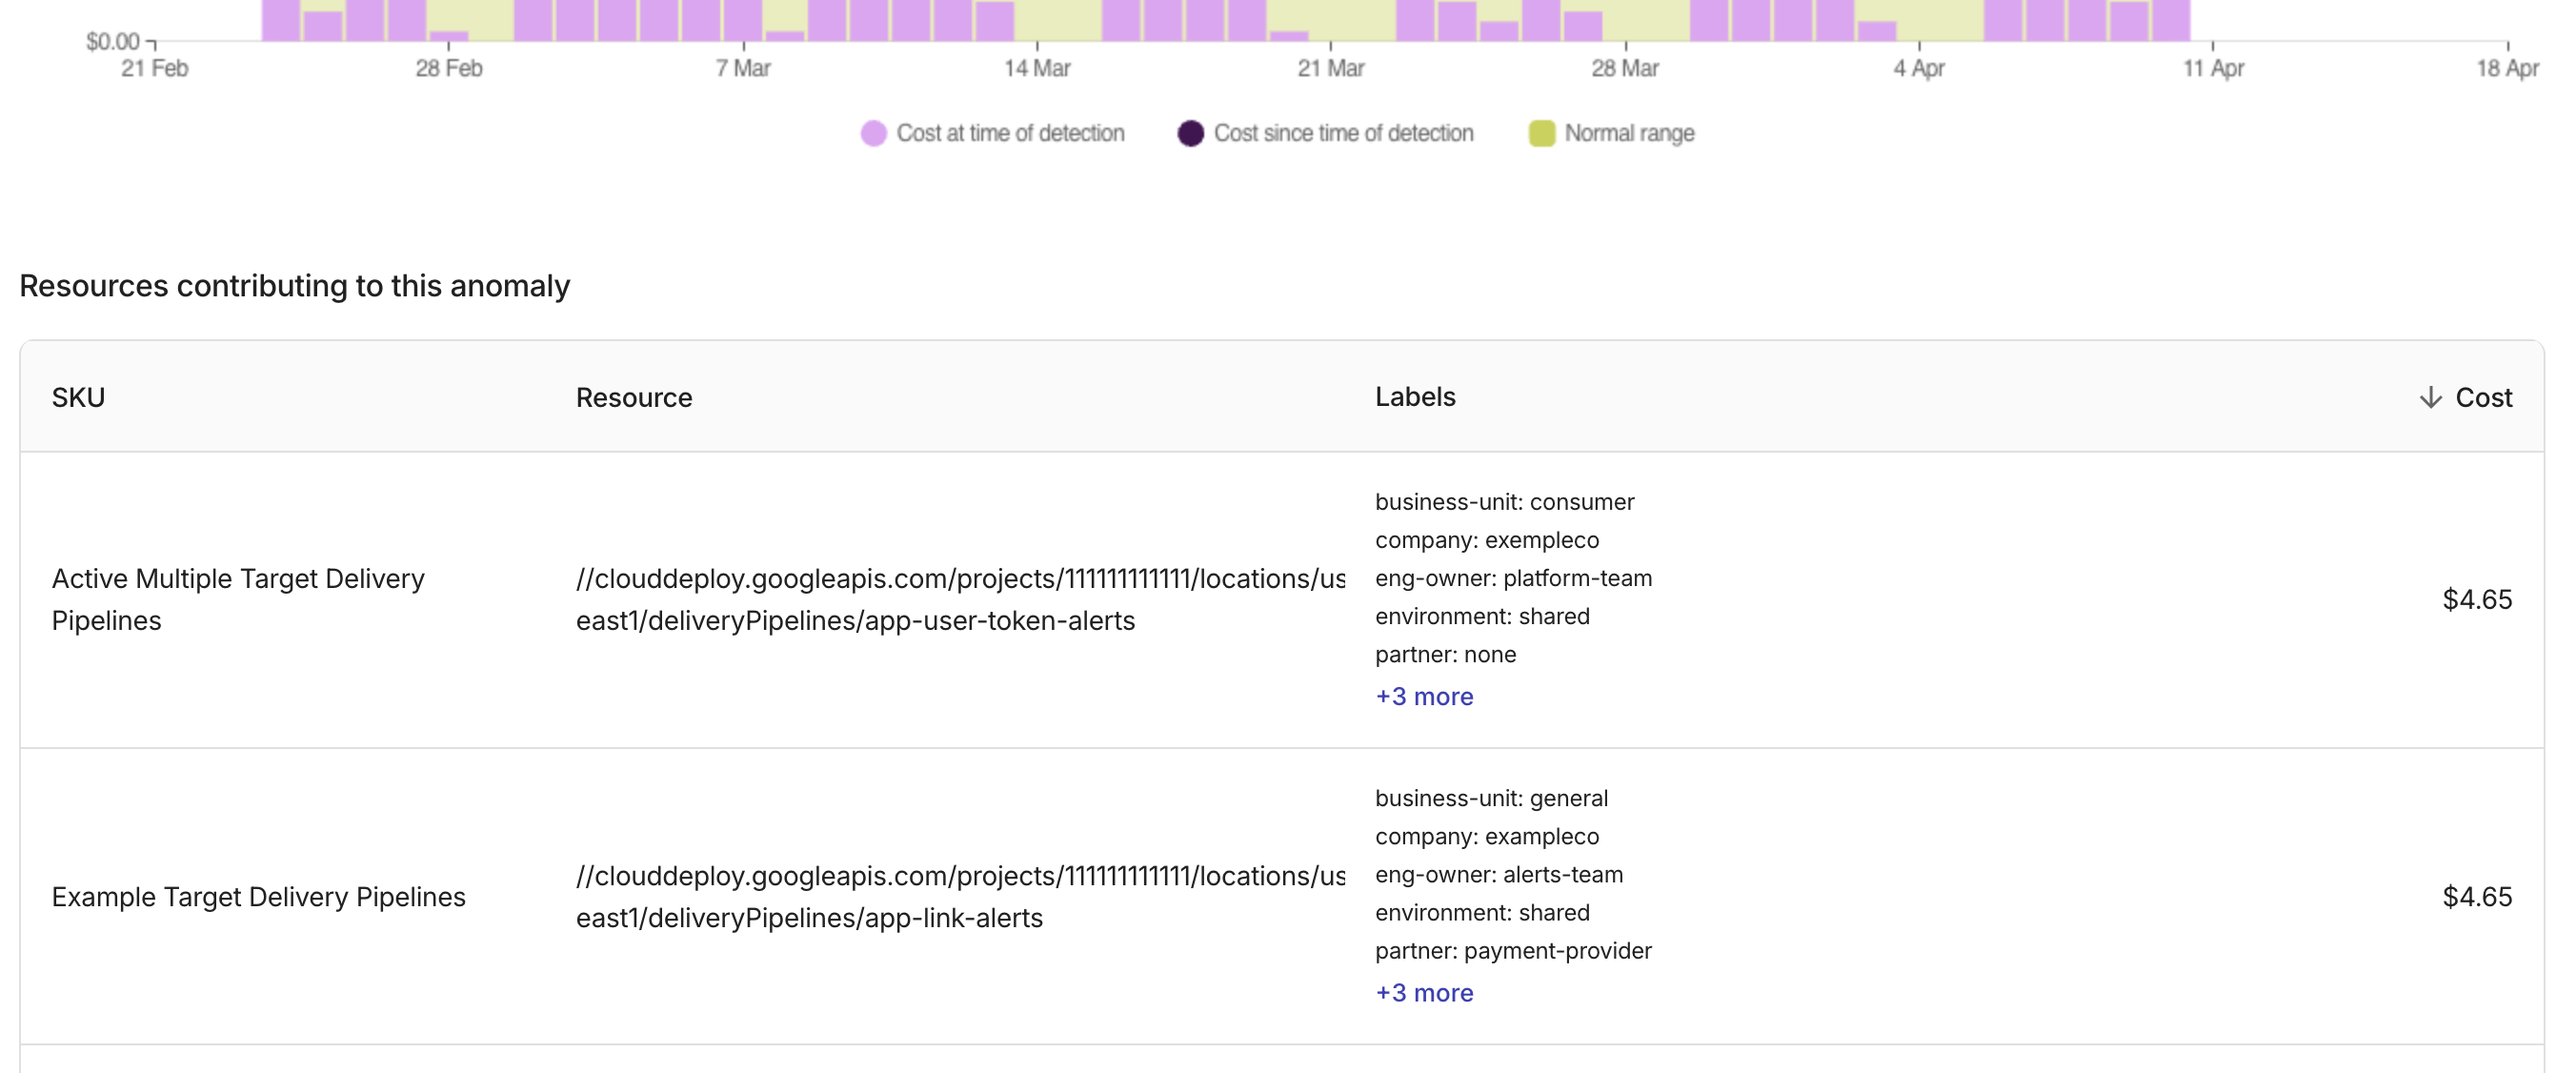
Contributors
The Resources contributing to this anomaly table appears below the AI analysis section. If AI analysis is not available, the table appears directly below the chart instead.
Use this table with AI analysis to see which resources drove the spike. The table includes a SKU column listing the contributing SKUs or All for service-level anomalies.
When labels (GCP) or cost-allocation tags (AWS/Azure) are available, they appear in the Labels/Tags column. This helps you identify the team, project, or environment responsible for the anomalous spend.
The example below shows an anomaly with multiple contributing SKUs across different projects.
Investigate and take action
The side panel on the anomaly details page provides actions to help you investigate and respond to the anomaly.
Open in reports
Cloud Analytics Reports does not support real-time usage data at this time. To investigate a real-time anomaly, try AI analysis.
To decide whether a detected anomaly is really an issue in the context of your business, select Open in Reports in the side panel. It will open a Cloud Analytics report that groups costs by SKUs and uses the provider, service, billing account, project/account ID, and allocation as filters. Select Run report to see the result.
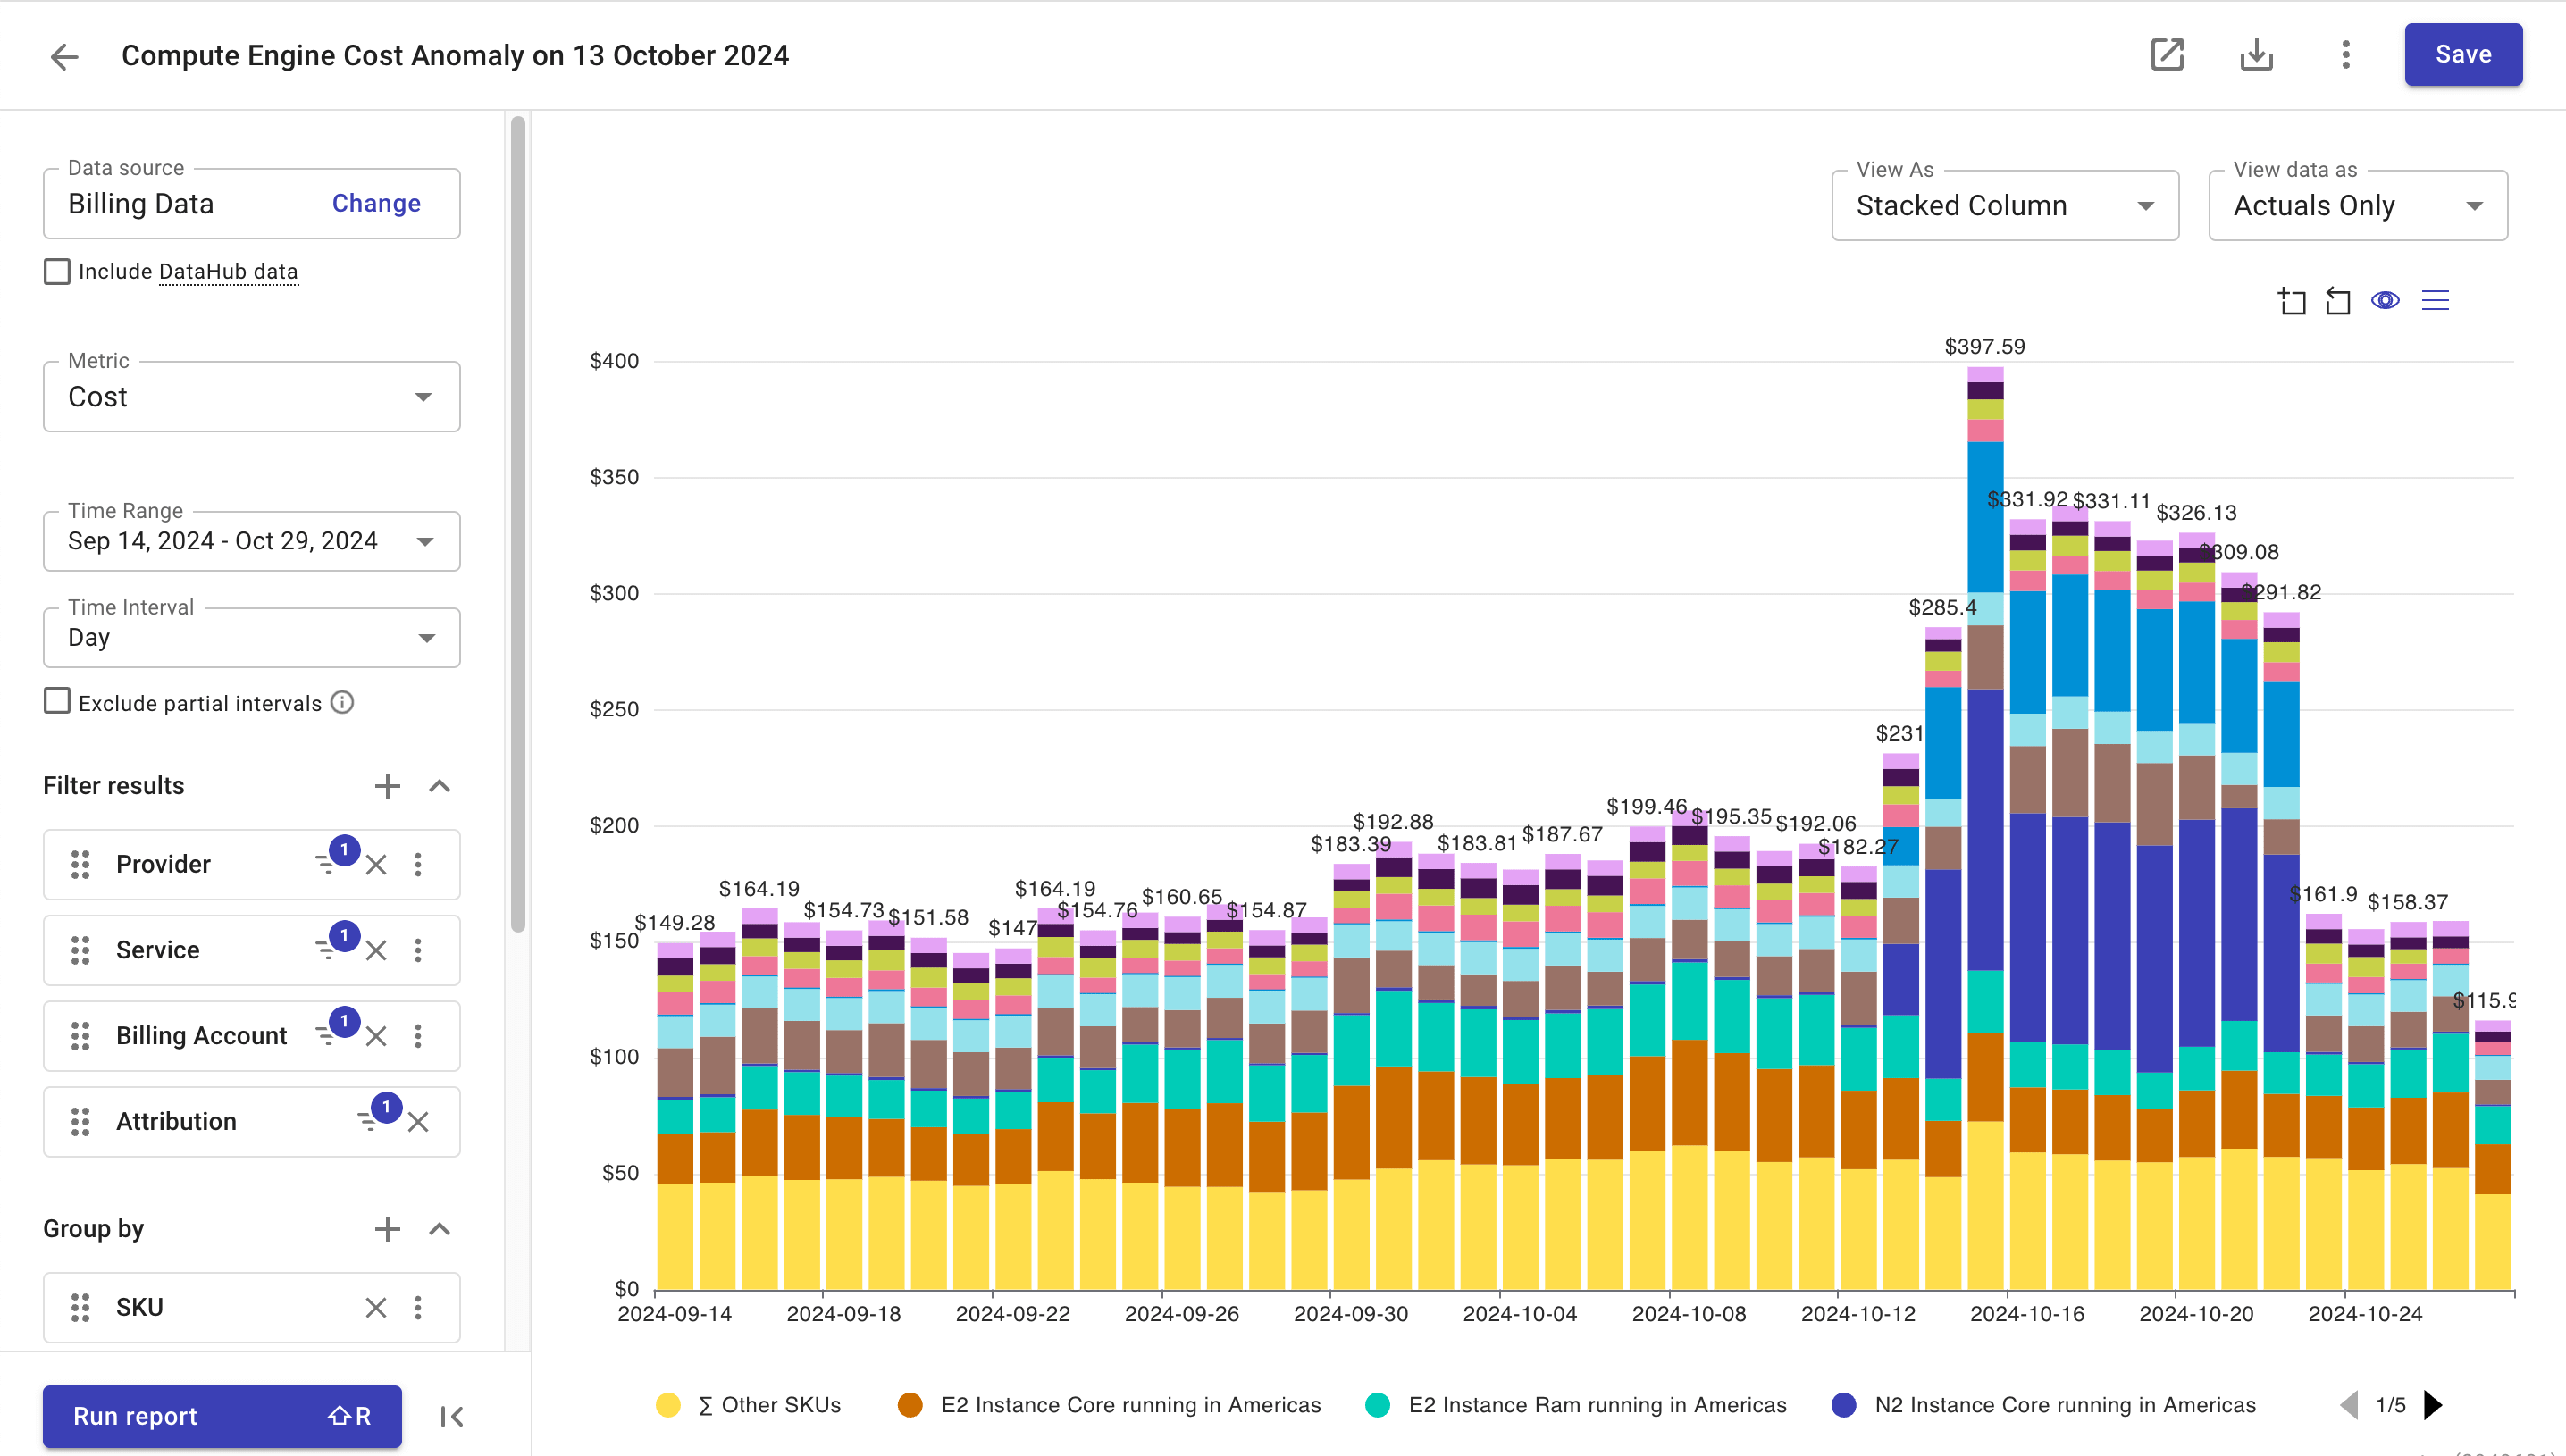
When viewing a report, be aware that reports always use the latest usage and cost data available, while the data in cost anomaly charts is only updated until the anomaly becomes Inactive.
Open in Cloud Diagrams
If your tenant has Cloud Diagrams enabled, you can select Open in Cloud Diagrams in the side panel to view the anomaly's resources in your cloud diagram. The diagram opens with the cost heatmap active, so you can immediately see how the anomaly relates to surrounding resources.
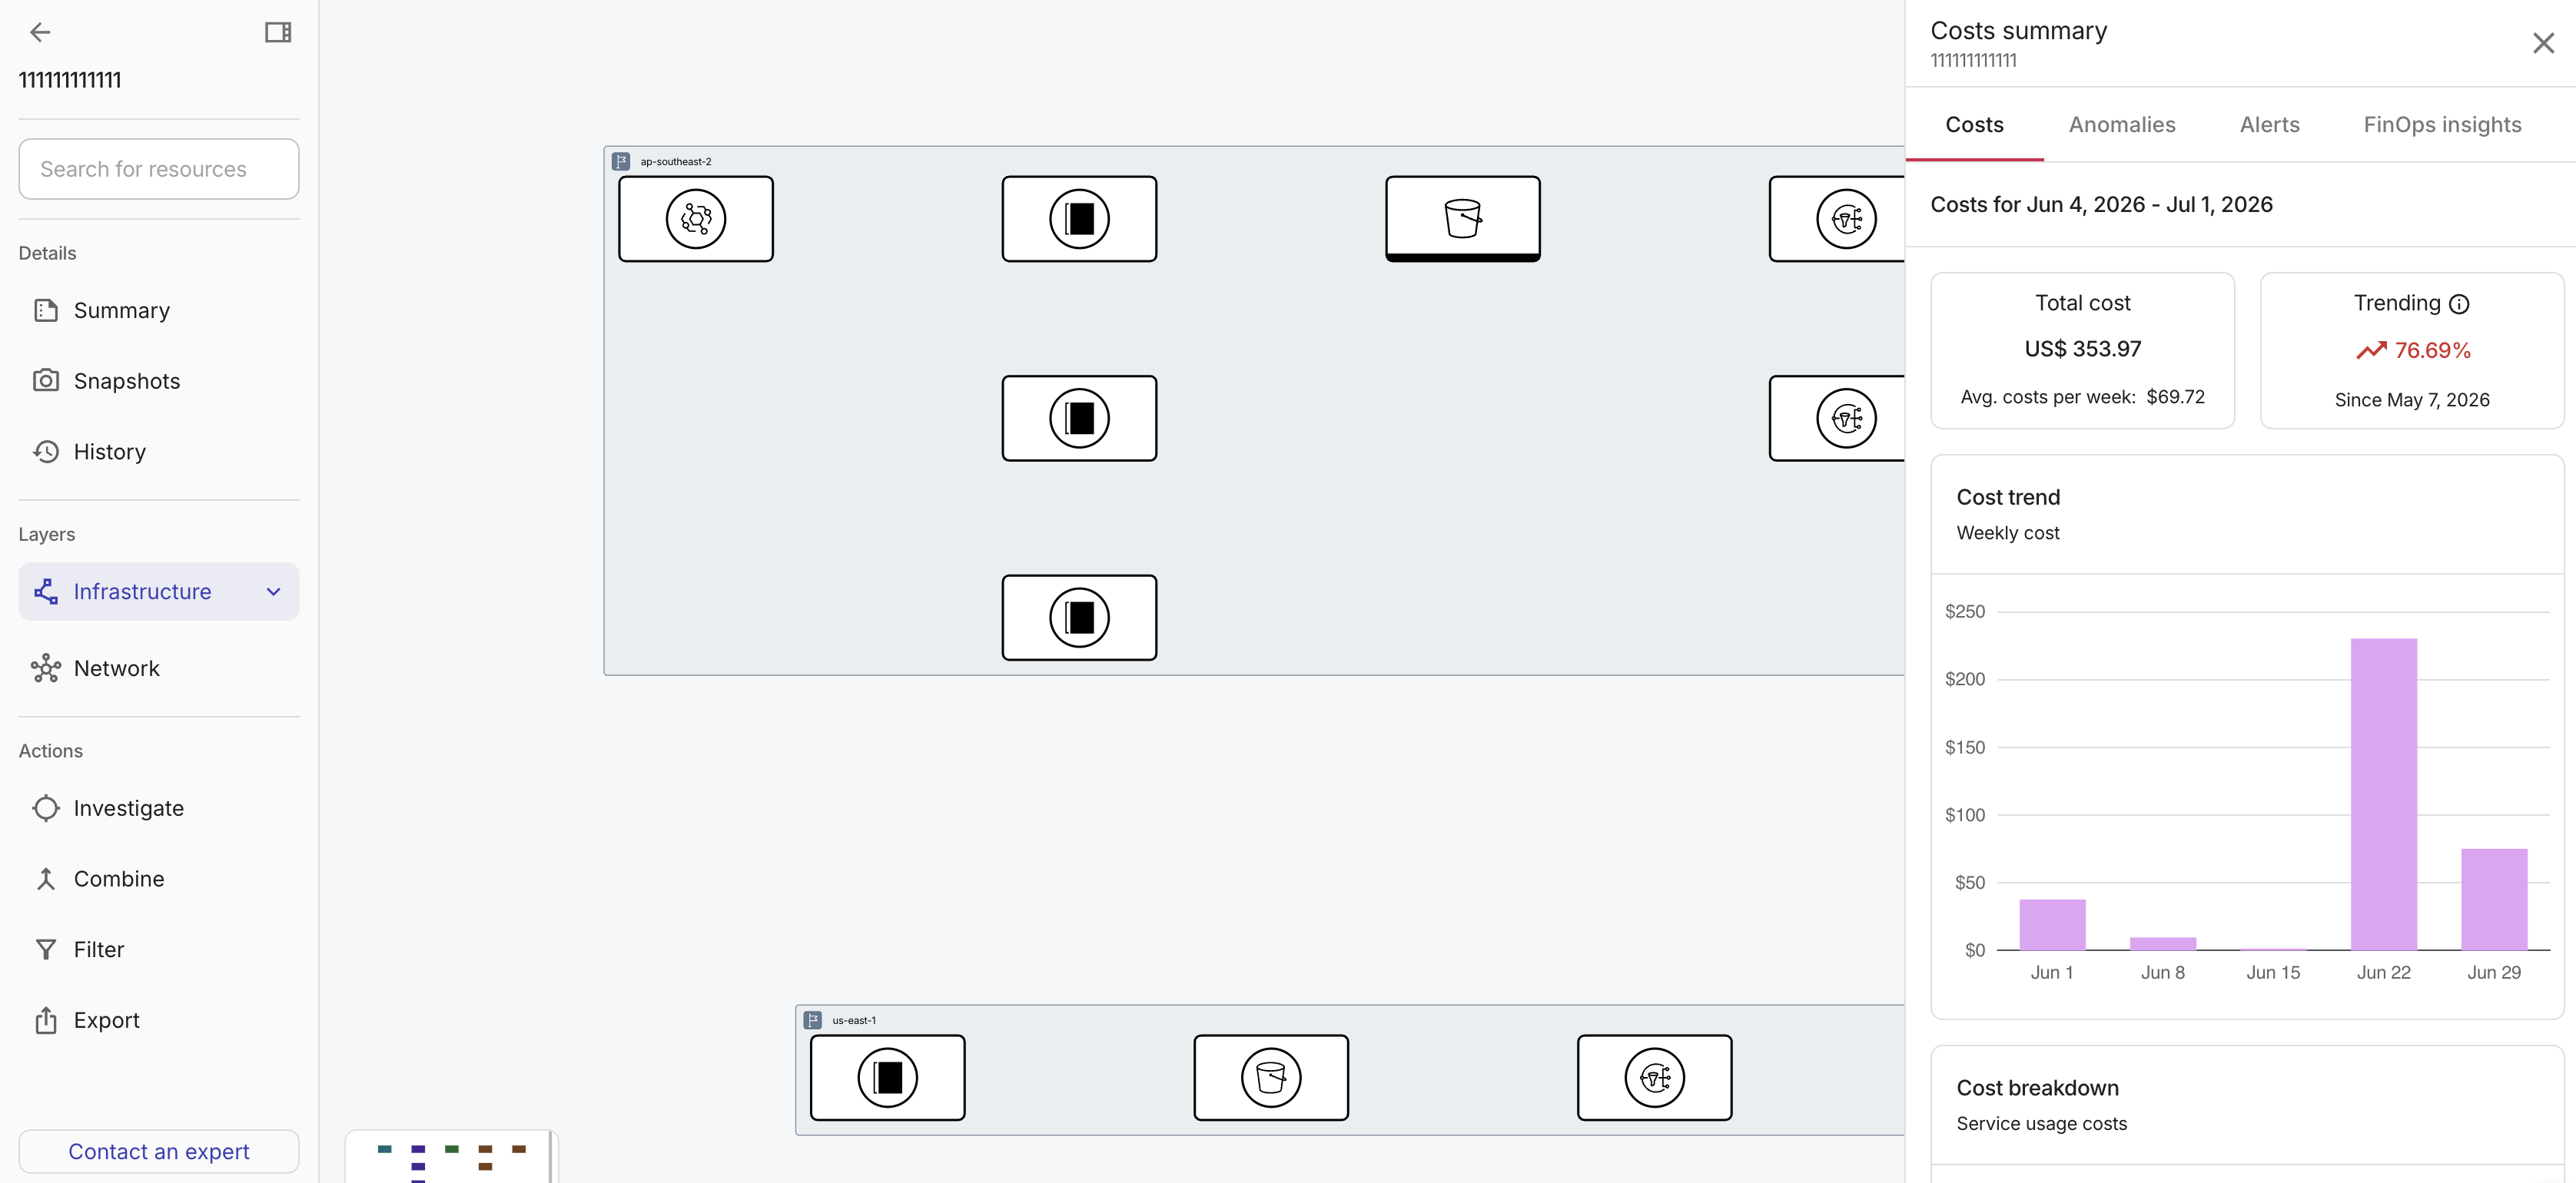
When the anomaly maps to a single diagram, selecting the button opens it directly. When multiple diagrams match, a dropdown lets you choose which diagram to open.
If Cloud Diagrams is not enabled, the side panel shows Enable Cloud Diagrams instead and walks you through enabling the feature.
AI analysis
When AI-generated analysis is available, a collapsible AI analysis overview section appears below the cost anomaly chart. This section surfaces insights from the anomaly detection system directly on the page.
Available only when your organization has Ava access on its DoiT plan.
The overview includes:
-
SKU details: An explanation of the specific SKU or service that triggered the anomaly.
-
Next steps: Recommended actions to investigate or address the anomaly.
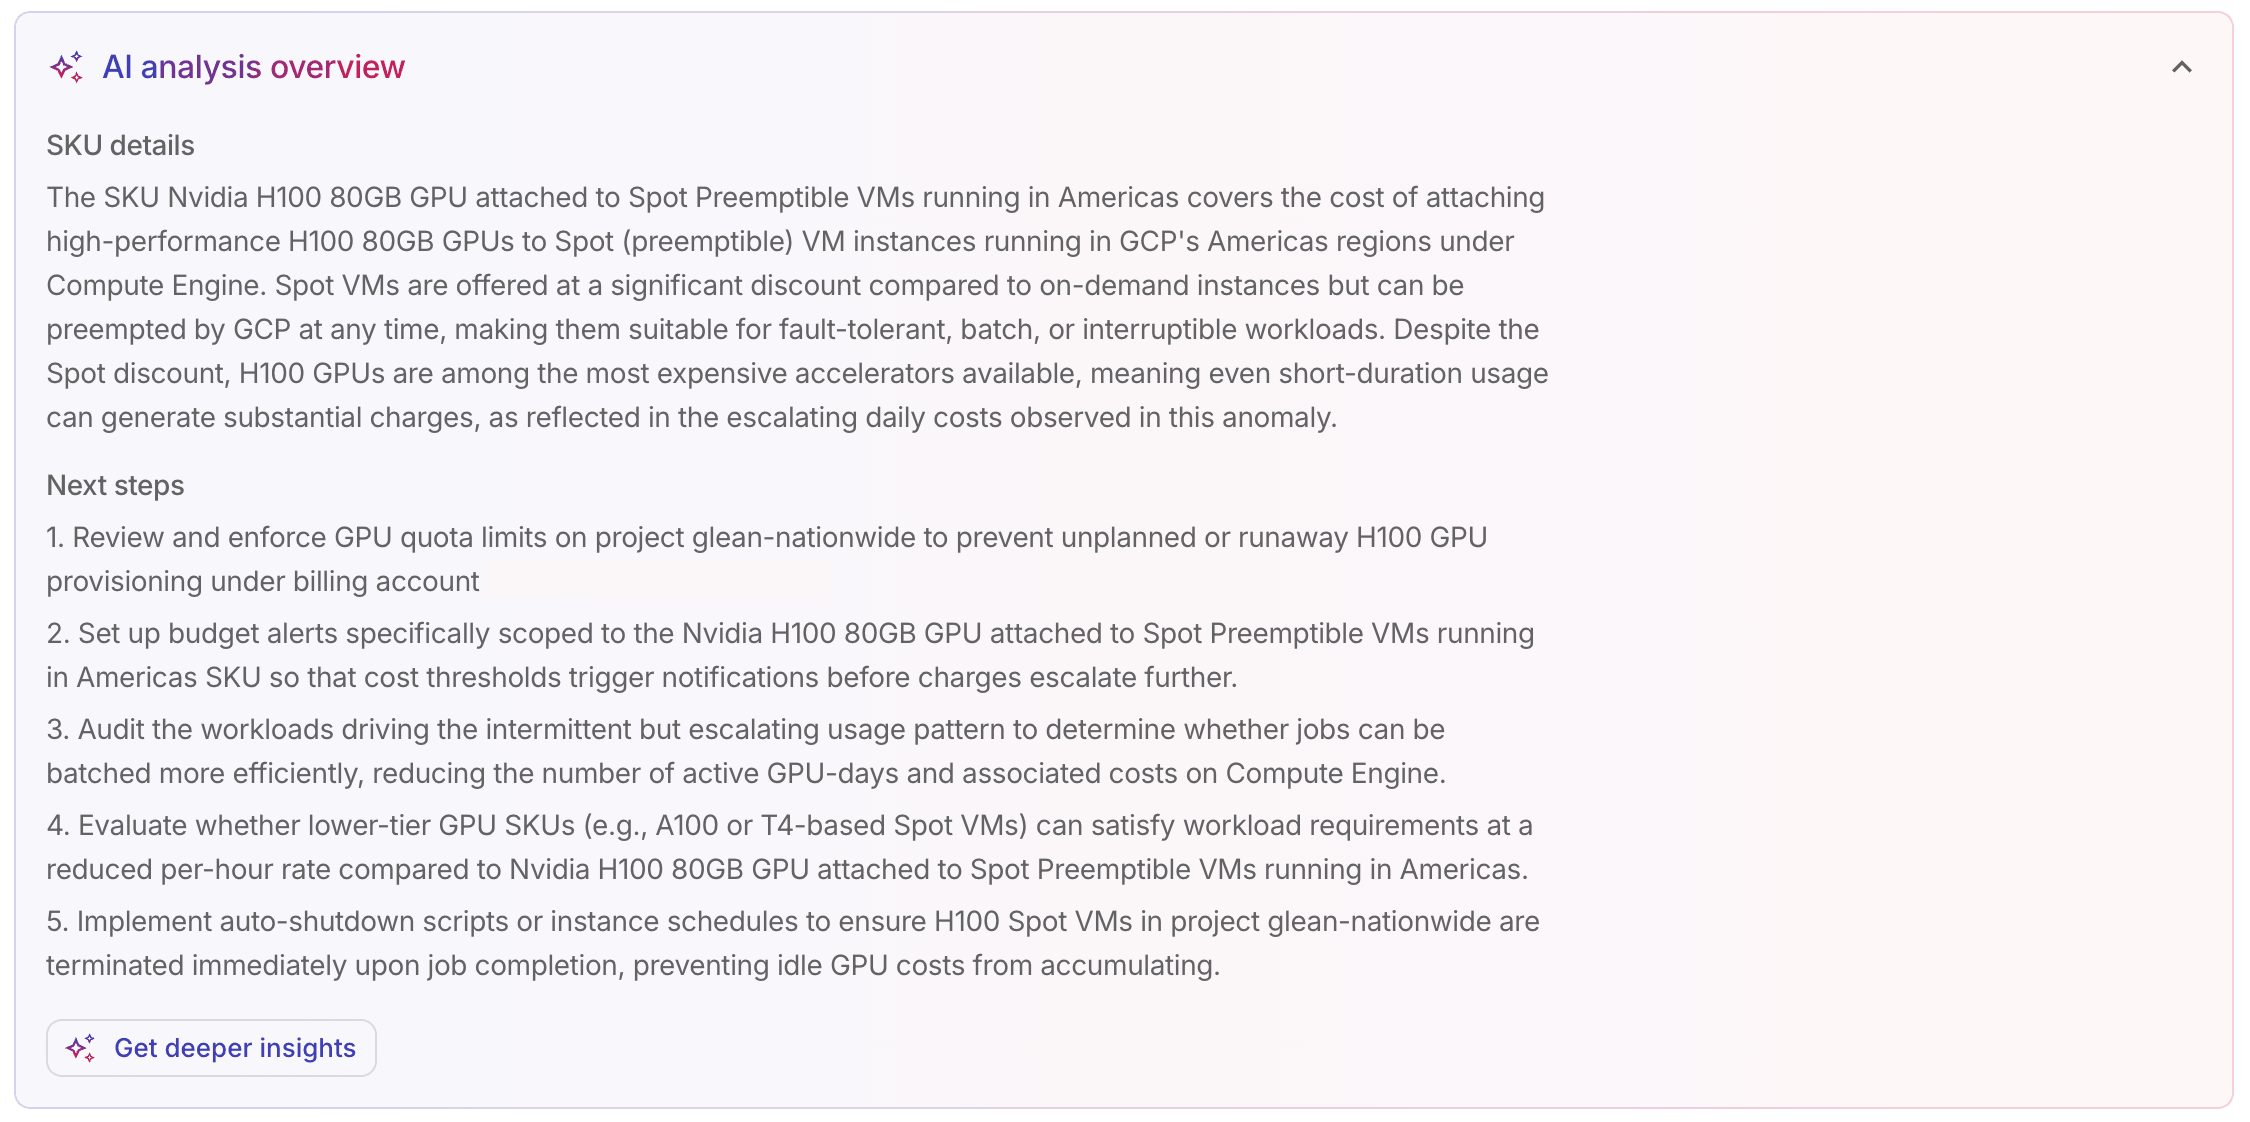
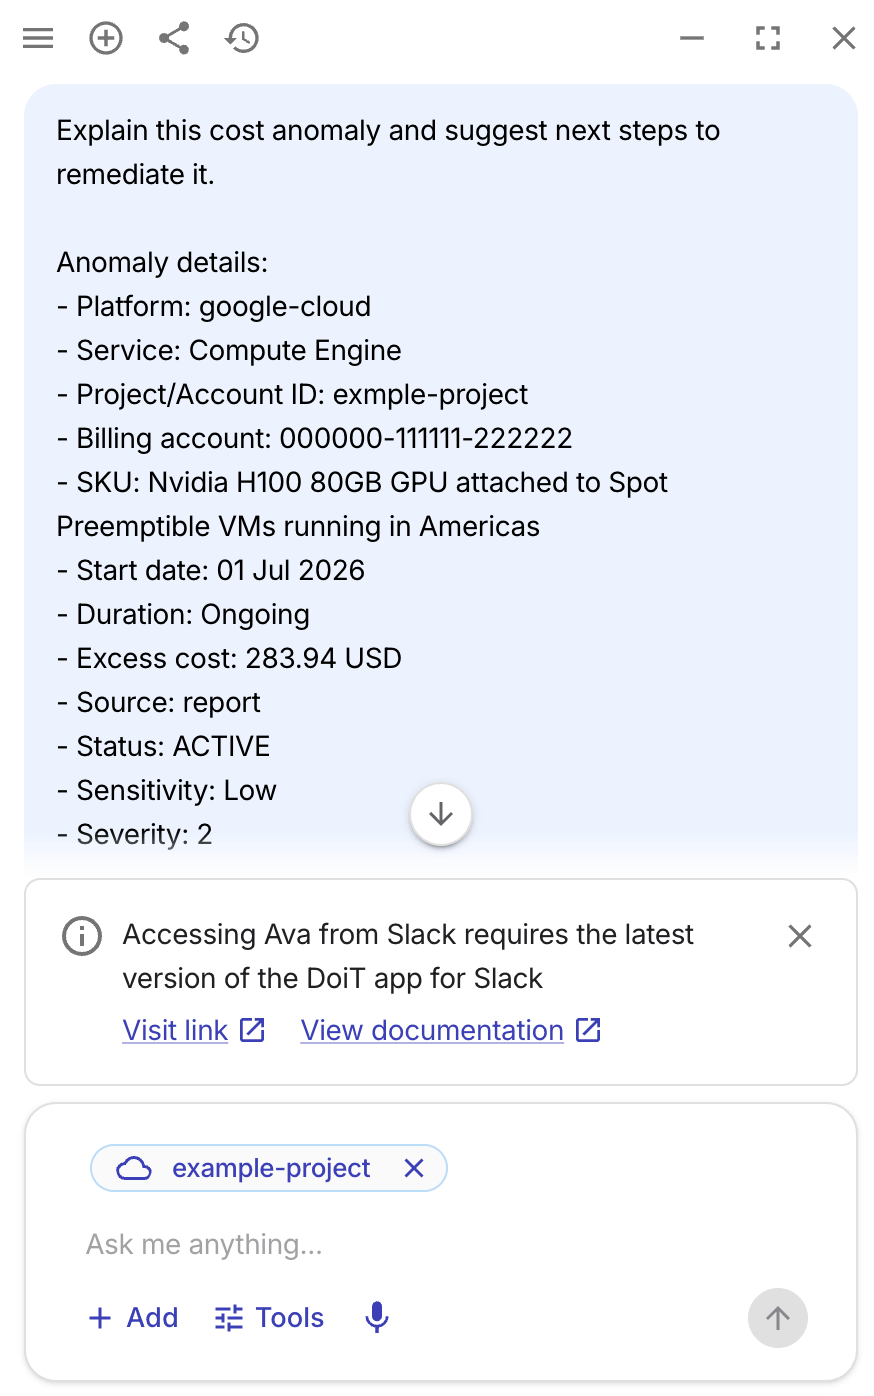
To explore the anomaly further, select Get deeper insights to open Ava, the AI assistant. Ava receives the anomaly's metadata — including the cloud platform, service, dates, cost, and severity — so that its analysis is specific to the anomaly you're viewing.
For AWS and Google Cloud anomalies, Ava also automatically pre-selects the affected account or project as a context item, scoping its responses to that particular cloud environment.
Annotate report
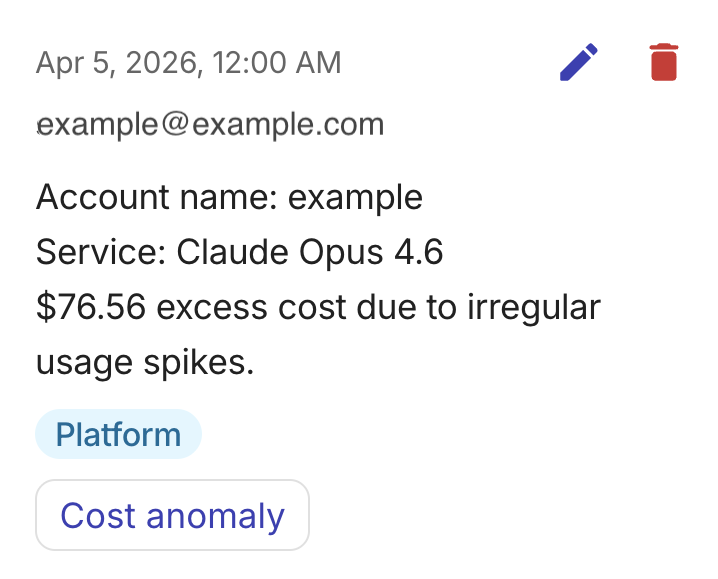
You can create an annotation that is pre-populated with the anomaly data by selecting Annotate report in the side panel. For detailed instructions, see Report annotations.
To create an annotation, you must have the Cloud Analytics Admin permission.
When viewing the annotation on a report, it includes a source link to the anomaly details page. The annotation also appears in the Annotations section on the anomaly details page, where you can edit or delete it.
Acknowledge anomaly
An acknowledged anomaly refers to one that has been reviewed and classified. See Acknowledge anomalies.
Get expert advice
If you have a DoiT Cloud Intelligence Enhanced or Enterprise plan, you can get expert advice from DoiT directly from the anomaly details page. Select New expert inquiry in the header to create an expert inquiry with the anomaly's context prefilled, including the cloud platform, service, project, and excess cost.