Investigate
You can use the Investigate feature in Cloud Diagrams for exploring, troubleshooting, and auditing. Instead of searching through different areas of your system, the Investigate feature enables you to quickly and easily zoom in to a specific subset of your diagram. You can select a resource and automatically see all the directly connected resources, for example, target groups, EC2s, Lambda functions, containers, and databases, making your diagrams both actionable and navigable, especially in large cloud environments.
Investigate is available for individual diagrams only and is not available for the global network layer.
Required permissions
To use Cloud Diagrams, your DoiT account must have the Cloud Diagram User permission.
Investigate example
The following example describes how to investigate the cause of an alert that has been reported about a SQL instance.
-
From the dashboard, select a diagram.
-
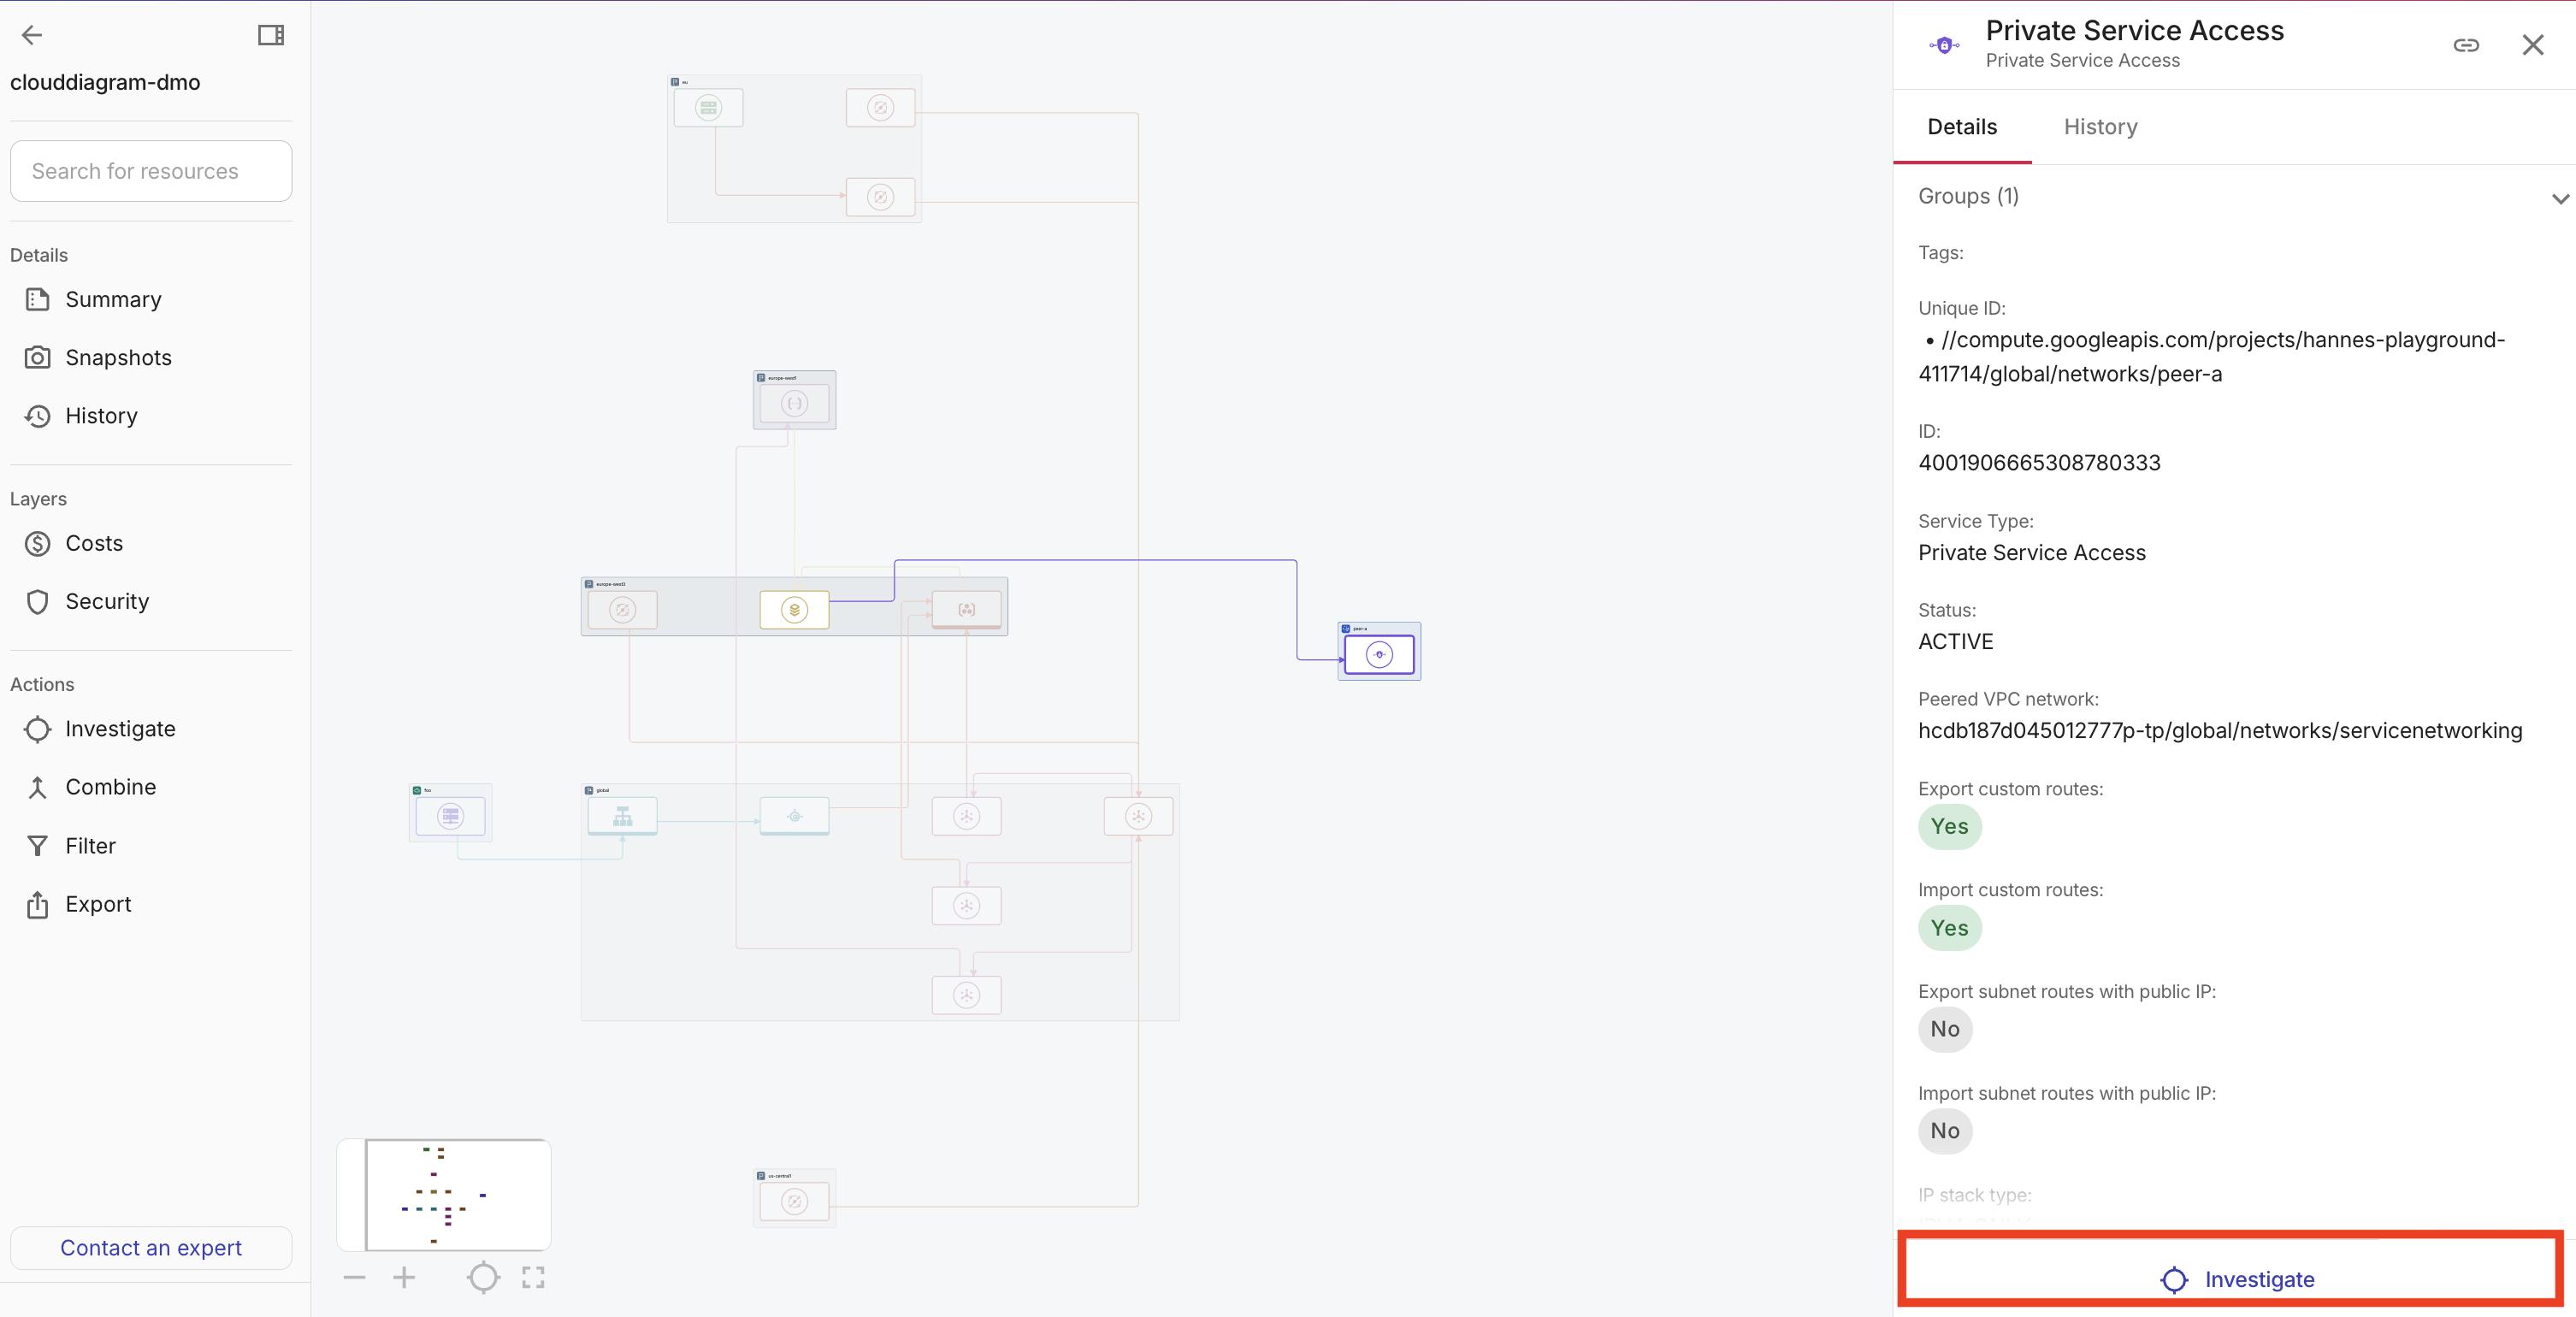
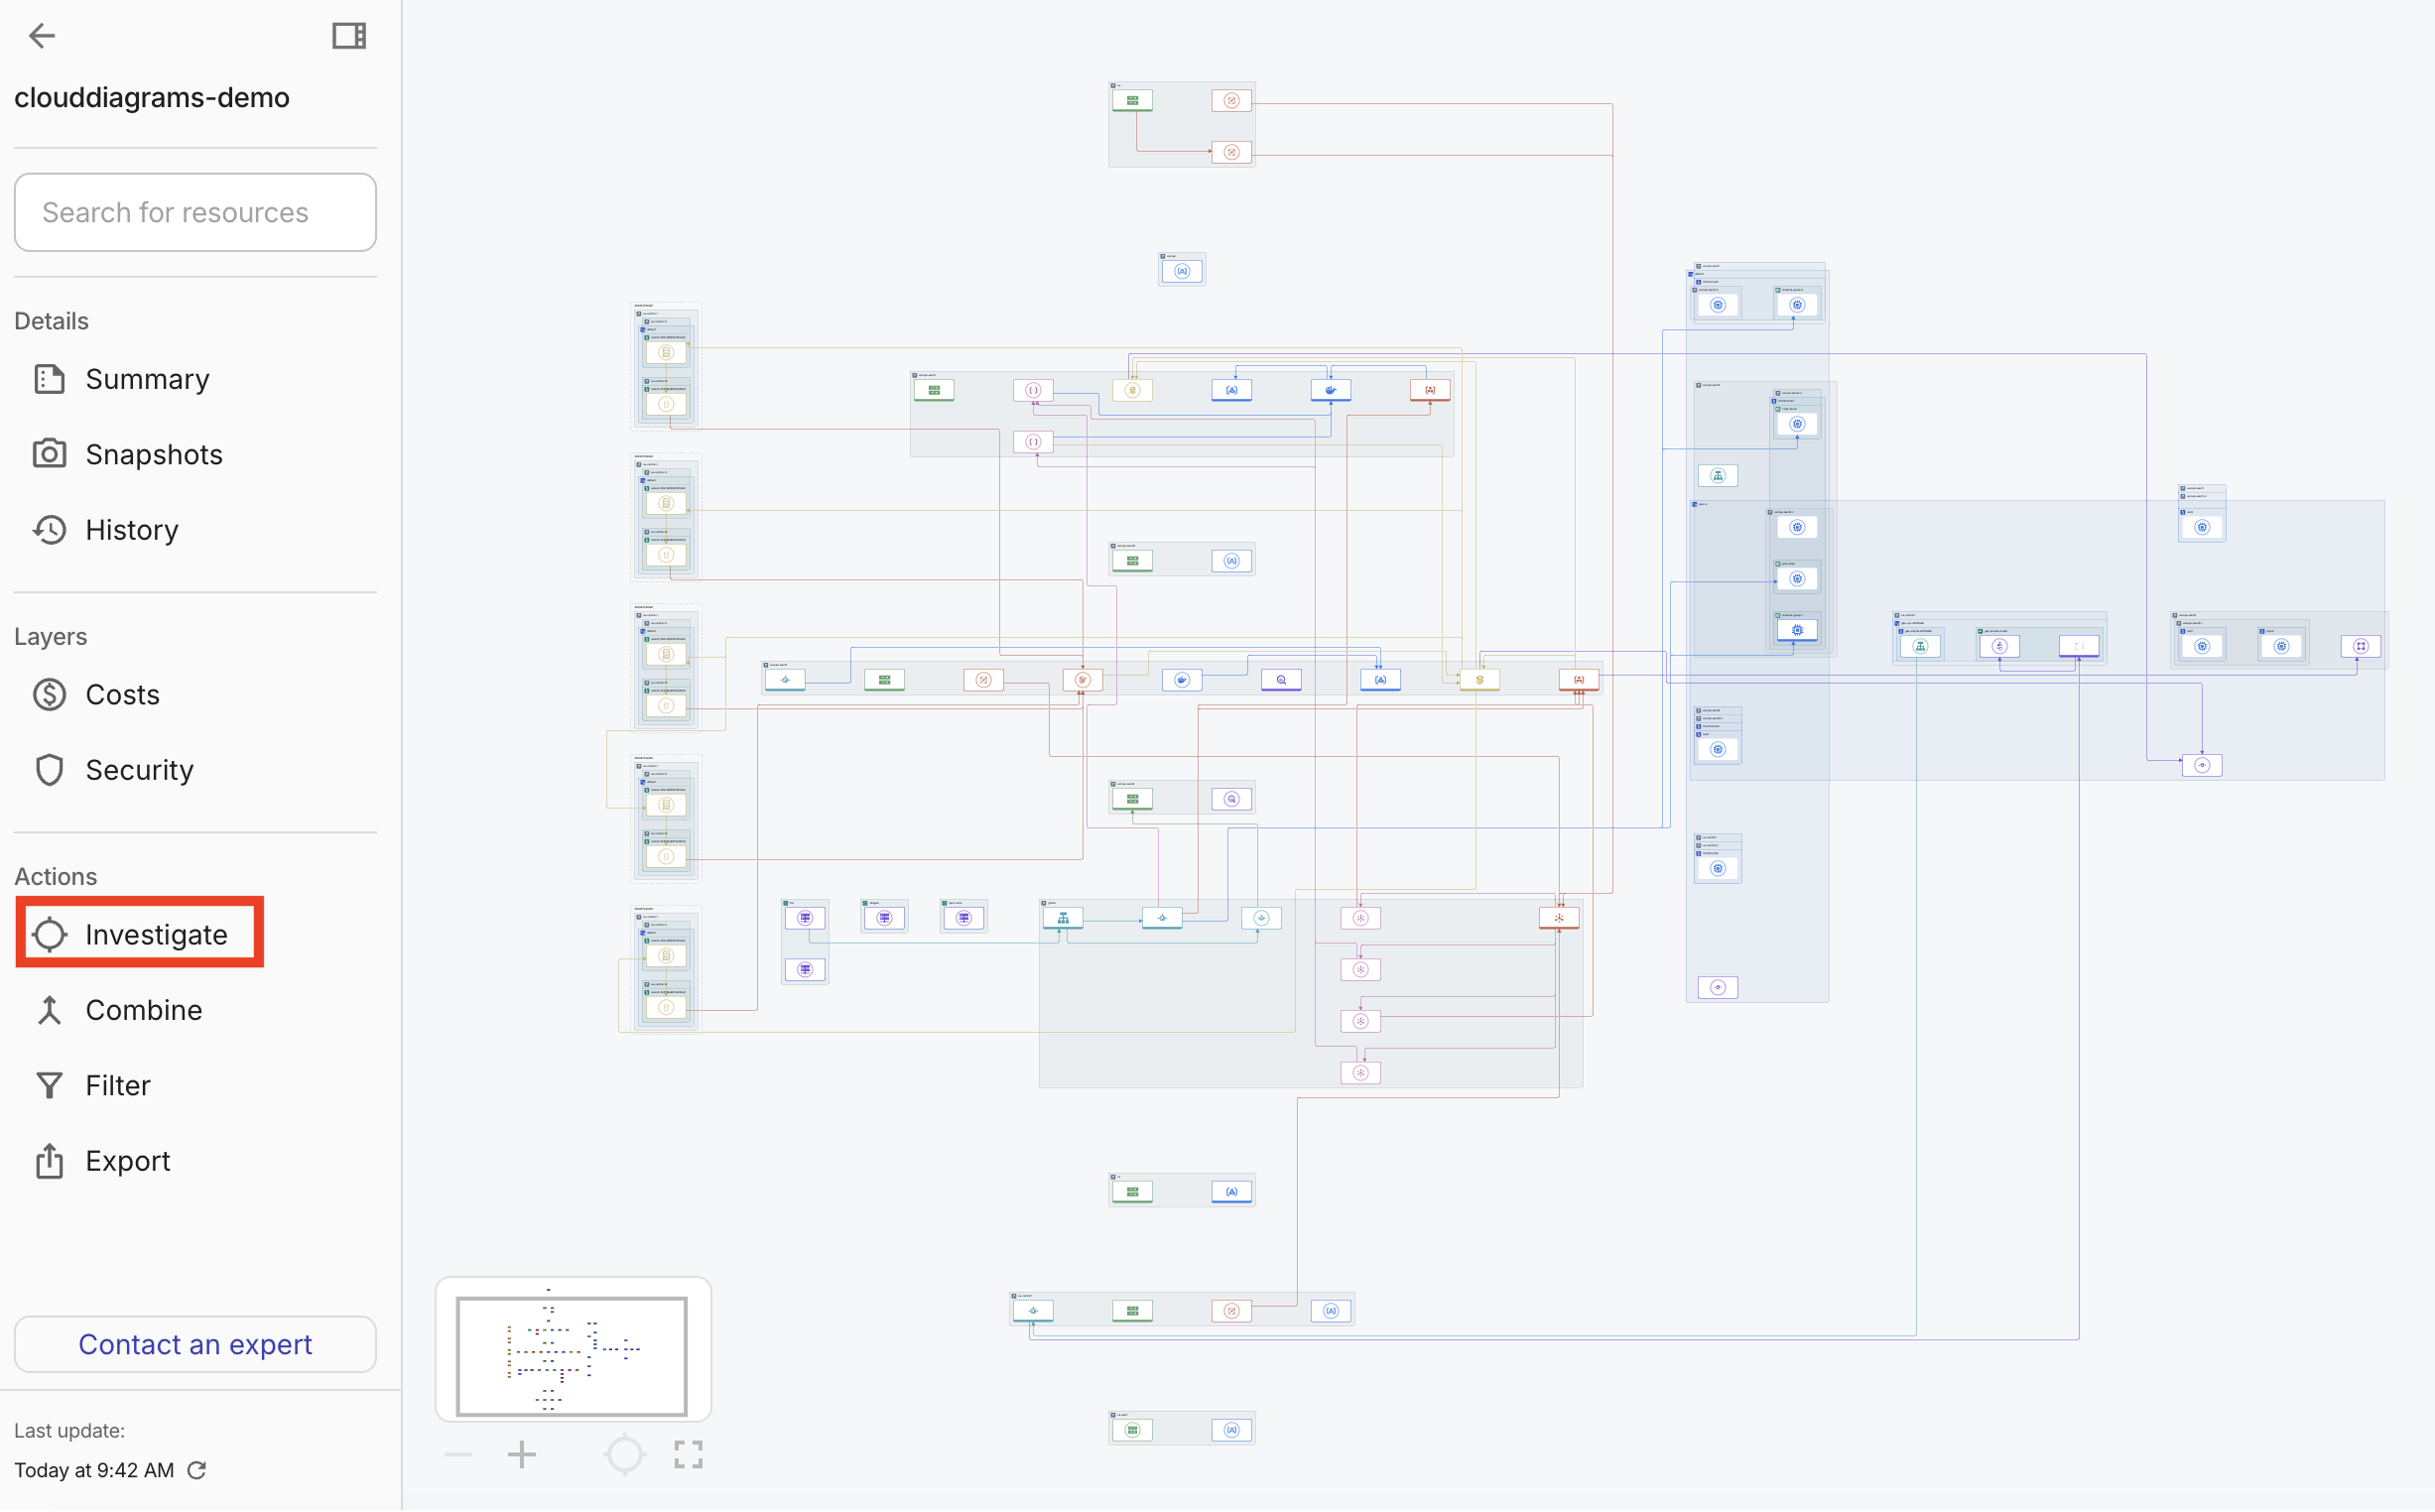
In the sidebar, under Actions, select Investigate.
-
Search for SQL. A list of SQL components and/or properties that match the search criteria is displayed.
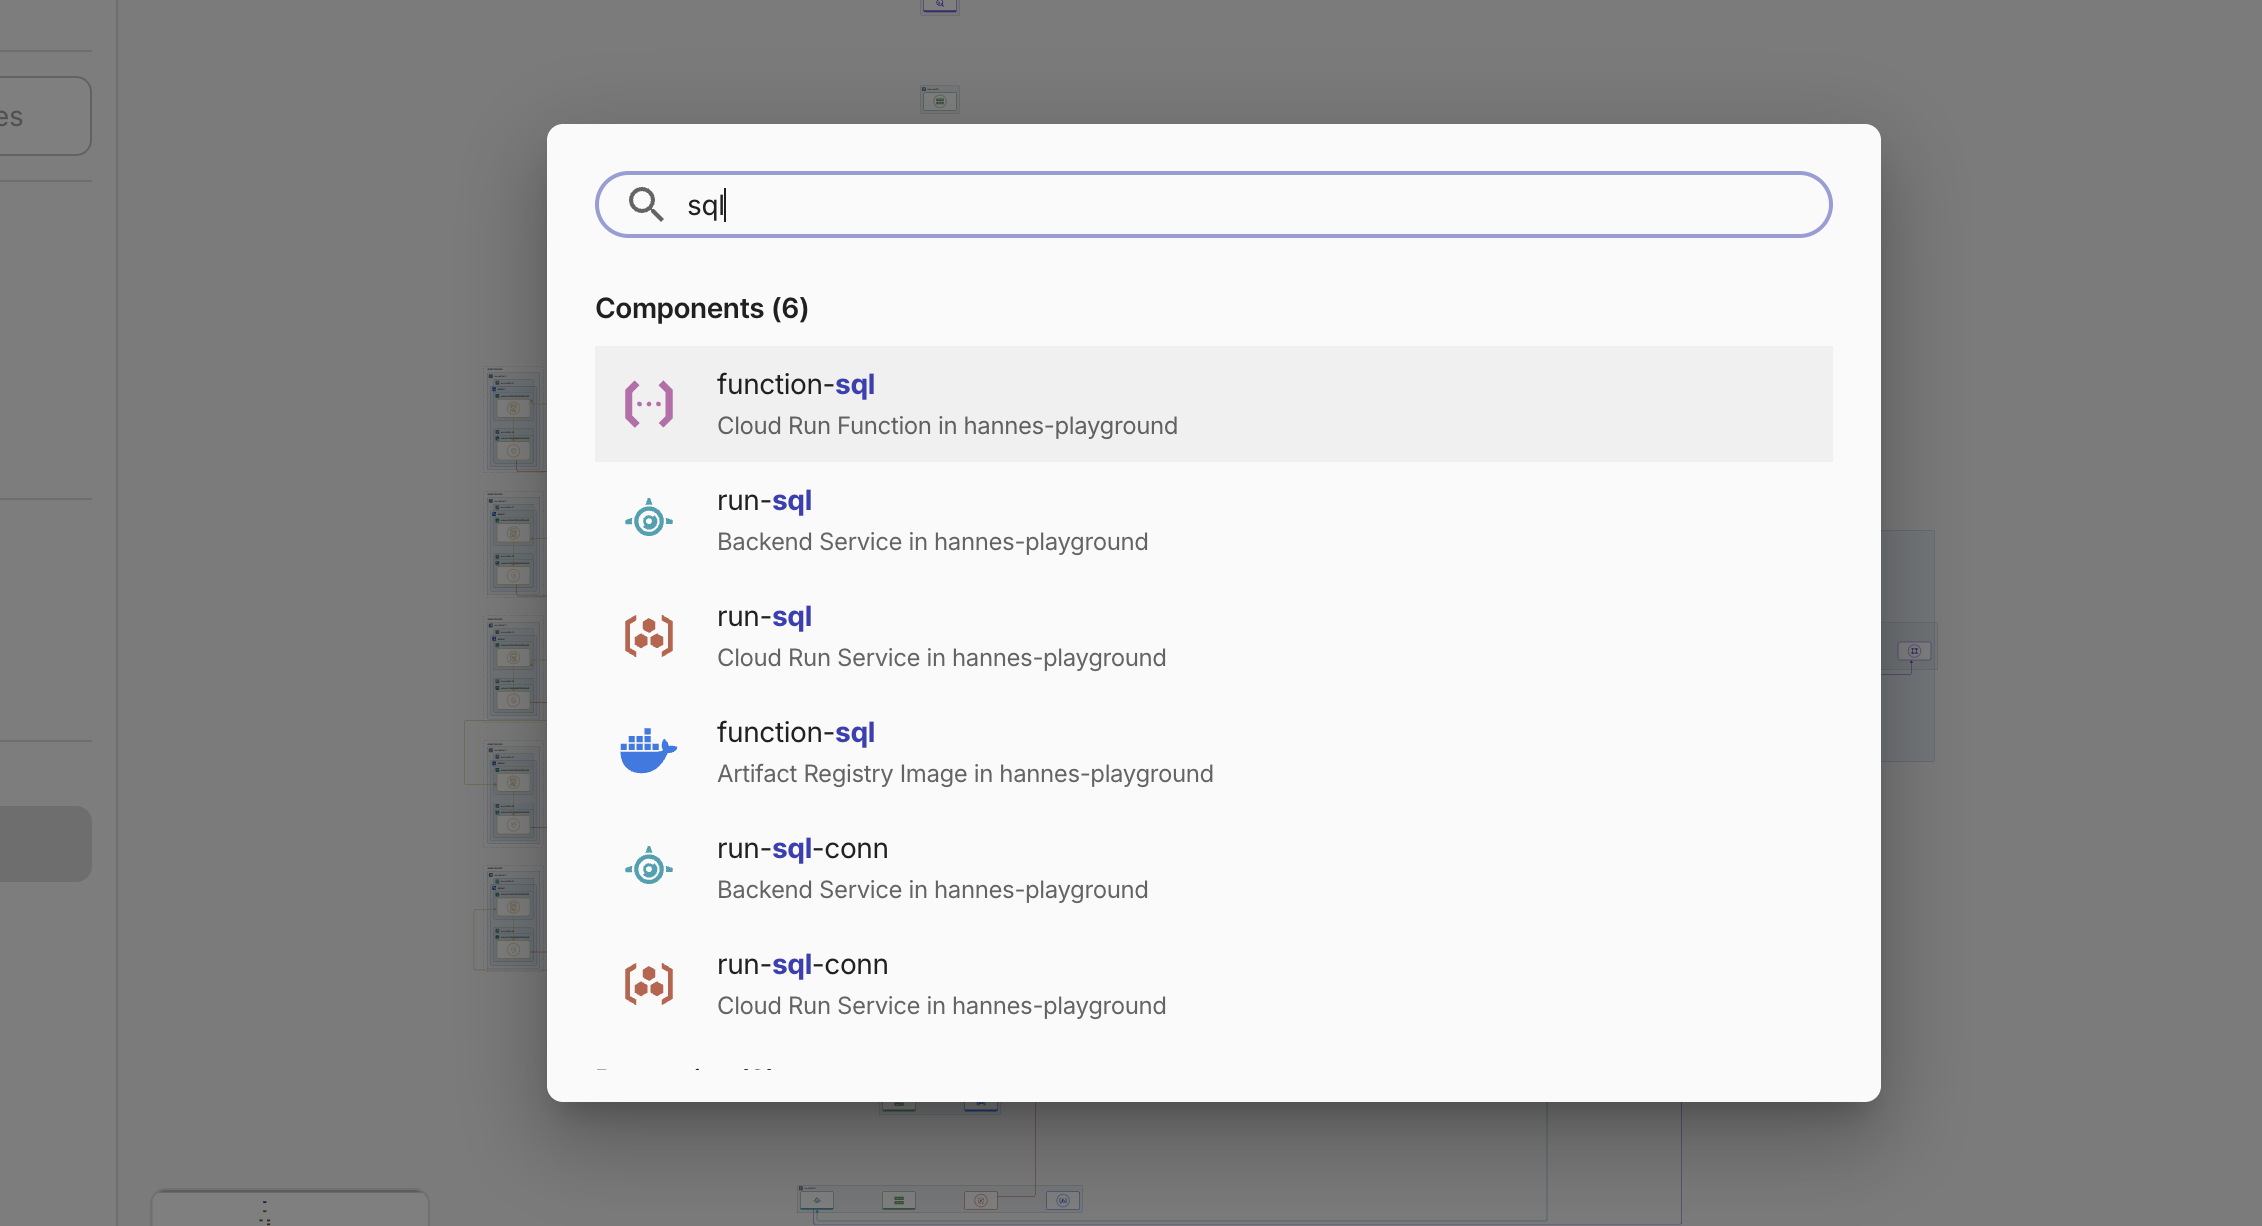
-
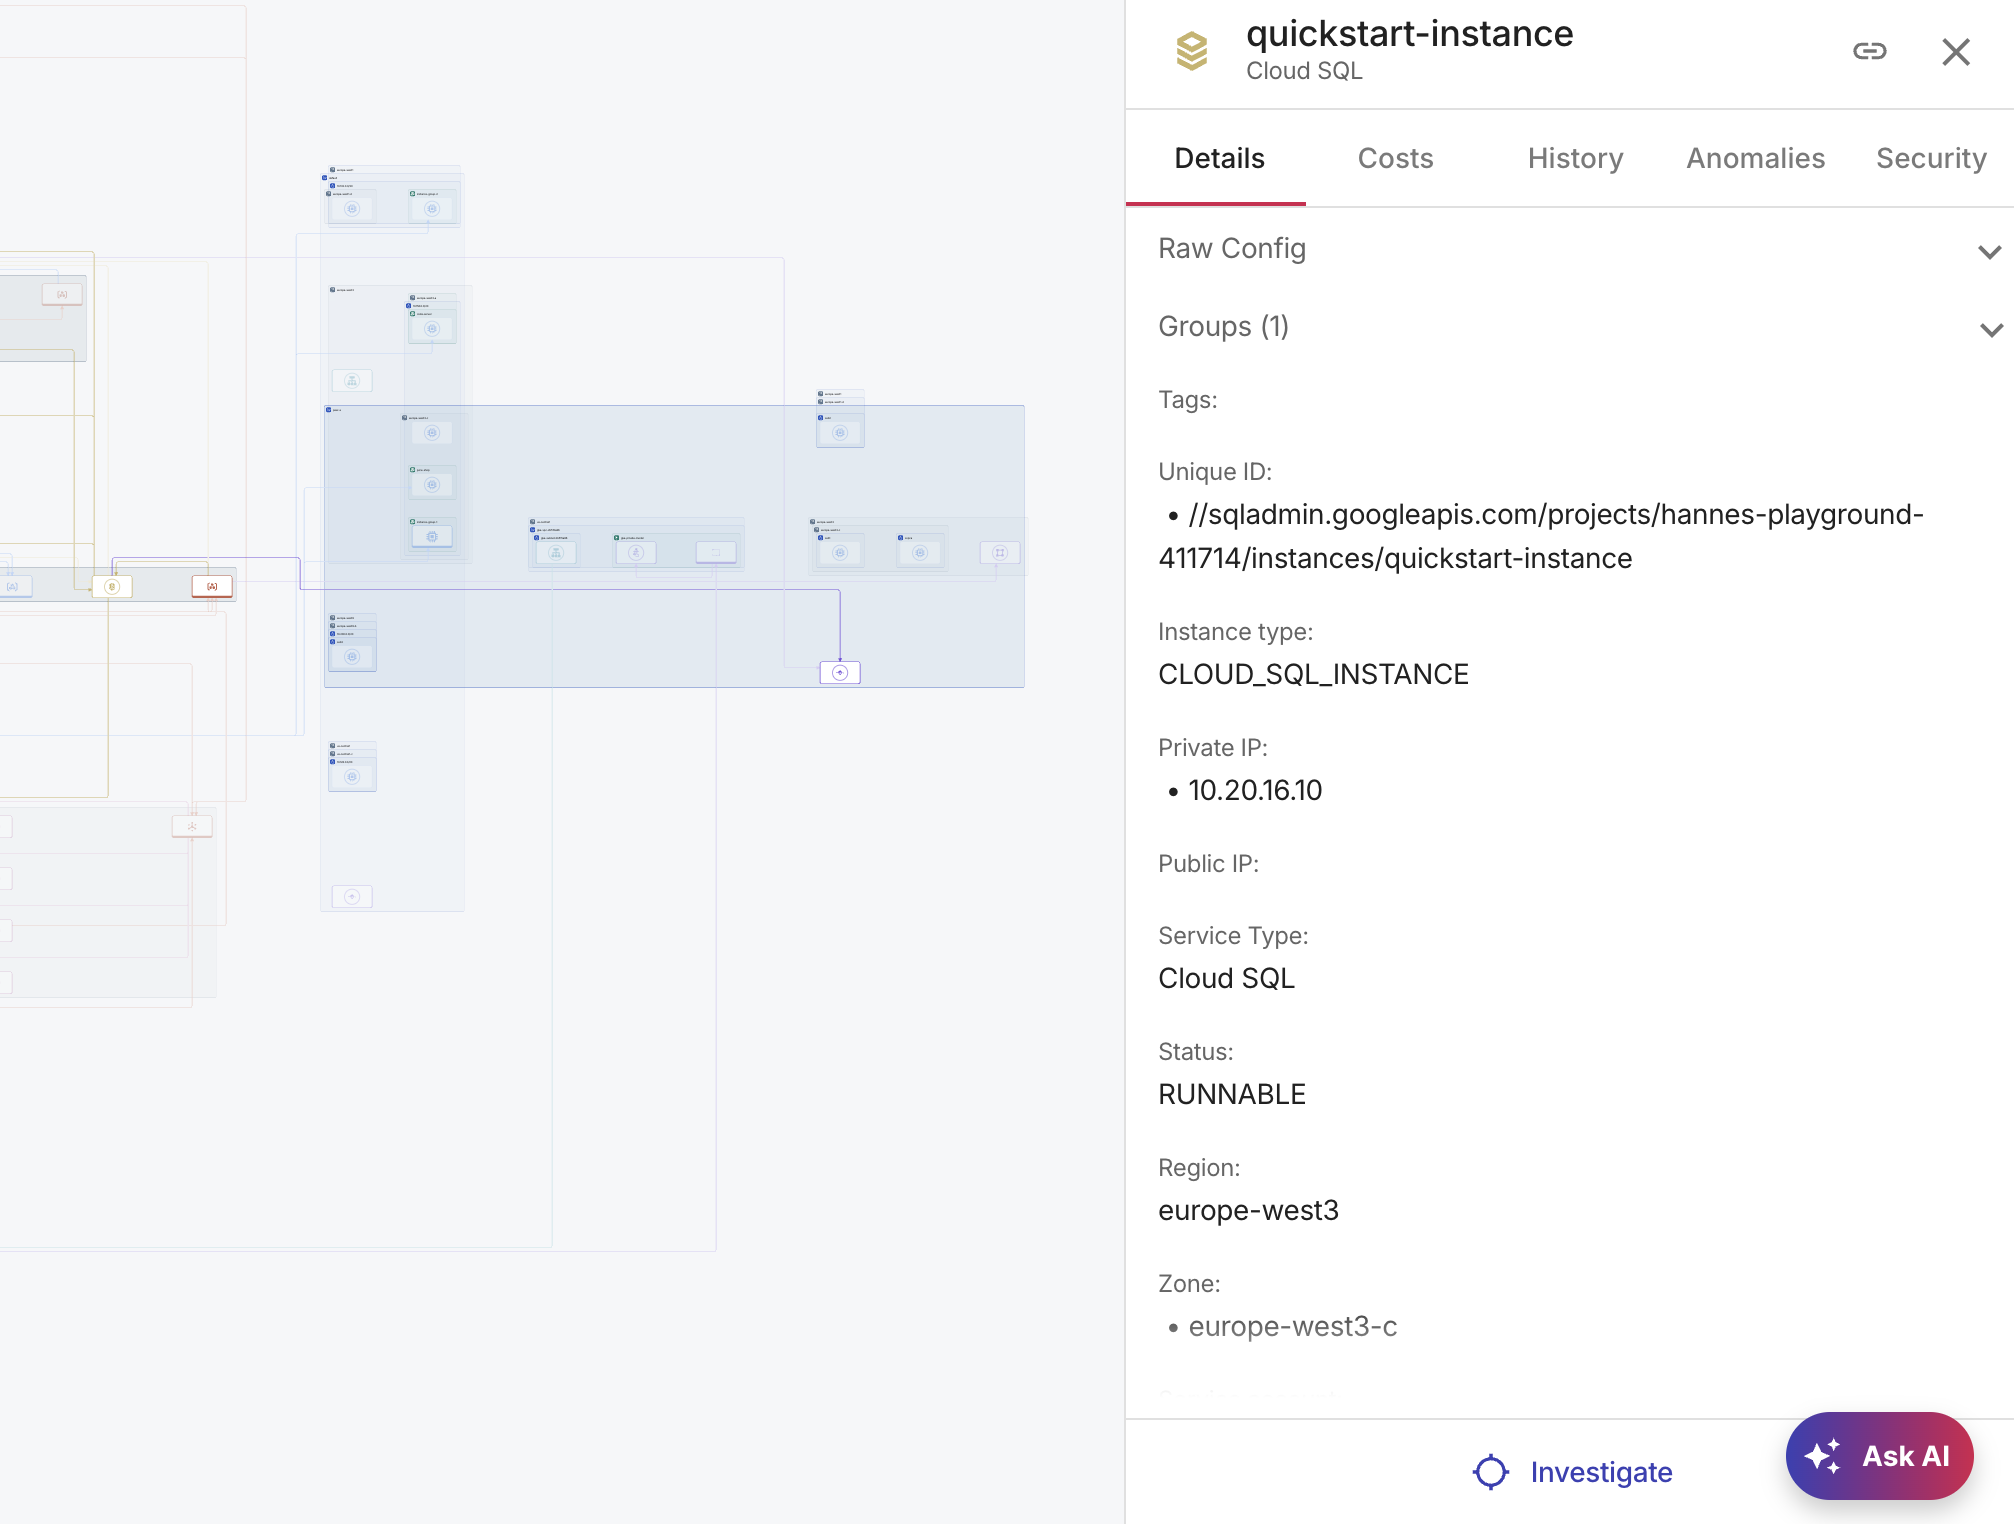
Select the quickstart-instance component. A diagram of the component or property and its directly related resources is displayed. In our case, the diagram displays the whole sub-tree for the selected SQL instance and all the adjacent nodes. In addition, we can see that there are three Cloud Run services connected to this instance.
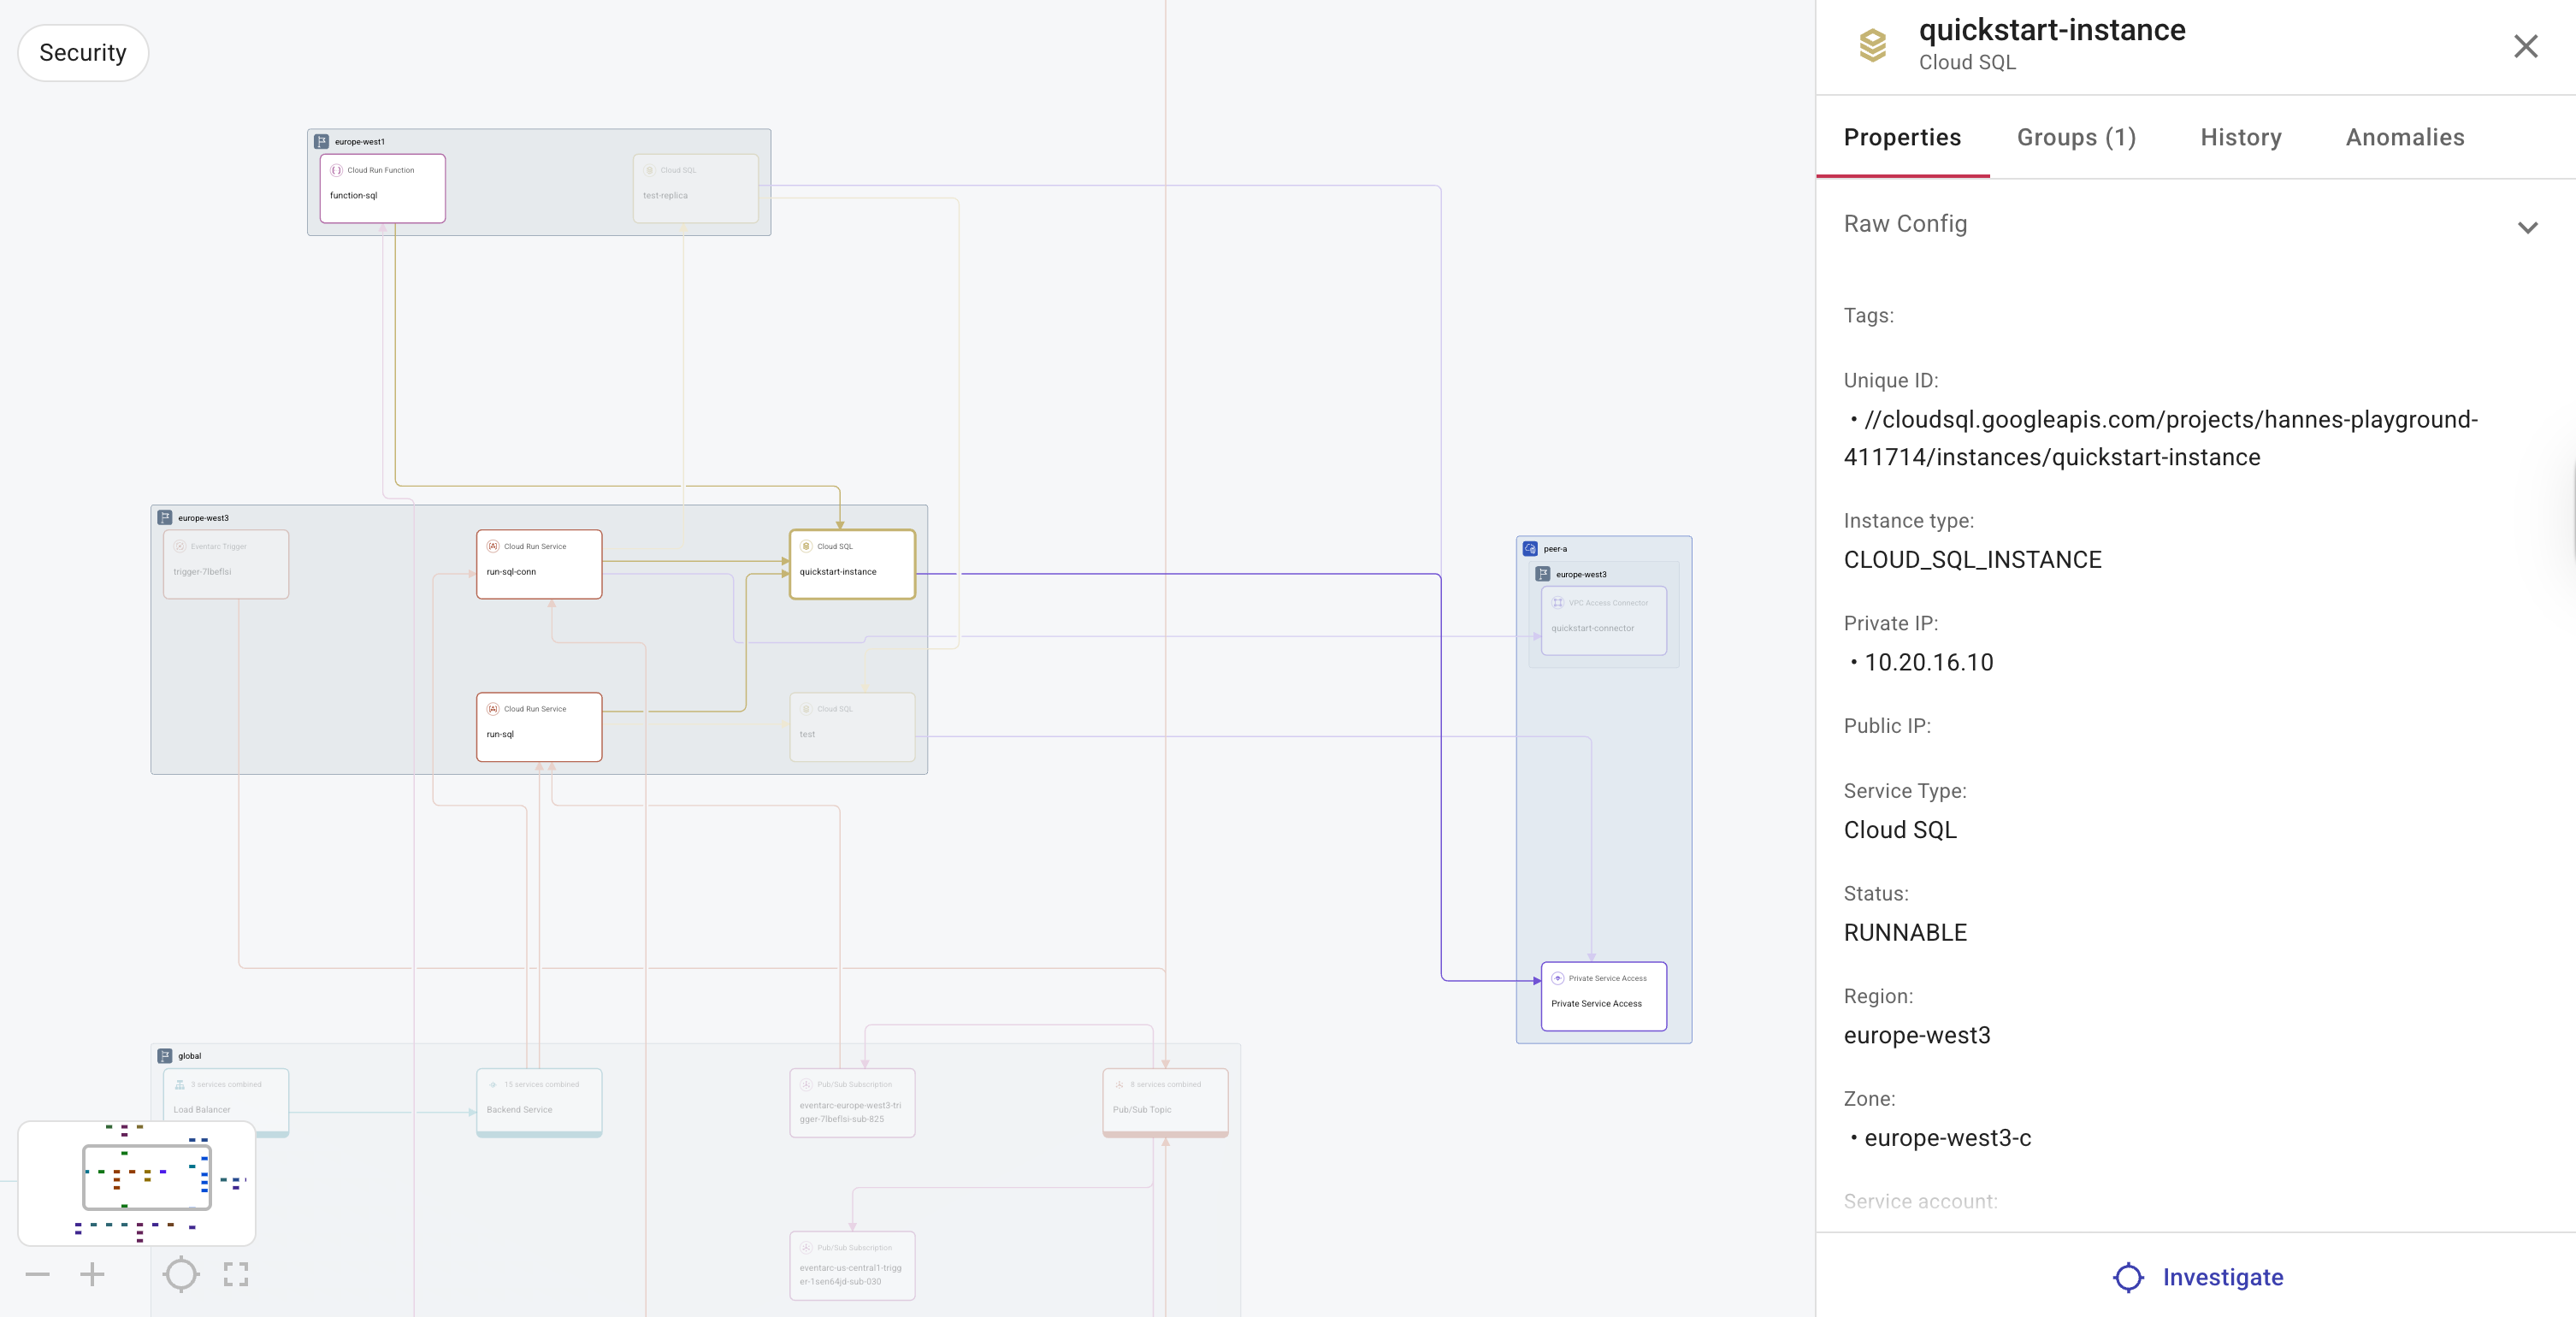
-
Select a Cloud Run service. The diagram allows us to see what is triggering the Cloud Run service and identify any issues with those resources.
Investigate your Cloud Diagrams
There are two ways to access the Investigate feature in a diagram.
-
In the sidebar, under Actions, select Investigate and search for the resource you want to investigate. For example, when investigating an alert that typically contains a resource name, ID, or IP address, search for the resource. Once selected, the diagram automatically isolates the resource and its dependencies, allowing you to quickly focus on the different components within the sub-diagram.
-
Select a resource in a diagram and choose Investigate. This is useful when reviewing and planning changes in a specific operational flow in your environment. You can select a resource in the diagram, such as a Route 53 hostname, a load balancer, or a compute resource. The diagram automatically displays the relevant subset that includes the resource and all its parents/children, enabling focused analysis.