AI Hub
AI Hub is a unified surface in the DoiT console for monitoring and managing your organization's AI cost, usage, and configuration across providers. It consolidates AI cost analytics and your AI provider connections into a single location.
AI Hub is available in early access and is not covered by the DoiT support SLA. To enable AI Hub for your organization, contact your DoiT account team.
To open AI Hub, select AI Hub in the console's main menu.
Get started
-
Ask your DoiT account team to enable AI Hub for your organization.
-
Connect your AI providers. Go to Manage > Connectors to see which AI providers are connected and to connect new ones. Connections you've already set up in the DoiT console are reused. AI spend that's billed through a connected cloud account, such as Amazon Bedrock or Google Cloud Vertex AI, appears without extra setup. See Supported GenAI providers.
-
Wait for the first import. The initial import of a new connection usually finishes within a few hours, and later updates arrive on each provider's schedule, typically within a day or two of the usage. How much history you see depends on the provider; for example, OpenAI and Anthropic import the last 6 months when you first connect them. See Data latency and each provider's connection page.
-
Explore your spend. Start on the Overview, then use the Providers, Models, and Identity pages for detail, and My usage for your own spend.
Overview
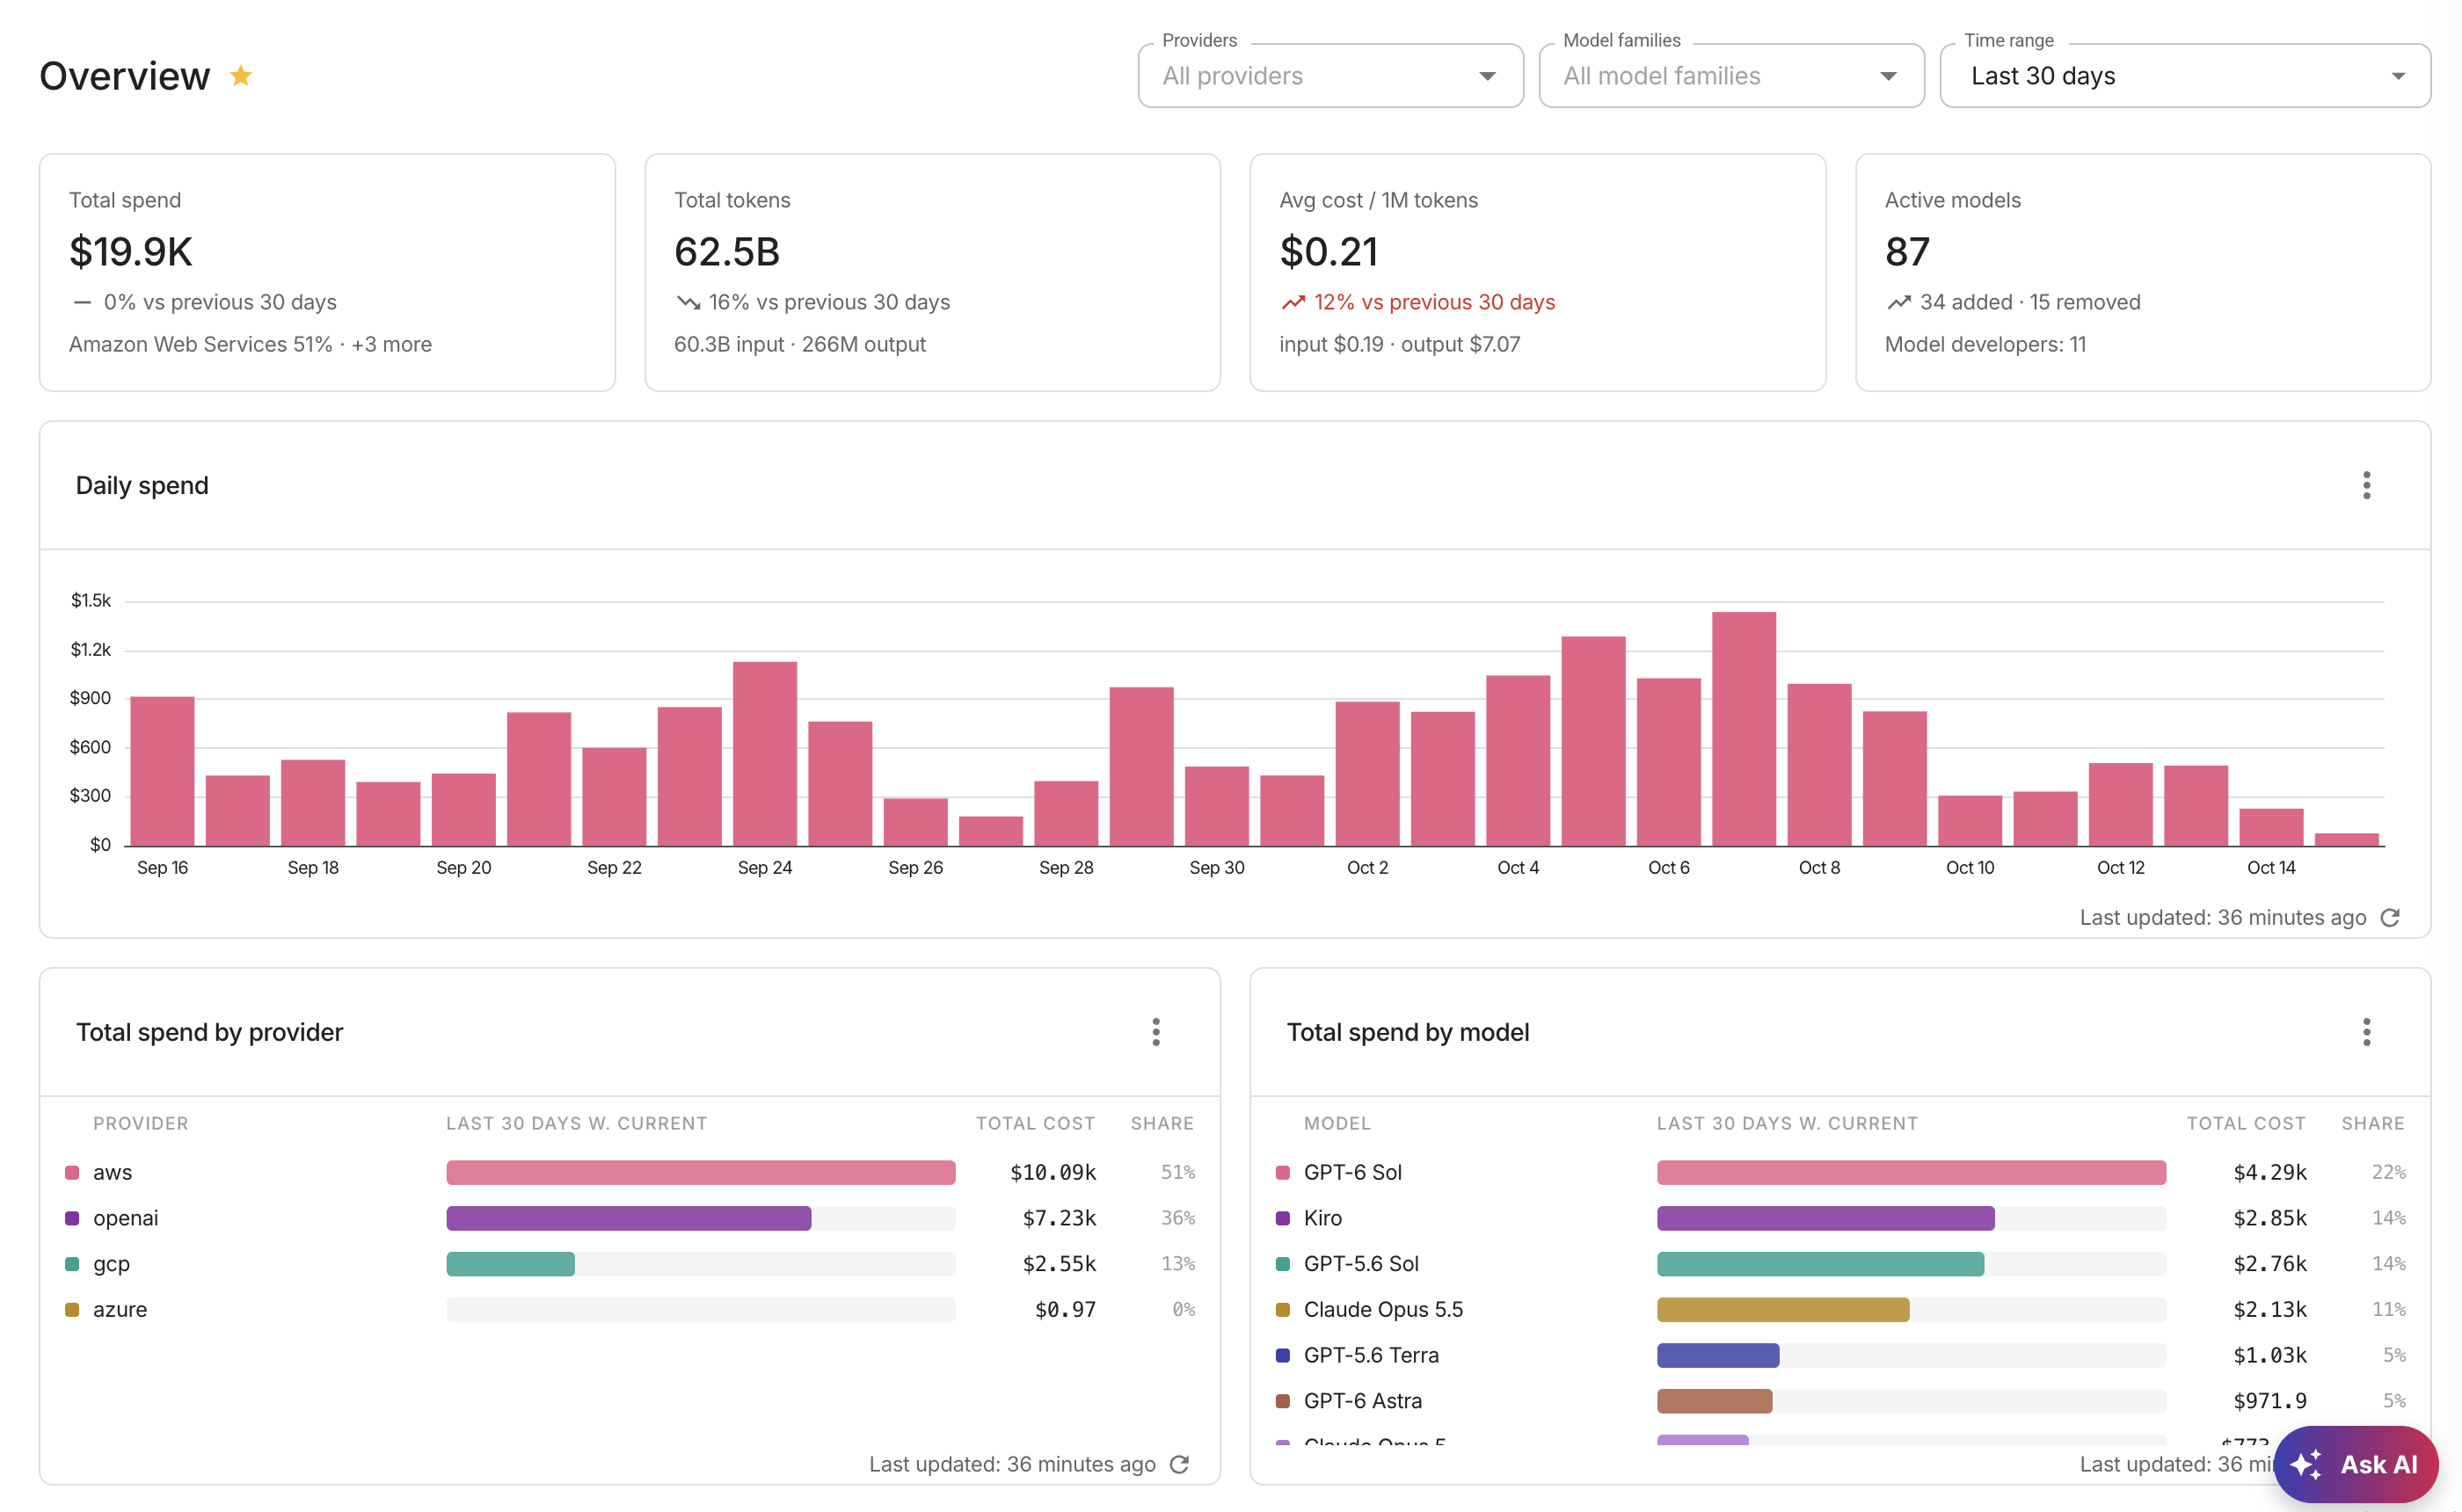
The AI Hub Overview page provides a high-level summary of your AI spend and usage. Four KPI tiles display live data from the Tokenomics API:
- Total spend: Your total AI spend for the selected period. Below the total, the card shows your top billing provider and its share, followed by a count of additional providers. The billing provider is the entity that billed the usage, so Claude usage through Amazon Bedrock counts toward Amazon Web Services rather than Anthropic. When there is no spend in the period, the card shows "No AI spend in this period."
- Total tokens: The total number of tokens consumed, split into input and output.
- Avg cost / 1M tokens: The average cost per million tokens, with input and output rates.
- Active models: The number of distinct models used, with counts of models added or removed compared to the previous period.
All spend amounts are shown in your account's billing currency, converted with the same monthly exchange rates as Cloud Analytics reports. The exception is My usage, which always shows US dollars.
Each tile includes a trend indicator that compares the current value against the equivalent previous period. Rising spend and rising average cost are flagged in red to highlight increasing costs. Token and active model trends use a neutral color.
If the KPI data cannot be loaded, the tiles display "—" with the message "Couldn't load this metric." If your account does not have access to AI cost data (for example, if your organization restricts Cloud Analytics access), the tiles instead show "Not available for your account."
In Demo or Presentation mode, the KPI tiles display placeholder numbers instead of live data.
An AI analysis overview card appears below the page header on the Overview, Provider, Identity, and Model pages. The card shows up to three AI-generated insights about your GenAI spend, each with a short title and a one-sentence explanation. A Generated caption indicates when the analysis was last produced. You can collapse or expand the card with the toggle icon.
The analysis always covers all providers and compares the last 30 days with the previous 30 days; page filters don't change it, so its figures can differ from the filtered cards around it.
The Tokenomics summary card provides a snapshot of your AI usage across three dimensions. Each row links to its corresponding detail page:
- Identity: The number of active users and spend per user.
- Provider: The number of providers with spend in the selected period, the top provider by spend, and that provider's percentage share.
- Model: The number of active models and the average cost per million tokens.
These figures respond to the dashboard's time range and provider/model filter selections. If the selected time range exceeds the maximum window, each row displays a message to pick a shorter range. While data is loading, the rows show a loading indicator; if the data cannot be loaded, they display "Couldn't load this metric." When no providers have spend in the selected period, the Provider row shows "No spend in this period." In Demo or Presentation mode, the card displays placeholder values instead of live data.
The Total spend by provider and Total spend by model tiles display live cost data from Tokenomics reports, giving you an up-to-date view of how your AI spend breaks down across providers and models.
The GenAI budget utilization tile shows your active budgets that track AI spend, along with each budget's current utilization. If no budgets track AI spend, the tile displays an empty state. Users with the Budgets Manager permission also see a Create a GenAI budget button that opens the budget creation page. The page filters don't apply to this tile; each budget keeps its own scope and period.
The Cost anomalies tile surfaces recent unusual spending activity detected across your GenAI cost data. If no cost anomalies have been detected, the tile displays an empty state message. The page filters don't apply to this tile.
To pin AI Hub to your Favorites menu for quick access, select the star icon next to the page title on the Overview page.
Sections
AI Hub is organized into sections, accessible from the left sidebar.
Tokenomics
Tokenomics provides cost and usage analytics at the provider, model, and identity level. Use these views to understand where your AI spend is going, which models drive costs, and which people and services consume the most resources.
- My usage: Your own AI spend and token usage. See My usage.
- Provider: Cost breakdown by AI provider. See Providers.
- Model: Cost and token usage by model. See Models.
- Identity: Spend attribution by person and service identity. See Identity.
- GenAI Intelligence dashboard: Preset report widgets for AI spend and usage.
- Work with AI data: Dimensions, metrics, and labels available for AI cost analysis.
Manage
- Connectors: View the status of your AI provider data connections and connect new providers. See Connectors.
Taskonomics, which attributes AI spend to tasks, teams, and repositories, is in preview: its pages and the Gateways page show demo data or an upgrade prompt, where you can select talk to us about Taskonomics to register interest.
Filter controls
Many AI Hub pages include filters that let you narrow data by provider, model, and time range. When you select multiple filter values, the filter control displays a summary (for example, "amazon-web-services +2") instead of listing every selection.
The Overview page uses the same shared filter bar as the Providers, Models, and Identity pages, with Providers, Model families, and Time range controls. Filter selections on the Overview carry across pages — for example, selecting a provider on the Overview also applies to the Providers and Models pages. The Providers filter lists billing providers (such as amazon-web-services) consistently across all AI Hub pages. After you change the filters, select Apply to update the page; select Clear to return to the defaults.
Breakdown charts on AI Hub pages show only the highest-spend entries and group the rest into Other, which always appears last. To see every value, open the full report from the card. A group with no reported value, such as an unknown model family, is labeled Unattributed.
What the filters change
| Follows the filters | Doesn't follow the filters |
|---|---|
| KPI cards on the Overview, Providers, Models, and Identity pages | AI analysis overview card: always all providers, last 30 days compared with the previous 30 days |
| Every report chart and table on those pages, including the Overview's Daily spend, Total spend by provider, and Total spend by model | GenAI budget utilization tile: each budget keeps its own scope and period |
| The Overview's Tokenomics summary card | Cost anomalies tile |
| My usage, which has its own Time range control and no provider or model filters |
Until you apply a time range, cards and charts use their default period, usually the last 30 days. After you apply one, every card and chart that follows the filters uses it, and trend comparisons use the period of the same length just before it.
The default time range is Last 30 days. Select the Time range control to choose a different period: a rolling period on the Last tab, the current period on the Current tab, or specific dates on the Fixed Dates tab. On the Overview page, if the selected time range spans more than 366 days, the KPI tiles display "Covers at most 366 days. Pick a shorter time range" instead of data.
See also
My usage
View your personal AI spend, token usage, and model distribution in the My usage dashboard.
Providers
Monitor your generative AI provider spend, model usage, and skill adoption on the AI Hub Providers page.
Models
Analyze GenAI spend and token usage by model and model family on the AI Hub Models page.
Identity
Analyze GenAI spend by identity on the AI Hub Identity page, including KPI cards, model breakdowns, spend movers, and per-identity cost details.
Import identities from a CSV file
Upload a CSV file that maps identities to teams to build your organization structure in AI Hub.
AI Hub connectors
View the status of your AI provider data connections and connect or manage providers from a single page.