Identity
The AI Hub Identity page gives you a per-identity view of your generative AI spend. It surfaces who — or what — is driving cost across your connected GenAI providers, how that spend is distributed across models and providers, and how it is changing over time.
An identity is any actor that generates GenAI usage. Identities are classified as one of two types:
- Person: A human user identified by email address.
- Service: A non-human actor such as an IAM principal, API key, or service account.
Access the Identity page
To open the Identity page, go to Tokenomics > Identity in the AI Hub sidebar.
The Identity page replaces the former Users and Identities pages. Bookmarks to /ai-hub/users or /ai-hub/identities automatically redirect to the Identity page.
Required permission
To access the Identity page, your DoiT account needs the Cloud Analytics User permission.
KPI cards
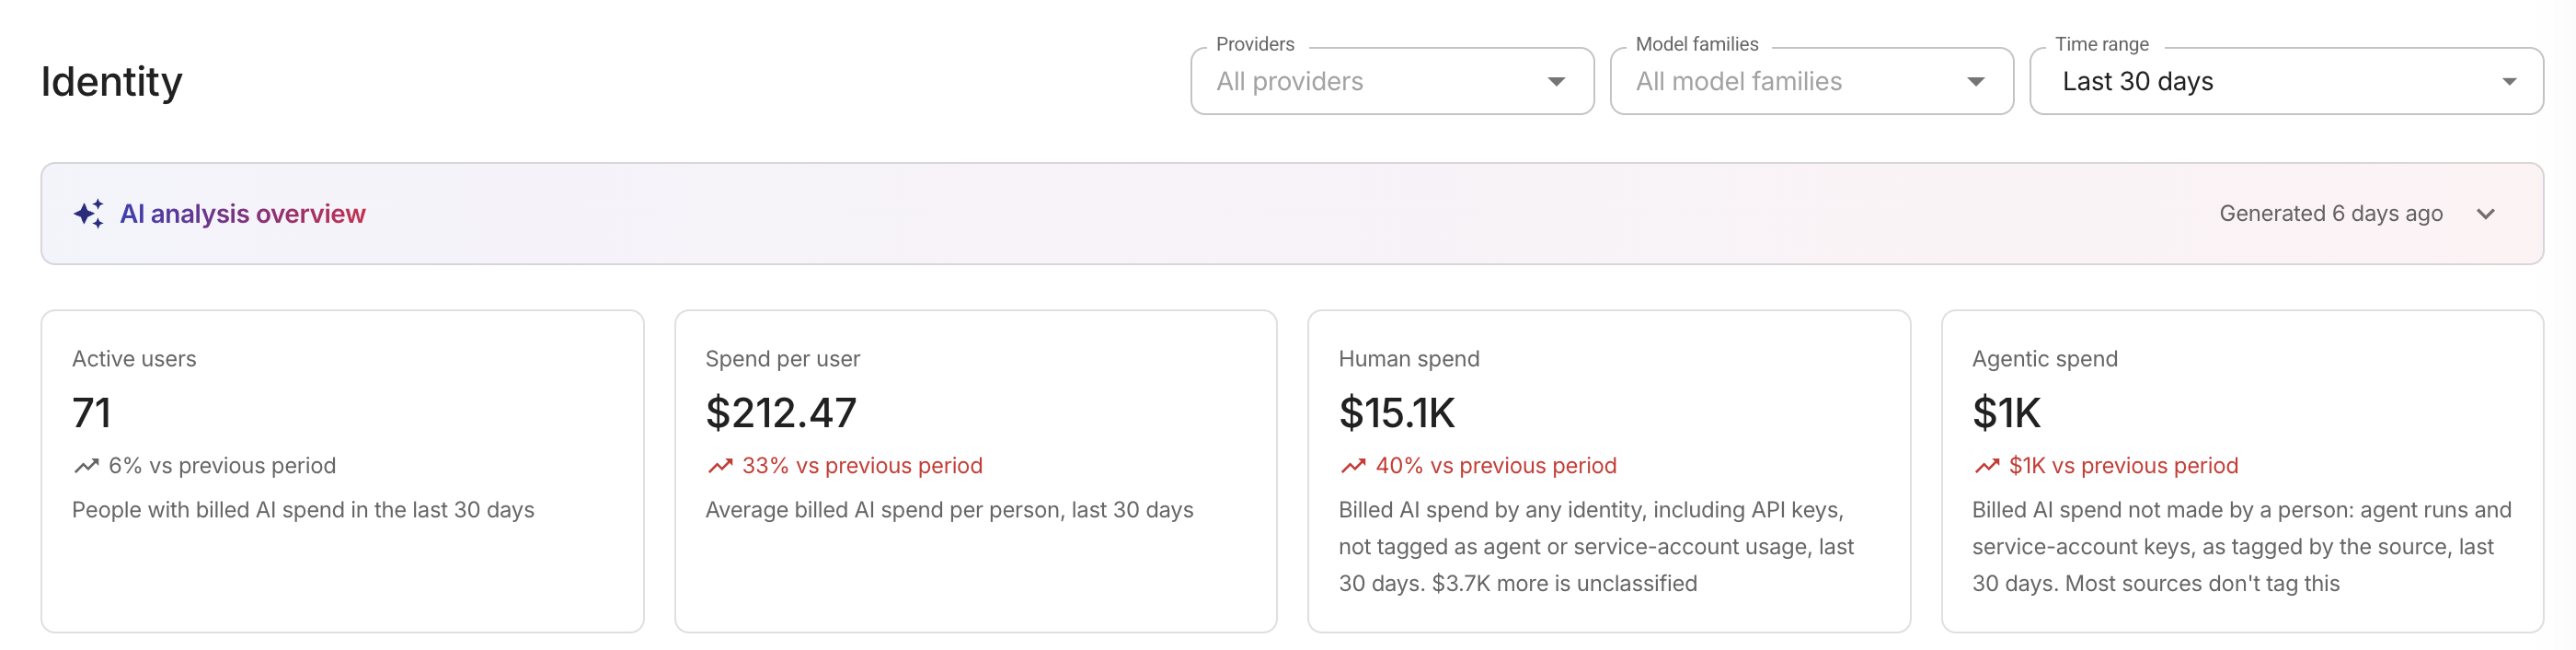
Four KPI cards at the top of the page summarize spend and user activity over the last 30 days, with a comparison to the prior 30-day period. When a time range filter is applied, the cards reflect the filtered period instead.
-
Active users: The number of distinct people with positive billed AI spend. AI Hub classifies an identity as a person when it has an email-shaped principal email, is an AWS Kiro seat, or is an OpenAI principal without an agent name. API keys, service accounts, and other non-human identities are excluded from this count. The card shows the number of excluded service identities separately.
-
Spend per user: The average billed AI spend per person. This divides only the human spend attributed to people by the number of active users. Human-classified spend from service identities or from usage without any identity contributes to the Human spend total but not to this per-user average.
-
Human spend: Billed AI spend by any identity — including API keys — not tagged as agent or service-account usage. Because most providers do not classify invocations, spend from API keys and other sources without a classification tag counts as human. When there is unclassified spend (usage with no identity and no invocation tag, or with a non-standard invocation value), the card displays the unclassified amount.
-
Agentic spend: Billed AI spend not made by a person, as tagged by the source. This includes agent runs from Cursor and Anthropic Analytics, and OpenAI keys owned by a service account. Most sources do not tag invocations, so this card may show zero for customers without those integrations.
Together, human spend, agentic spend, and unclassified spend sum to your total AI spend.
Most providers don't report whether a request came from a person or an agent. Untagged usage, including API keys used by scripts, CI pipelines, or applications, counts as Human spend. A low or zero Agentic spend can mean your providers don't report agent usage, not that no agents ran. Don't use these cards alone to judge how your organization adopts AI agents.
For example, suppose your organization's AI spend for the month is $1,000:
| Usage | Amount | Counted as |
|---|---|---|
| Cursor requests that Cursor tags as made by people | $500 | Human spend |
| Cursor agent runs that Cursor tags as agent usage | $200 | Agentic spend |
| An OpenAI API key used by a nightly batch job, with no tag | $250 | Human spend, although no person made the requests |
| Amazon Bedrock usage with no identity and no tag | $50 | Unclassified, noted on the Human spend card |
Human spend shows $750 and notes that $50 more is unclassified, and Agentic spend shows $200. Spend per user divides only the $500 attributed to people by Active users, because the API key isn't a person.
Top identities by model
A horizontal stacked bar chart shows the top eight identities ranked by total cost, with each bar segmented by AI model. Hover over a segment to see the model name and cost. A color legend below the chart maps each model to its bar color.
Top 5 spend increases and decreases
Two side-by-side cards highlight the five identities whose spend changed the most compared to the previous period:
- Top 5 spend increases: Identities with the largest cost increase, shown in absolute and percentage terms.
- Top 5 spend decreases: Identities with the largest cost decrease.
By default, the comparison window is the last 30 days versus the preceding 30 days. When a custom time range is active, the comparison uses the selected period versus the equivalent previous period.
Human vs. automated spend over time
This section breaks down GenAI spend by invocation type — human (interactive usage) versus agent (automated or programmatic usage). A toggle in the upper-right corner switches between two views:
- Spend: A stacked column chart showing daily cost over the last 30 days.
- Share: A pie chart showing the share of total cost for each invocation type.
Report widgets
Every card, chart, and table on this page follows the Providers, Model families, and Time range filters. See What the filters change.
Below the invocation breakdown, the Identity page includes several preset Cloud Analytics report widgets. Each widget highlights a different dimension of identity-level spend:
- Cost by user email: GenAI cost grouped by user email address.
- Cost by API key: GenAI cost grouped by API key name for the last 14 days.
- Cost by IAM user: GenAI cost grouped by AWS IAM principal name. This widget displays data from AWS only, because the
iamPrincipal/Namelabel is specific to AWS Cost and Usage Reports (CUR 2.0). IAM principals without a name label are excluded. - Cost per agent: GenAI cost grouped by agent name across all supported providers. Use it to identify which AI agents, such as coding assistants or automation tools, drive the most spend. Agents without a name label are excluded.
- GenAI spend – Top 15 users by provider and model: A Sankey-style breakdown of the top 15 users by provider and model.
You can select Open full report on any widget to view or customize its report configuration.
Widgets appear only when meaningful data is available. A widget is hidden when its report has no data or when a breakdown dimension contains only a single item. See Widget visibility for details.
Team breakdown
The Team breakdown card associates identities with teams. Upload a CSV file that maps each identity to a team, and the card summarizes your organization structure. See Import identities from a CSV file.
Identity cost table
At the bottom of the page, a table lists every identity with GenAI spend. By default the table is sorted by total cost (descending) and shows up to 500 identities.
| Column | Description |
|---|---|
| Identity | The identity name (email address or ARN). |
| Type | Whether the identity is a Person or Service. |
| Total cost | The identity's total GenAI cost for the selected period, with a trend indicator showing the change versus the previous period. |
| Share of spend | The identity's cost as a percentage of total organization GenAI spend. |
| Top provider | The provider where the identity spent the most. |
| Top model | The model the identity spent the most on. |
Use the filter bar above the table to narrow results by identity name, type, top provider, or top model. Select a column header to change the sort order.
View an identity breakdown
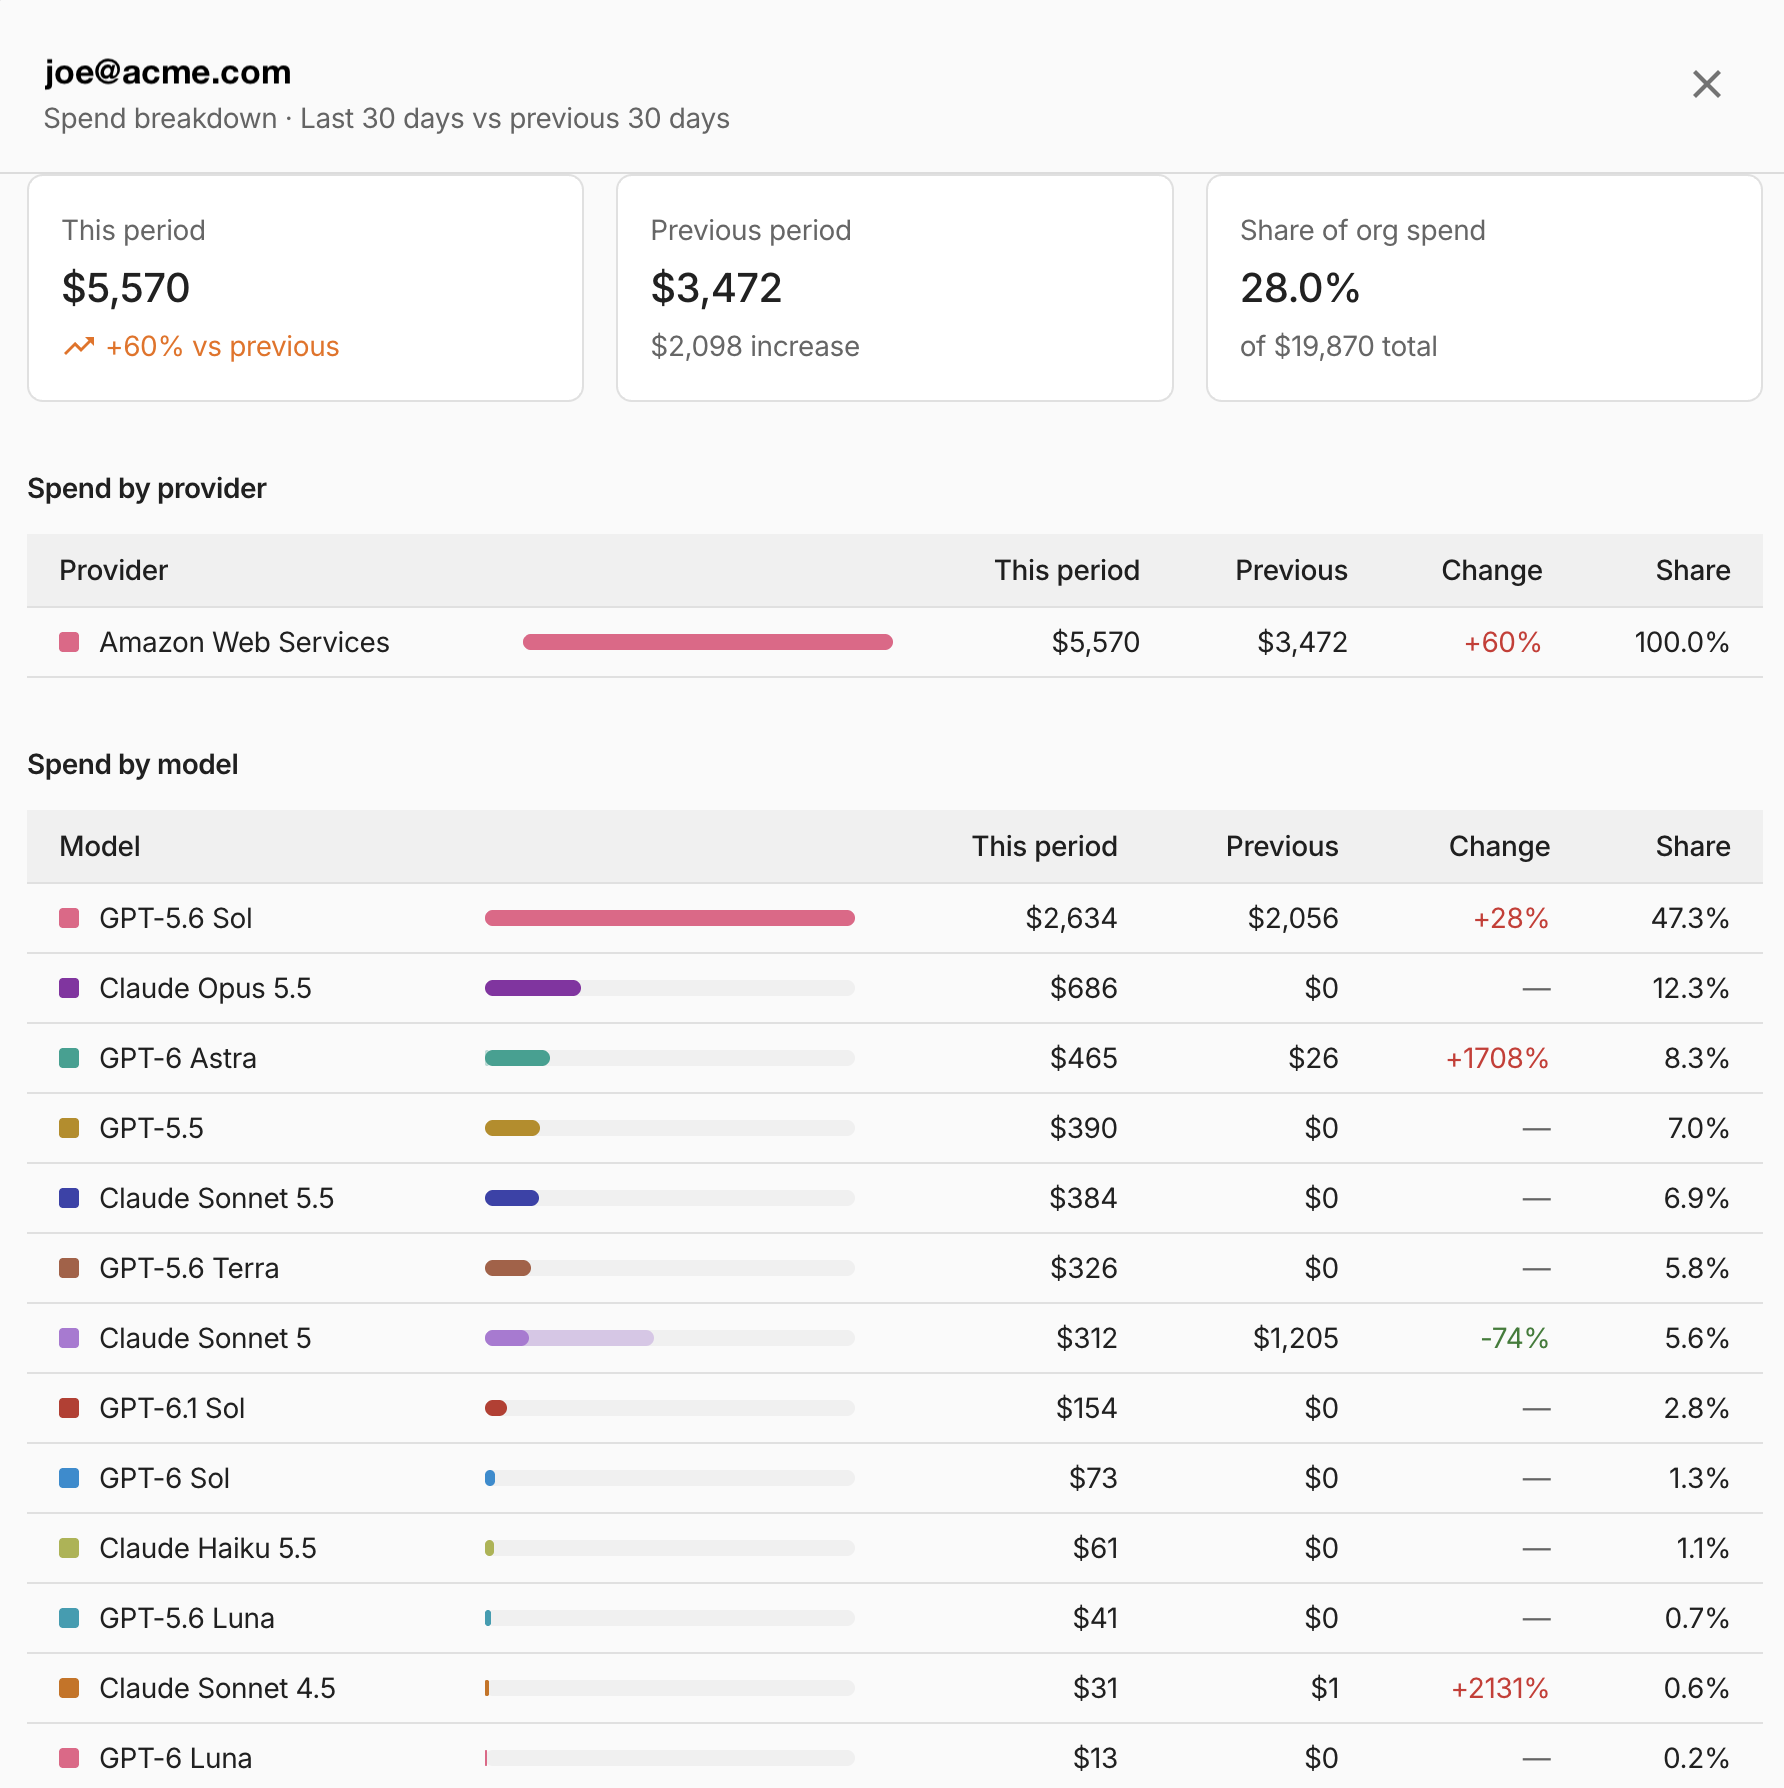
To see detailed spend information for a single identity, select the identity name or select View breakdown in the table row. A dialog opens with:
- This period and Previous period cost cards showing the absolute cost and the percentage change.
- Share of org spend indicating the identity's share of total organization GenAI cost.
- Spend by provider table listing each provider's current and previous cost, change percentage, and share of the identity's total.
- Spend by model table listing each model's current and previous cost, change percentage, and share of the identity's total.
See also
- Import identities from a CSV file: Map identities to teams for the Team breakdown card.
- GenAI Intelligence: Overview of GenAI Intelligence and supported providers.
- Work with AI data: Dimensions, metrics, and labels available for GenAI reporting.