Executive pulse
Executive pulse ダッシュボードは、クラウドプロバイダ間のクラウド支出を一目で確認できるビューを提供します。
必要な権限
Executive pulse ダッシュボードにアクセスするには、お使いの DoiT アカウントに Cloud Analytics User 権限が必要です。
ダッシュボードのアクセス制御
Executive pulse ダッシュボードへのアクセス
Executive pulse ダッシュボードにアクセスするには、上部ナビゲーションのメガメニューから Dashboard を選択し、Executive pulse を選択してください。
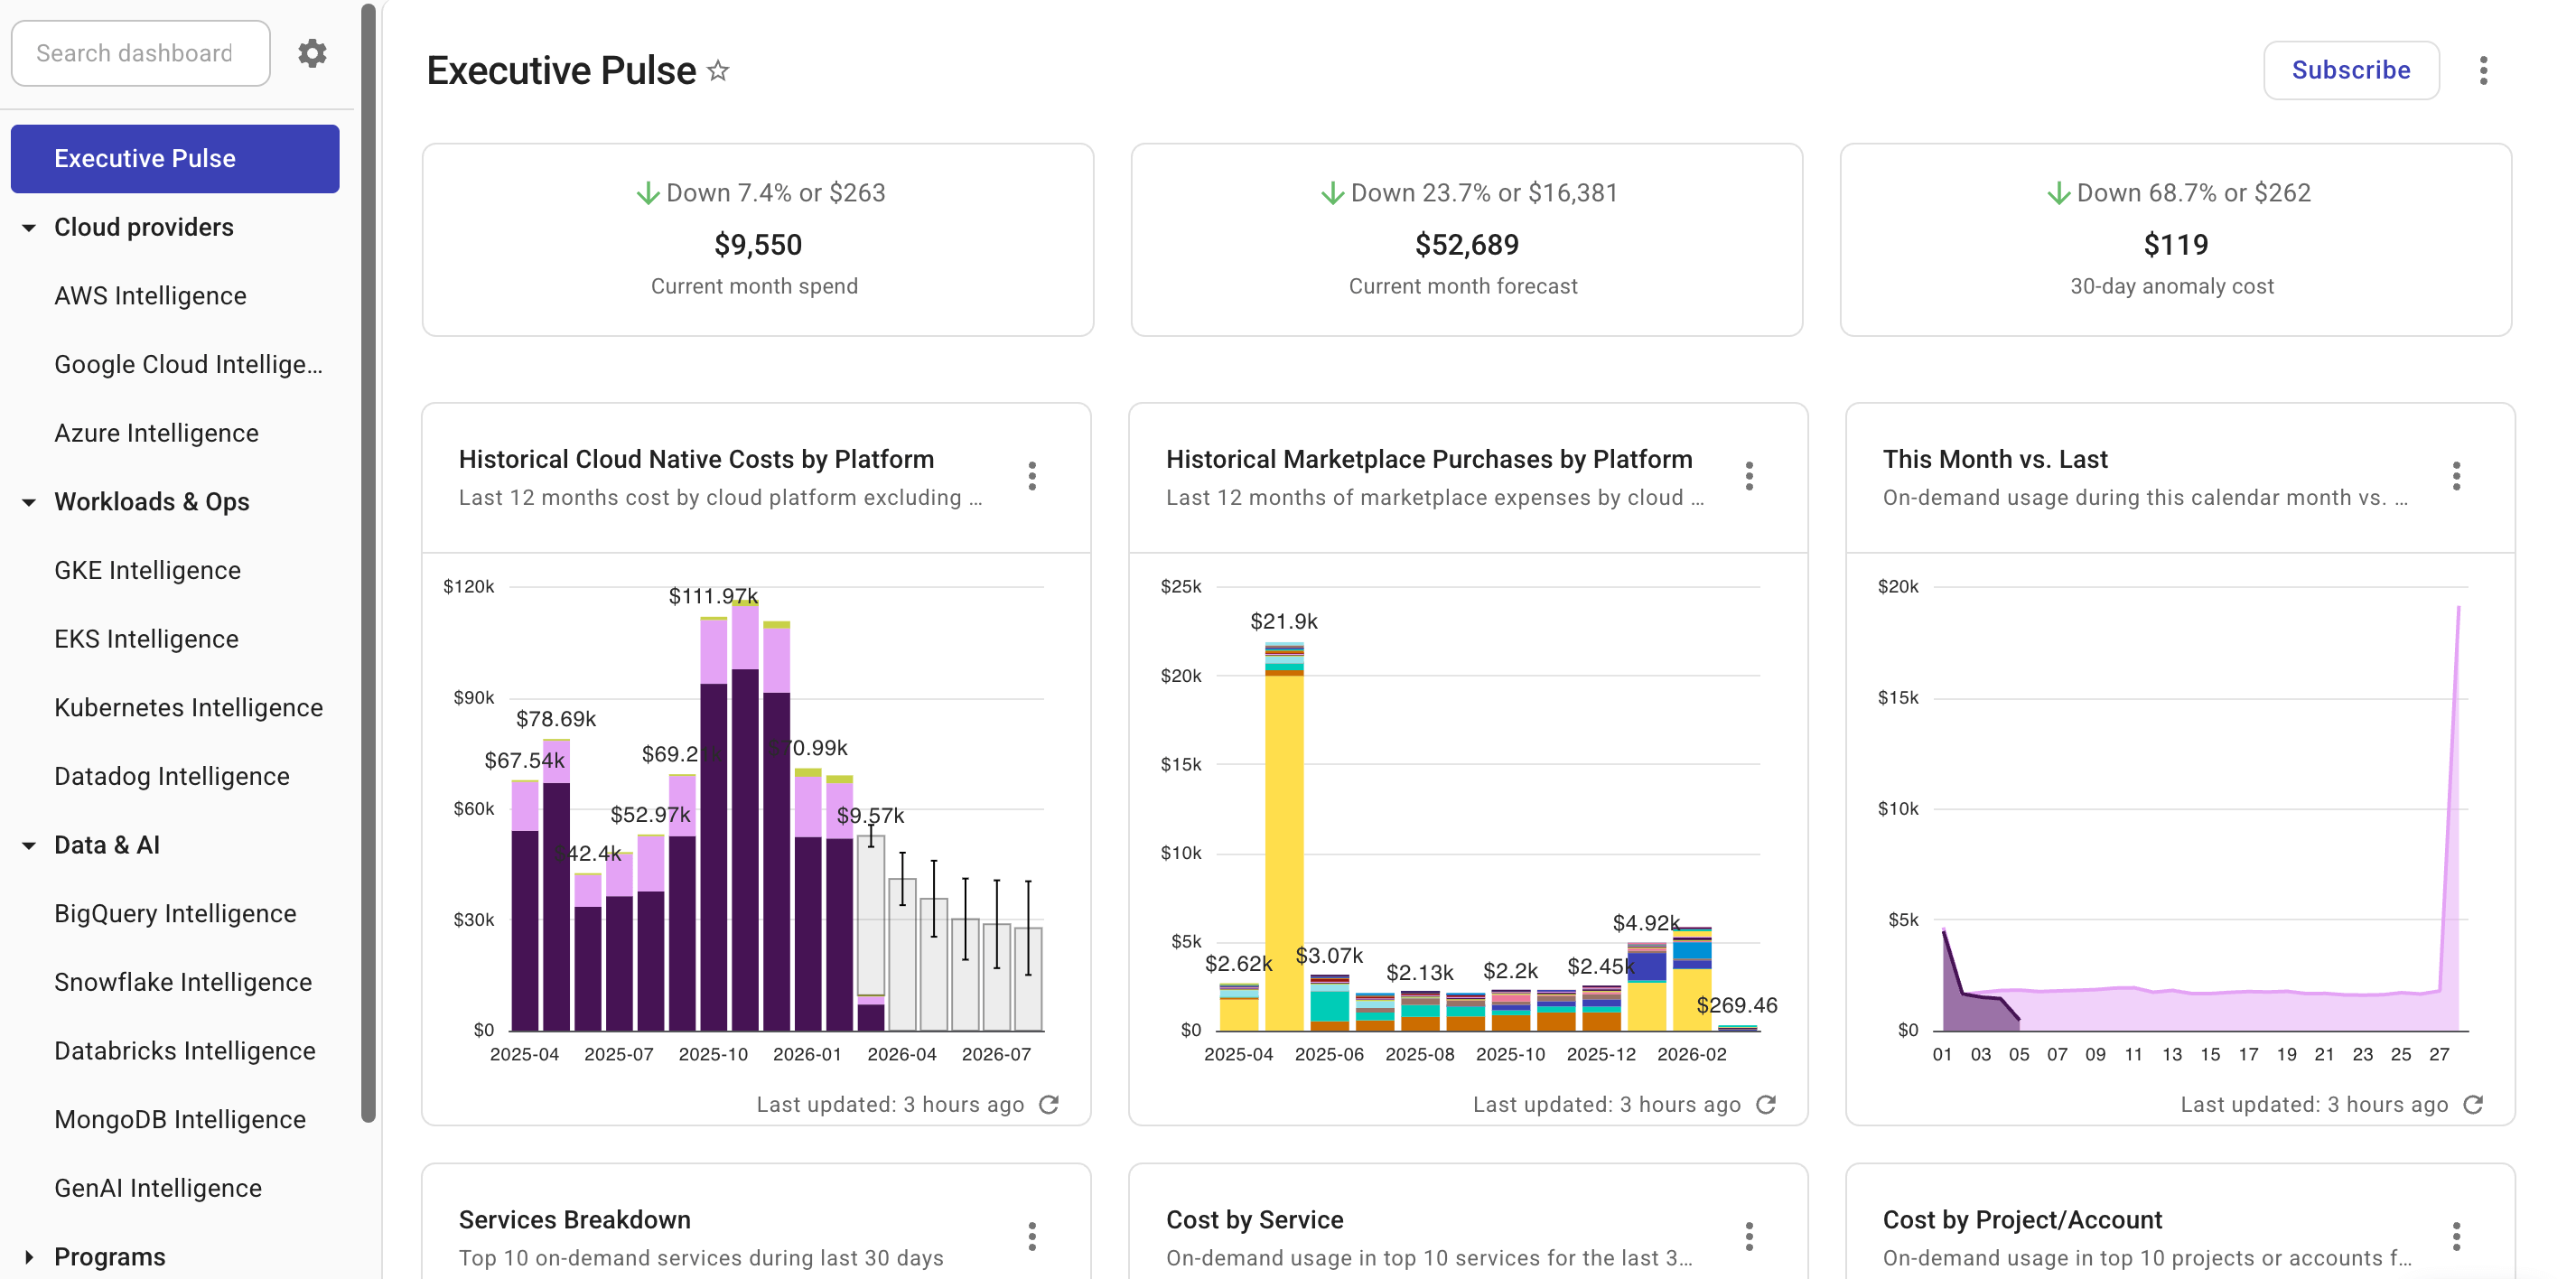
ダッシュボードは、3 つのサマリーカードと、複数のプリセットレポートウィジェットの 2 部構成になっています。
サマリーカード
3 つのサマリーカードでは、コストの「金額」と「トレンド」を含む、クラウド支出パターンの概要を表示します。
| Item | Current month spend | Current month forecast | 30-day anomaly cost |
|---|---|---|---|
| Cost amount | 当月の暦月における総コスト | 当月の暦月末までのクラウド支出に関する ML 予測 | 過去 30 日間に発生したアノマリー(重大度レベルが Warning 以上)によって発生したコスト |
| Trend | 当月の支出が、前月の同期間と比較してどう推移しているか | 当月の予測値が、前月の実コストと比較してどう推移しているか | 過去 30 日間のアノマリーによるコストが、その直前の同期間と比較してどう推移しているか |
通常、サマリーカードは 12 時間ごとに更新されます。
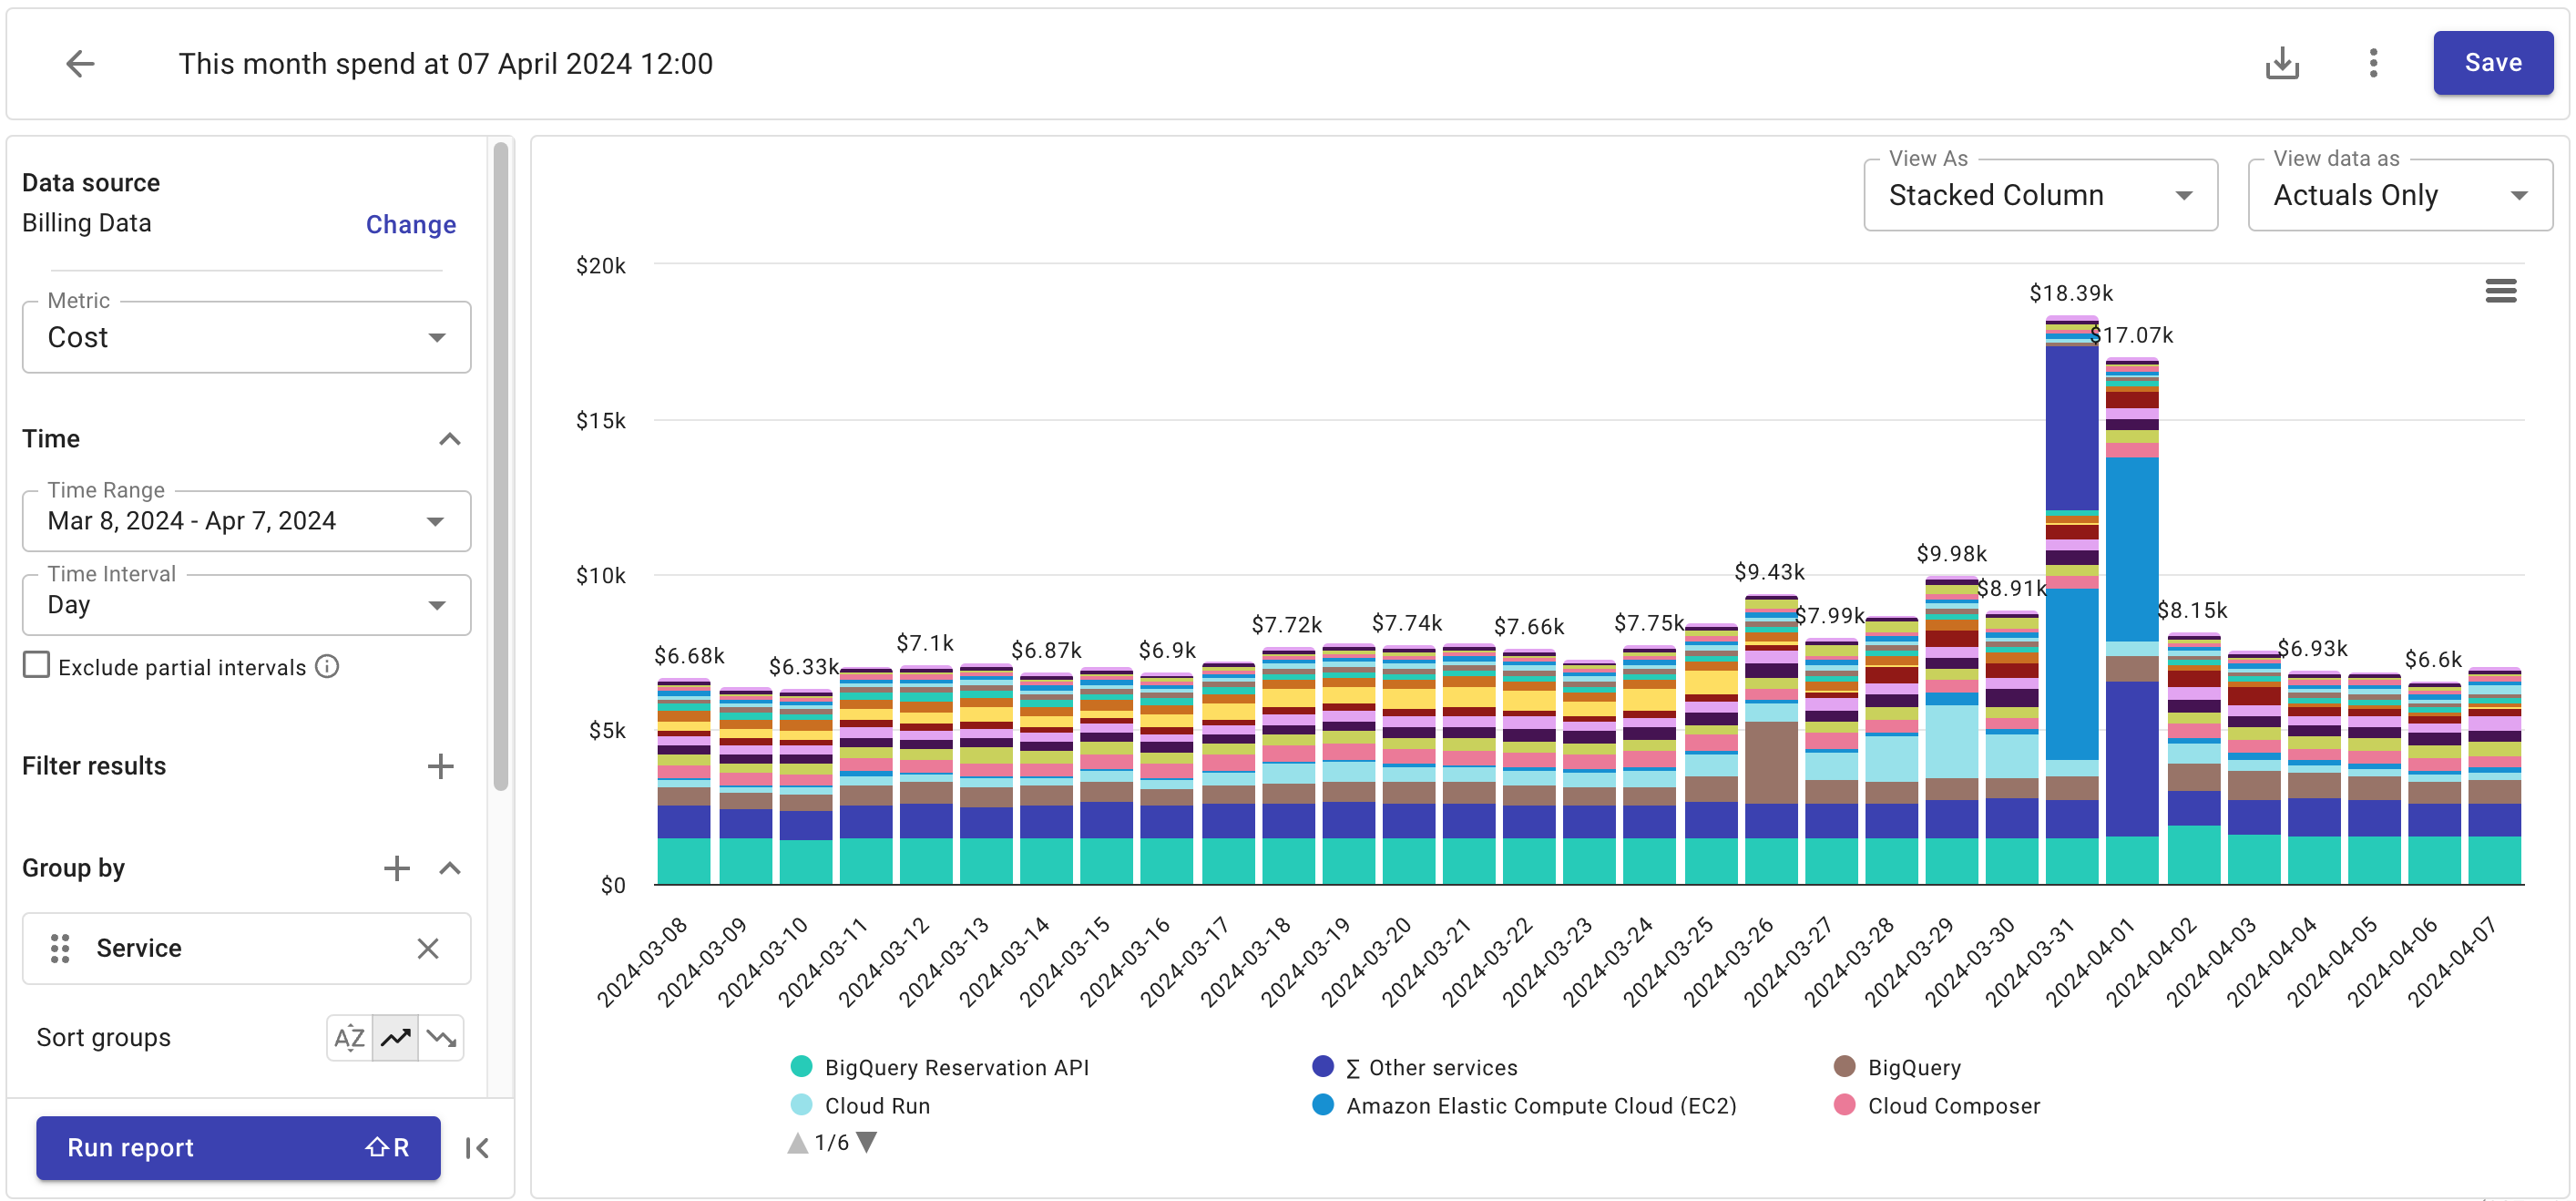
サマリーカード上のコスト金額をクリックすると、詳細情報を確認できます。たとえば、Current month spend のコスト金額をクリックすると、過去 30 日間のコストを表示するレポートが開きます。30-day anomaly cost の金額をクリックすると、Cost anomalies ページが開きます。
プリセットレポートウィジェット
ダッシュボード上のプリセットレポートウィジェットは、さまざまなディメンションを利用して、クラウド支出のさまざまな側面を強調表示します。
ダッシュボード上の各ウィジェットは、互いに独立して更新されます。詳細は、Refresh report data を参照してください。
Open full report でレポートの設定を確認したり、プリセットレポートをカスタマイズして独自のレポートを作成したりできます。
Historical Cloud Native Costs by Platform
Historical Cloud Native Costs by Platform ウィジェットは、マーケットプレイスでの支出およびプロモーションクレジットを除外し、過去 12 か月間のクラウドプラットフォーム別のコストを集計して表示します。
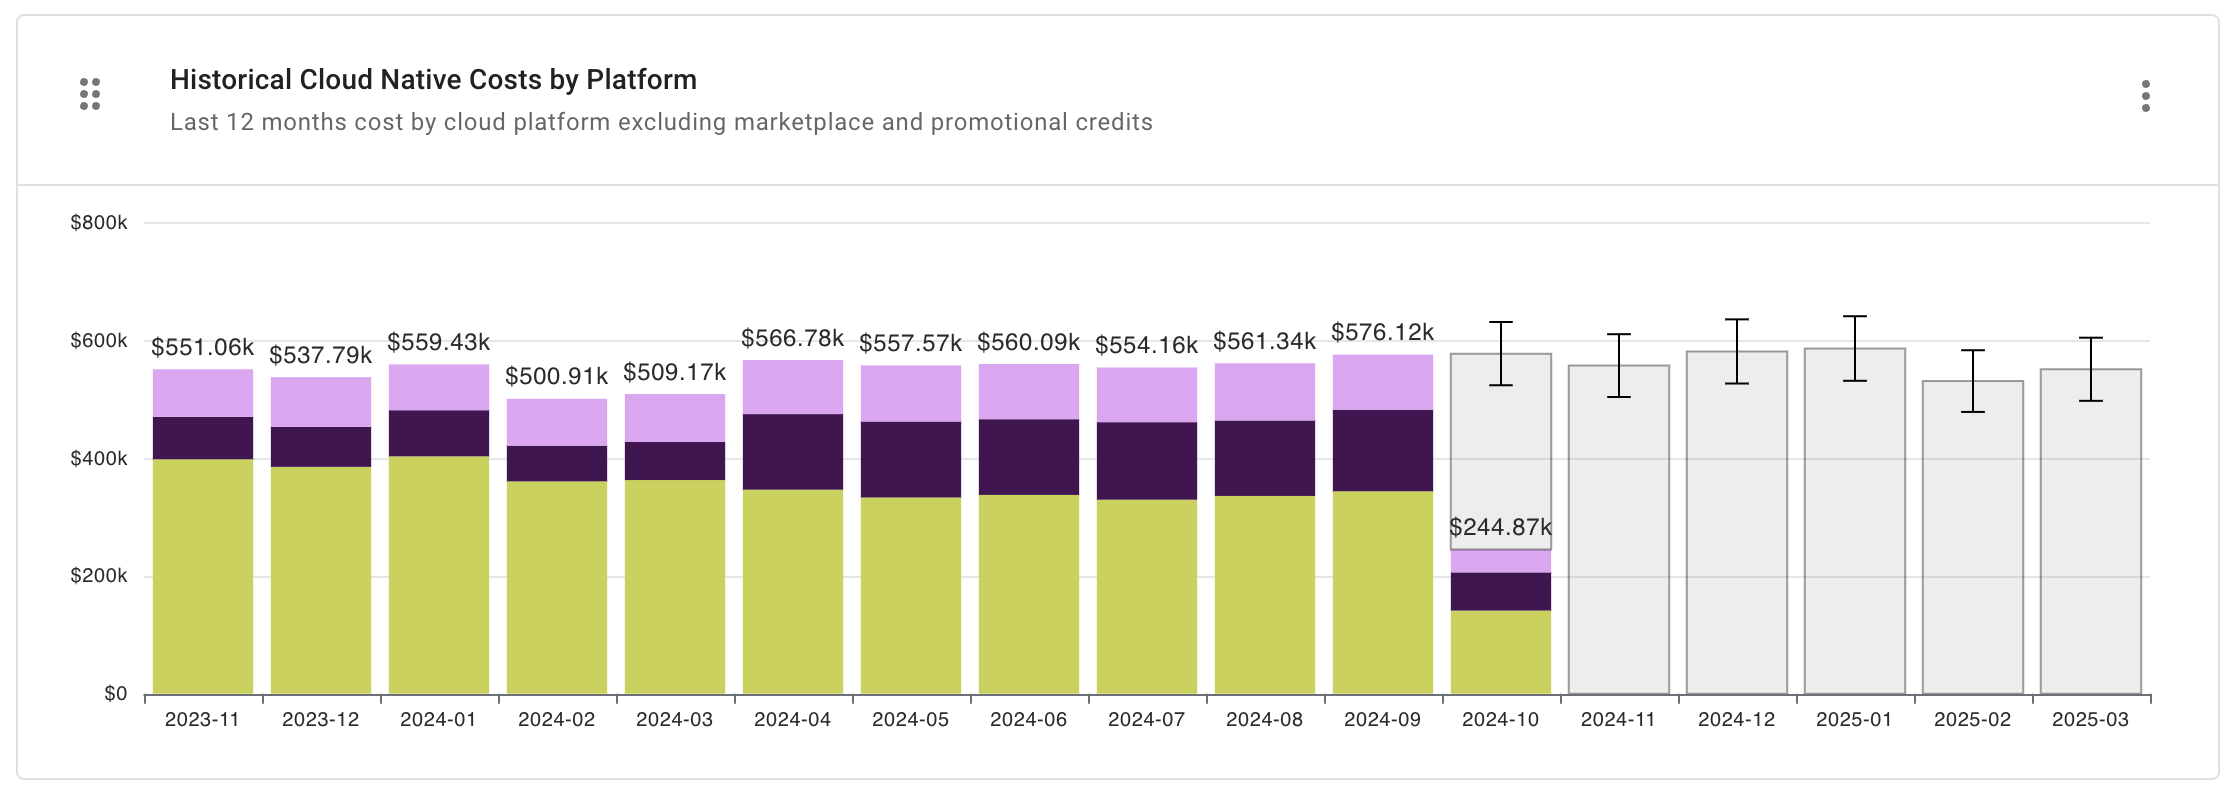
レポート設定:
- Metric: Cost
- Time Range: Last 12 months (include current month)
- Time Interval: Month
- Filter results:
- Cost Type is not
CreditorCredit Adjustment - Credit not matches regexp
(?i)\s*GFS\s* - Marketplace equals
false
- Cost Type is not
- Group by: Provider
- Limit results:
- Limit by value: Cost not between -US$0.10 AND US$0.10
- Advanced Options:
- Advanced Analysis: Forecast
Historical Marketplace Purchases by Platform
Historical Marketplace Purchases by Platform ウィジェットは、過去 12 か月間のマーケットプレイスでの支出を表示します。
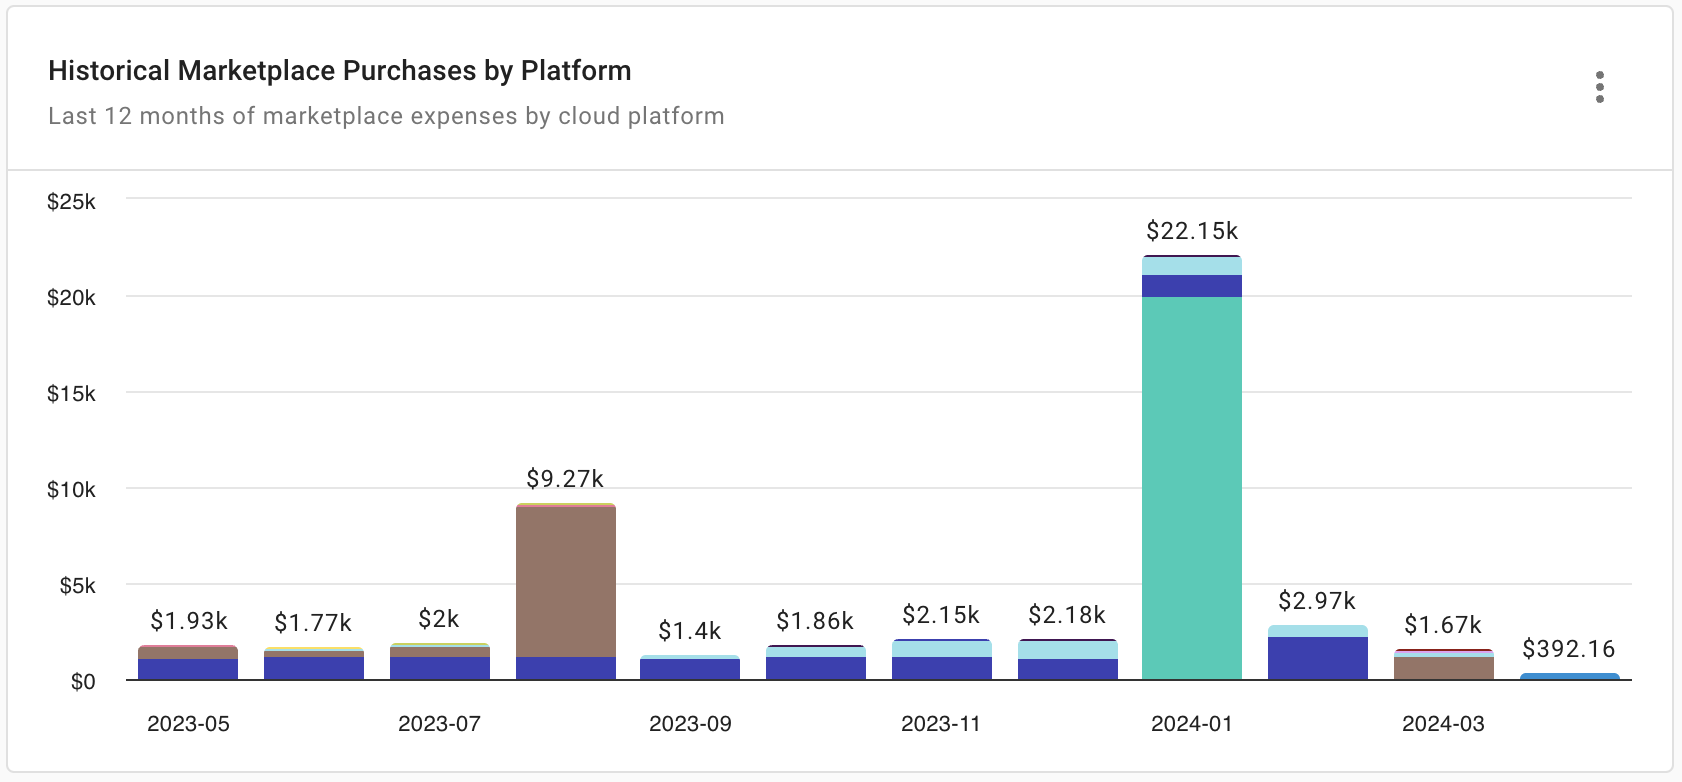
レポート設定:
- Metric: Cost
- Time Range: Last 12 months (include current month)
- Time Interval: Month
- Filter results:
- Cost Type is not
CreditorCredit Adjustment - Credit not matches regexp
^GFS Cloud - Marketplace equals
true
- Cost Type is not
- Group by: Provider, Service
- Limit results:
- Limit by value: Cost not between -US$0.10 AND US$0.10
- Limit by top/bottom: Service—Limit to top 10 by cost
Cost by Service
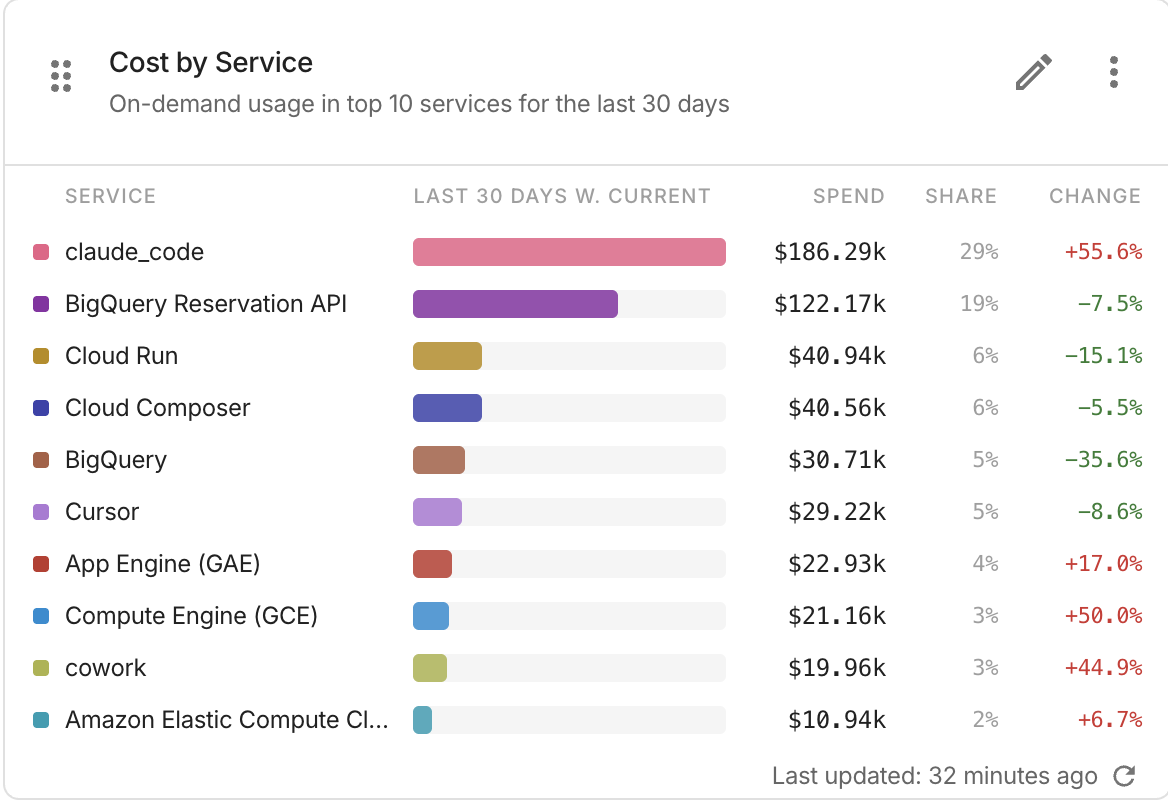
Cost by Service ウィジェットは、過去 30 日間におけるコストの上位 10 サービスを、ranked bars 形式で表示します。各行には、そのサービスの支出額、全体に占める割合、直前の 30 日間との比較が表示されるため、特定サービスの利用パターンをすばやく把握し、調査が必要な異常なコストに気づくことができます。上位 10 サービス以外は、Other services 行として集約されます。
レポート設定:
- Metric: Cost
- Time Range: Last 30 days (include current day)
- Secondary time range: Prior 30 days
- Exclude partial intervals: Yes
- Filter results:
- Allocation rule is not
AWS RIs, SPsorAWS Support - Cost Type is not
CreditorCredit Adjustment
- Allocation rule is not
- Group by: Service
- Limit results:
- Limit by value: Cost not between -US$1.00 AND US$1.00
- Limit by top/bottom: Service—Limit to top 10 by cost
- View as: Ranked bars
Trending Services
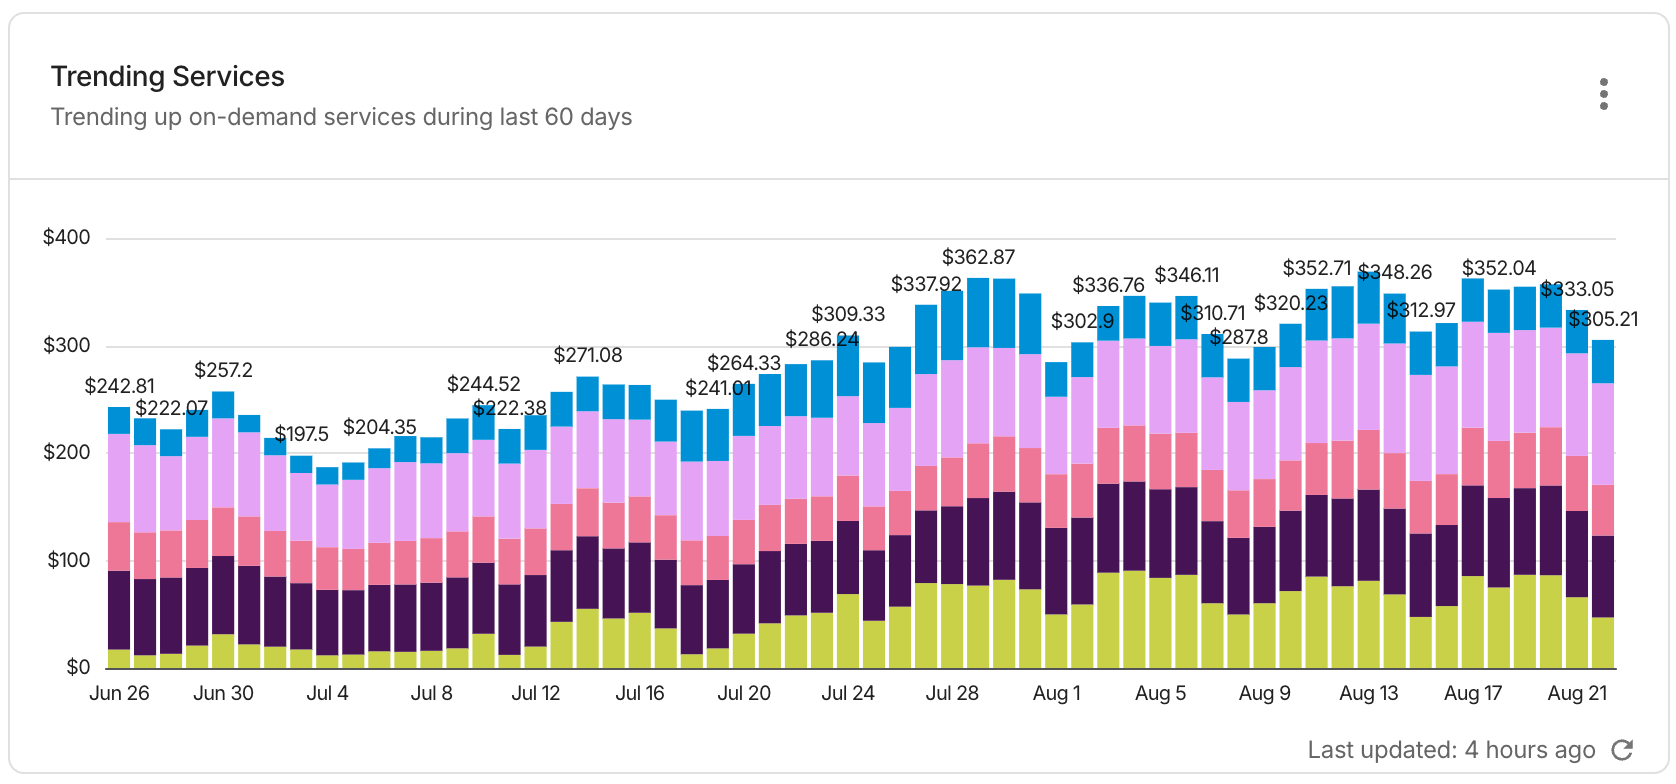
Trending Services ウィジェットは、当社の ML アルゴリズムによって過去 60 日間で「トレンド上昇中(trending up)」と判定されたサービスを表示します。これにより、将来的に制御不能になりそうなサービスや、特に注意を払うべき特定の SKU をすばやく特定できます。
レポート設定:
- Metric: Cost
- Time Range: Last 60 days (include current day)
- Time Interval: Day
- Exclude partial intervals: Yes
- Filter results:
- Allocation rule is not
AWS RIs, SPsorAWS Support - Cost Type is not
CreditorCredit Adjustment
- Allocation rule is not
- Group by: SKU, Service
- Limit results:
- Limit by value: Cost > $10.00
- Limit by top/bottom: SKU—Limit to top 25 by cost
- Advanced Options:
- Advanced Analysis: Trending Up
Services Breakdown
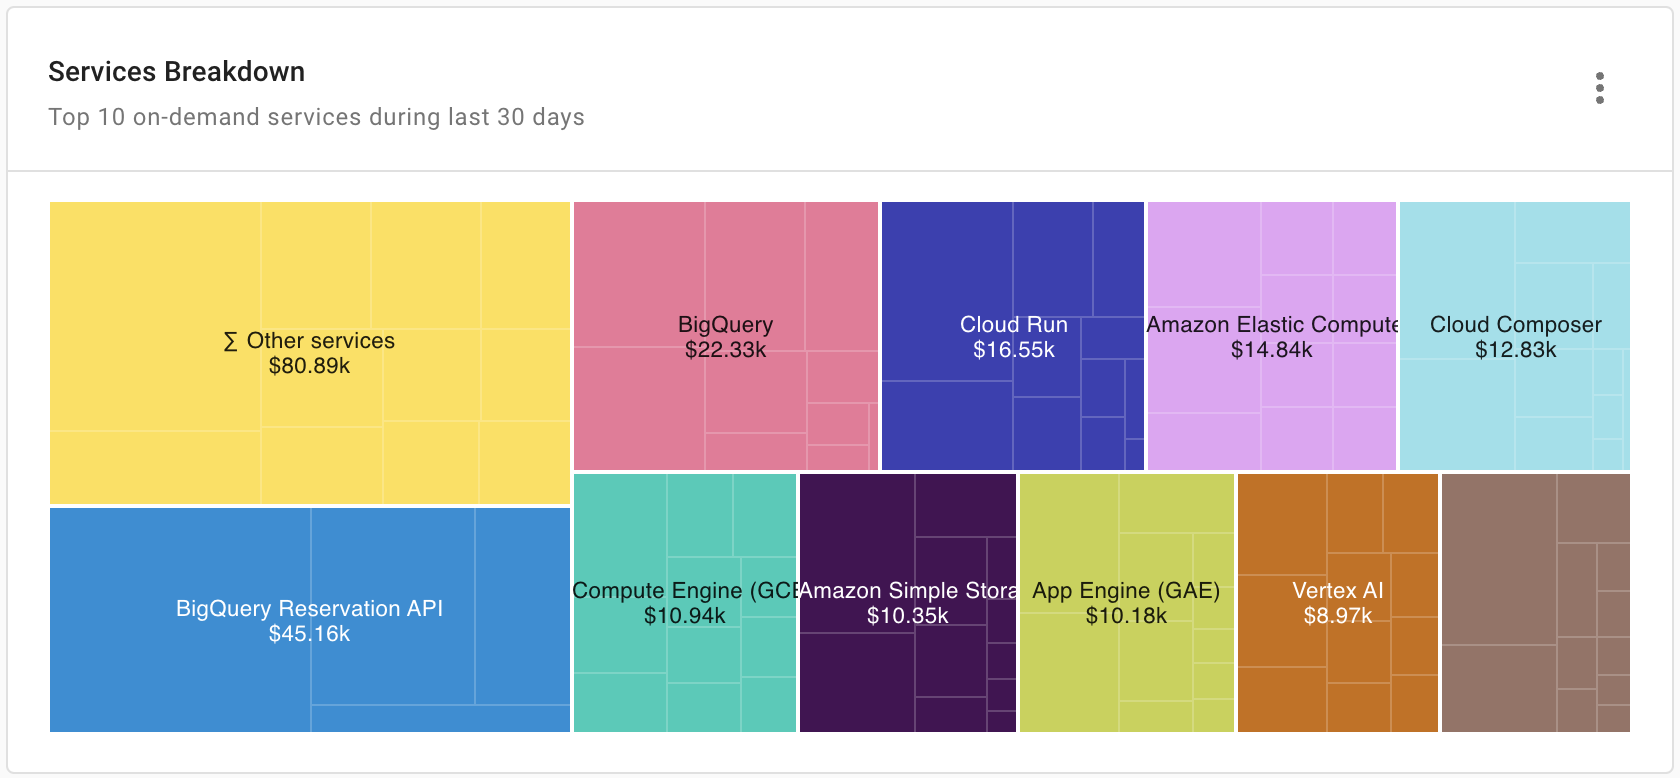
Services Breakdown ウィジェットは、過去 30 日間におけるコストの上位 10 サービスを表示します。また、各サービスについて、コストの上位 10 SKU までドリルダウンすることができます。このウィジェットを使用して、レポートに示されるインフラストラクチャ負荷に基づき、改善の機会を特定できます。
レポート設定:
- Metric: Cost
- Time Range: Last 30 days (include current day)
- Time Interval: Day
- Filter results:
- Cost Type is not
CreditorCredit Adjustment - Credit not matches regexp
^GFS Cloud
- Cost Type is not
- Group by: Service, SKU
- Limit results:
- Limit by value: Cost not between -US$1.00 AND US$1.00
- Limit by top/bottom: Service—Limit to top 10 by cost; SKU—Limit to top 10 by cost
This Month vs. Last
This Month vs. Last ウィジェットは、当月と前月の日次コストを比較表示します。
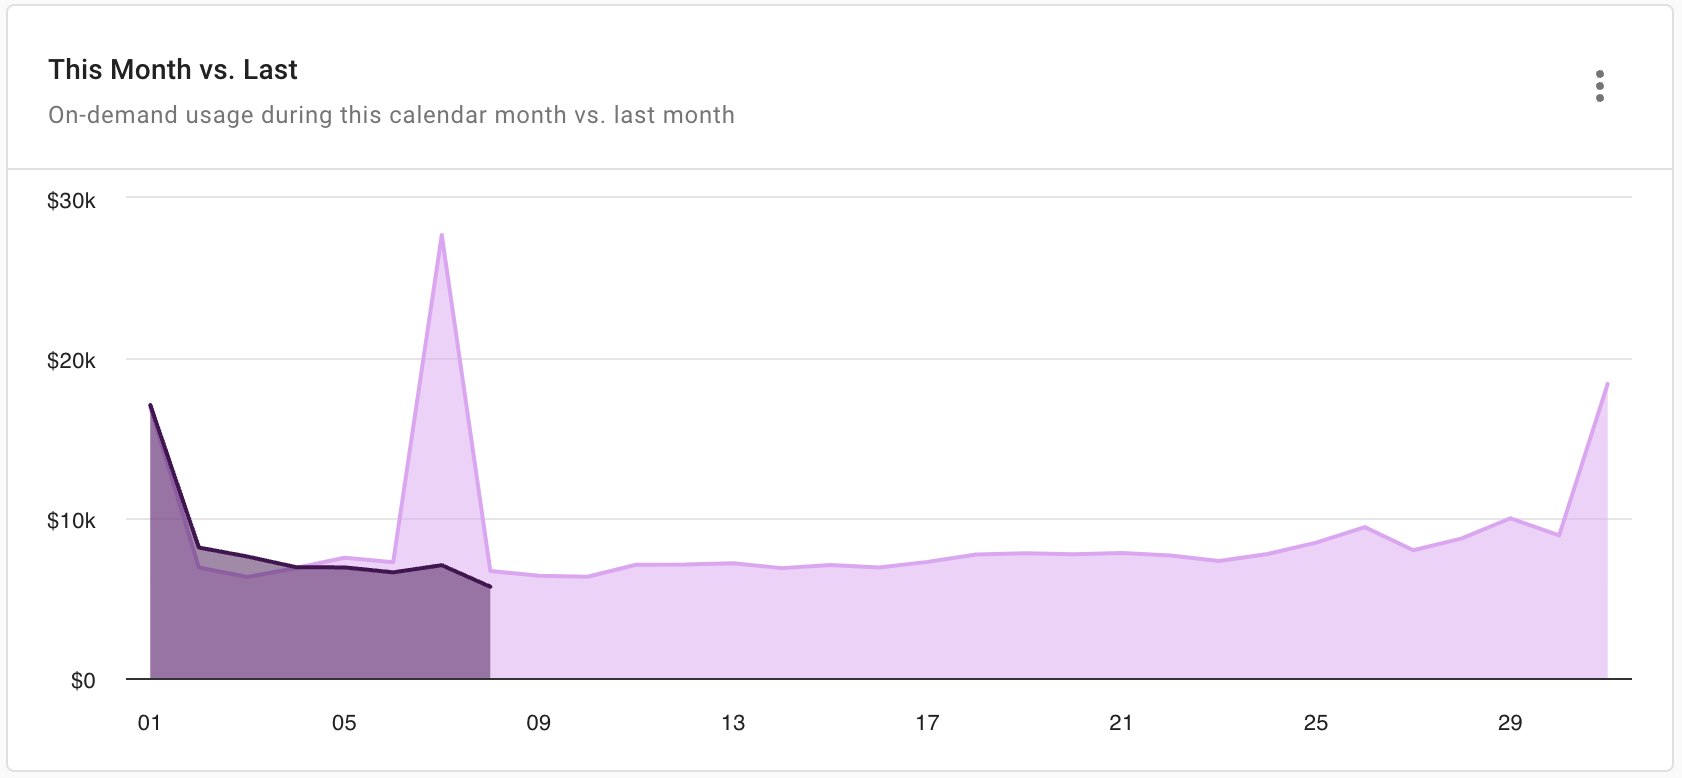
一度きりの購入(SP・RI・CUD)は、定期的なリザベーションの影響を反映するために含まれます。一方で、クレジットは通常、移行契約やその他の再発しない事由によるものであるため除外されます。
レポート設定:
- Metric: Cost
- Time Range: Last month to date
- Time Interval: Day
- Exclude partial intervals: Yes
- Filter results:
- Cost Type is not
CreditorCredit Adjustment - Credit not matches regexp
^GFS Cloud
- Cost Type is not
- Group by: Year, Month
Cost by Project/Account
Cost by Project/Account ウィジェットは、過去 30 日間におけるコストの上位 10 件の Google Cloud プロジェクト、AWS アカウント、Azure アカウントを表示します。これにより、主要なアカウントやプロジェクトでのアクティビティパターンをすばやく把握し、調査が必要な異常なコストに気づくことができます。
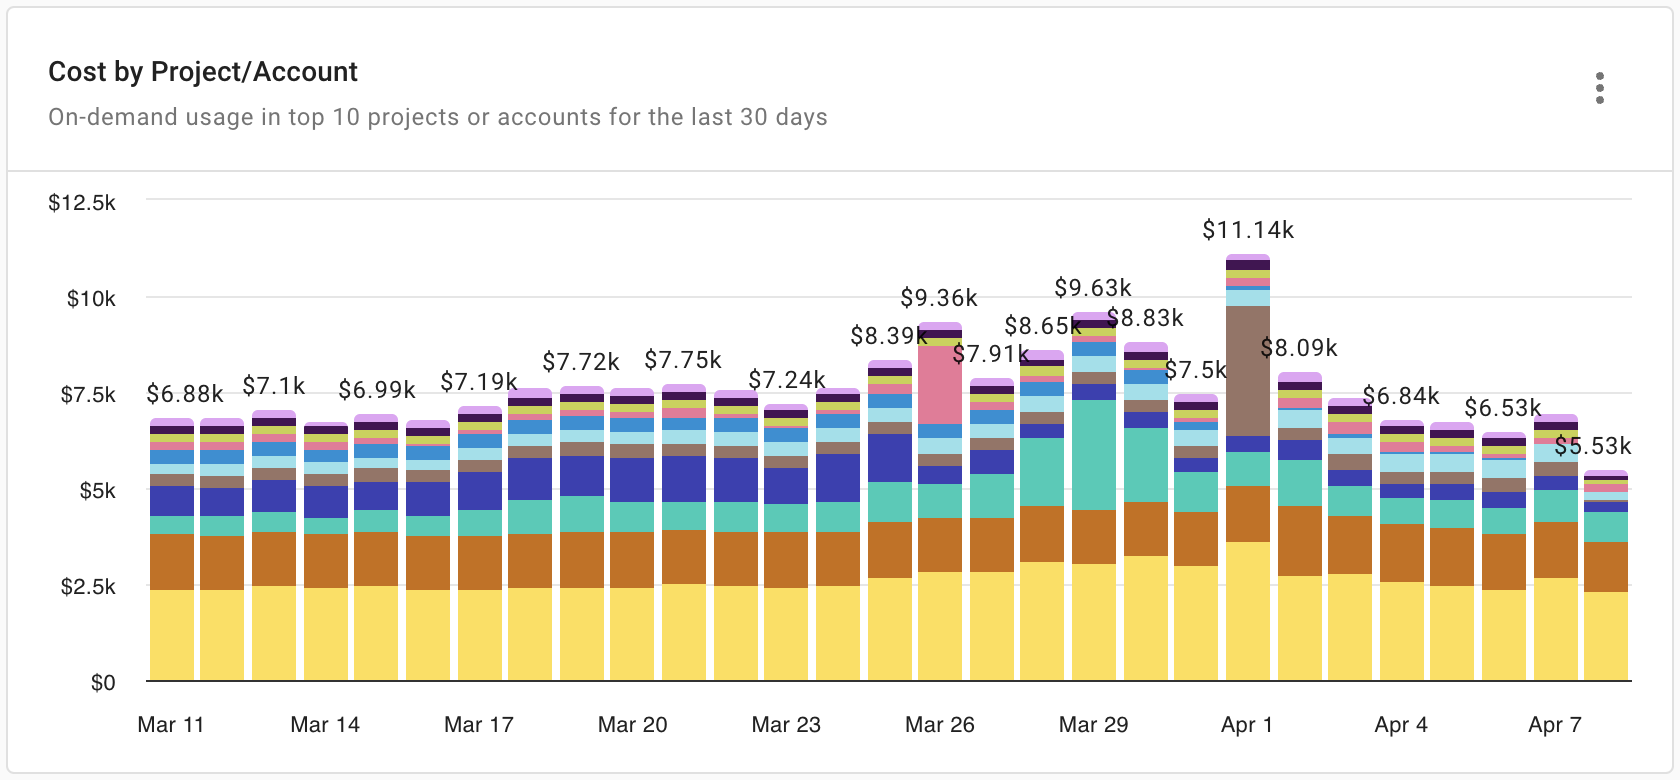
レポート設定:
- Metric: Cost
- Time Range: Last 30 days (include current day)
- Time Interval: Day
- Filter results:
- Allocation rule is not
AWS RIs, SPsorAWS Support - Cost Type is not
CreditorCredit Adjustment
- Allocation rule is not
- Group by: Project/Account ID
- Limit results:
- Limit by value: Cost not between -US$1.00 AND US$1.00
- Limit by top/bottom: Project/Account ID—Limit to top 10 by cost
FAQ
Historical Cloud Native Costs by Platform ウィジェットの合計コストが、Cost by Service ウィジェットの合計と一致しないのはなぜですか?
ダッシュボード上のウィジェットは、それぞれ異なるフィルターセットを使用しています。デフォルトでは一致しません。
たとえば、Cost by Service ウィジェットには AWS Support および RIs と SPs のコストは含まれませんが、これらのコストは Historical Cloud Native Costs by Platform ウィジェットには含まれます。さらに、Cost by Service ウィジェットはコスト上位 10 サービスのみを表示するため、コストが大きい支出の一部が除外されている可能性があります。
必要に応じて、関心のある項目を含めた新しいレポートを作成し、それらをカスタムダッシュボードに追加できます。
CloudHealth に表示される合計コストがコンソールと一致しないのはなぜですか?
CloudHealth における合計コストは、特にライブビューではコンソールの合計コストと単純に比較することはできません。内訳と合計コストには、いくつかの影響要因があります。
-
CloudHealth と DoiT コンソールでは、データの取り込み・処理タイミングが異なります(一般的にコンソールの方がより頻繁にデータを取得し、処理にかける時間も短くなります)。
-
請求への Flexsave の影響は CloudHealth では可視化されません。
-
プロモーションクレジットはコンソールの合計に反映されますが、CloudHealth には含まれません。
差異について質問がある場合は、エキスパートへ問い合わせ を開いてください。