Insights dashboard
The Insights dashboard provides a centralized view of insights.
Required permission
- Insights Manager
Access the dashboard
In the DoiT console, there are two ways to access the Insights dashboard:
-
Select Workload optimization > Insights from the top navigation mega menu.
-
Select Automation and operations > Composer from the top navigation mega menu, and then select View all insights on the Composer page.
The Insights dashboard consists of sidebar options, account coverage and scan status, dashboard tabs, and a toggle button to switch between insights and resources views.
Sidebar options
The sidebar on the left side provides the following options:
-
Insights scope: Narrows down the insights scope by the selected cloud accounts.
-
Insights: Filters insights and resources by category.
-
Explore 3rd party insights: Launches the dashboard of third-party insights.
Account coverage and scan status
When viewing proprietary insights, at the bottom of the sidebar you can find the following information
-
Account coverage: The count of onboarded accounts out of the total eligible accounts.
-
Last scan: The date and time of the most recent scan.
Select anywhere in this section to launch the Composer & Insights coverage and Account scan status.
When one or more connected Composer accounts are not yet connected for billing, a warning banner appears below the page header for the Cost and All categories. The banner indicates whether cost savings data is incomplete (some accounts are missing billing data) or unavailable (no accounts have billing data). To connect your accounts for billing, see Connect your cloud.
Dashboard tabs
The insights dashboard has three tabs: Overview, Highlights, and Historical data. The selected tab is preserved in the URL, so you can bookmark or share a link to a specific view.
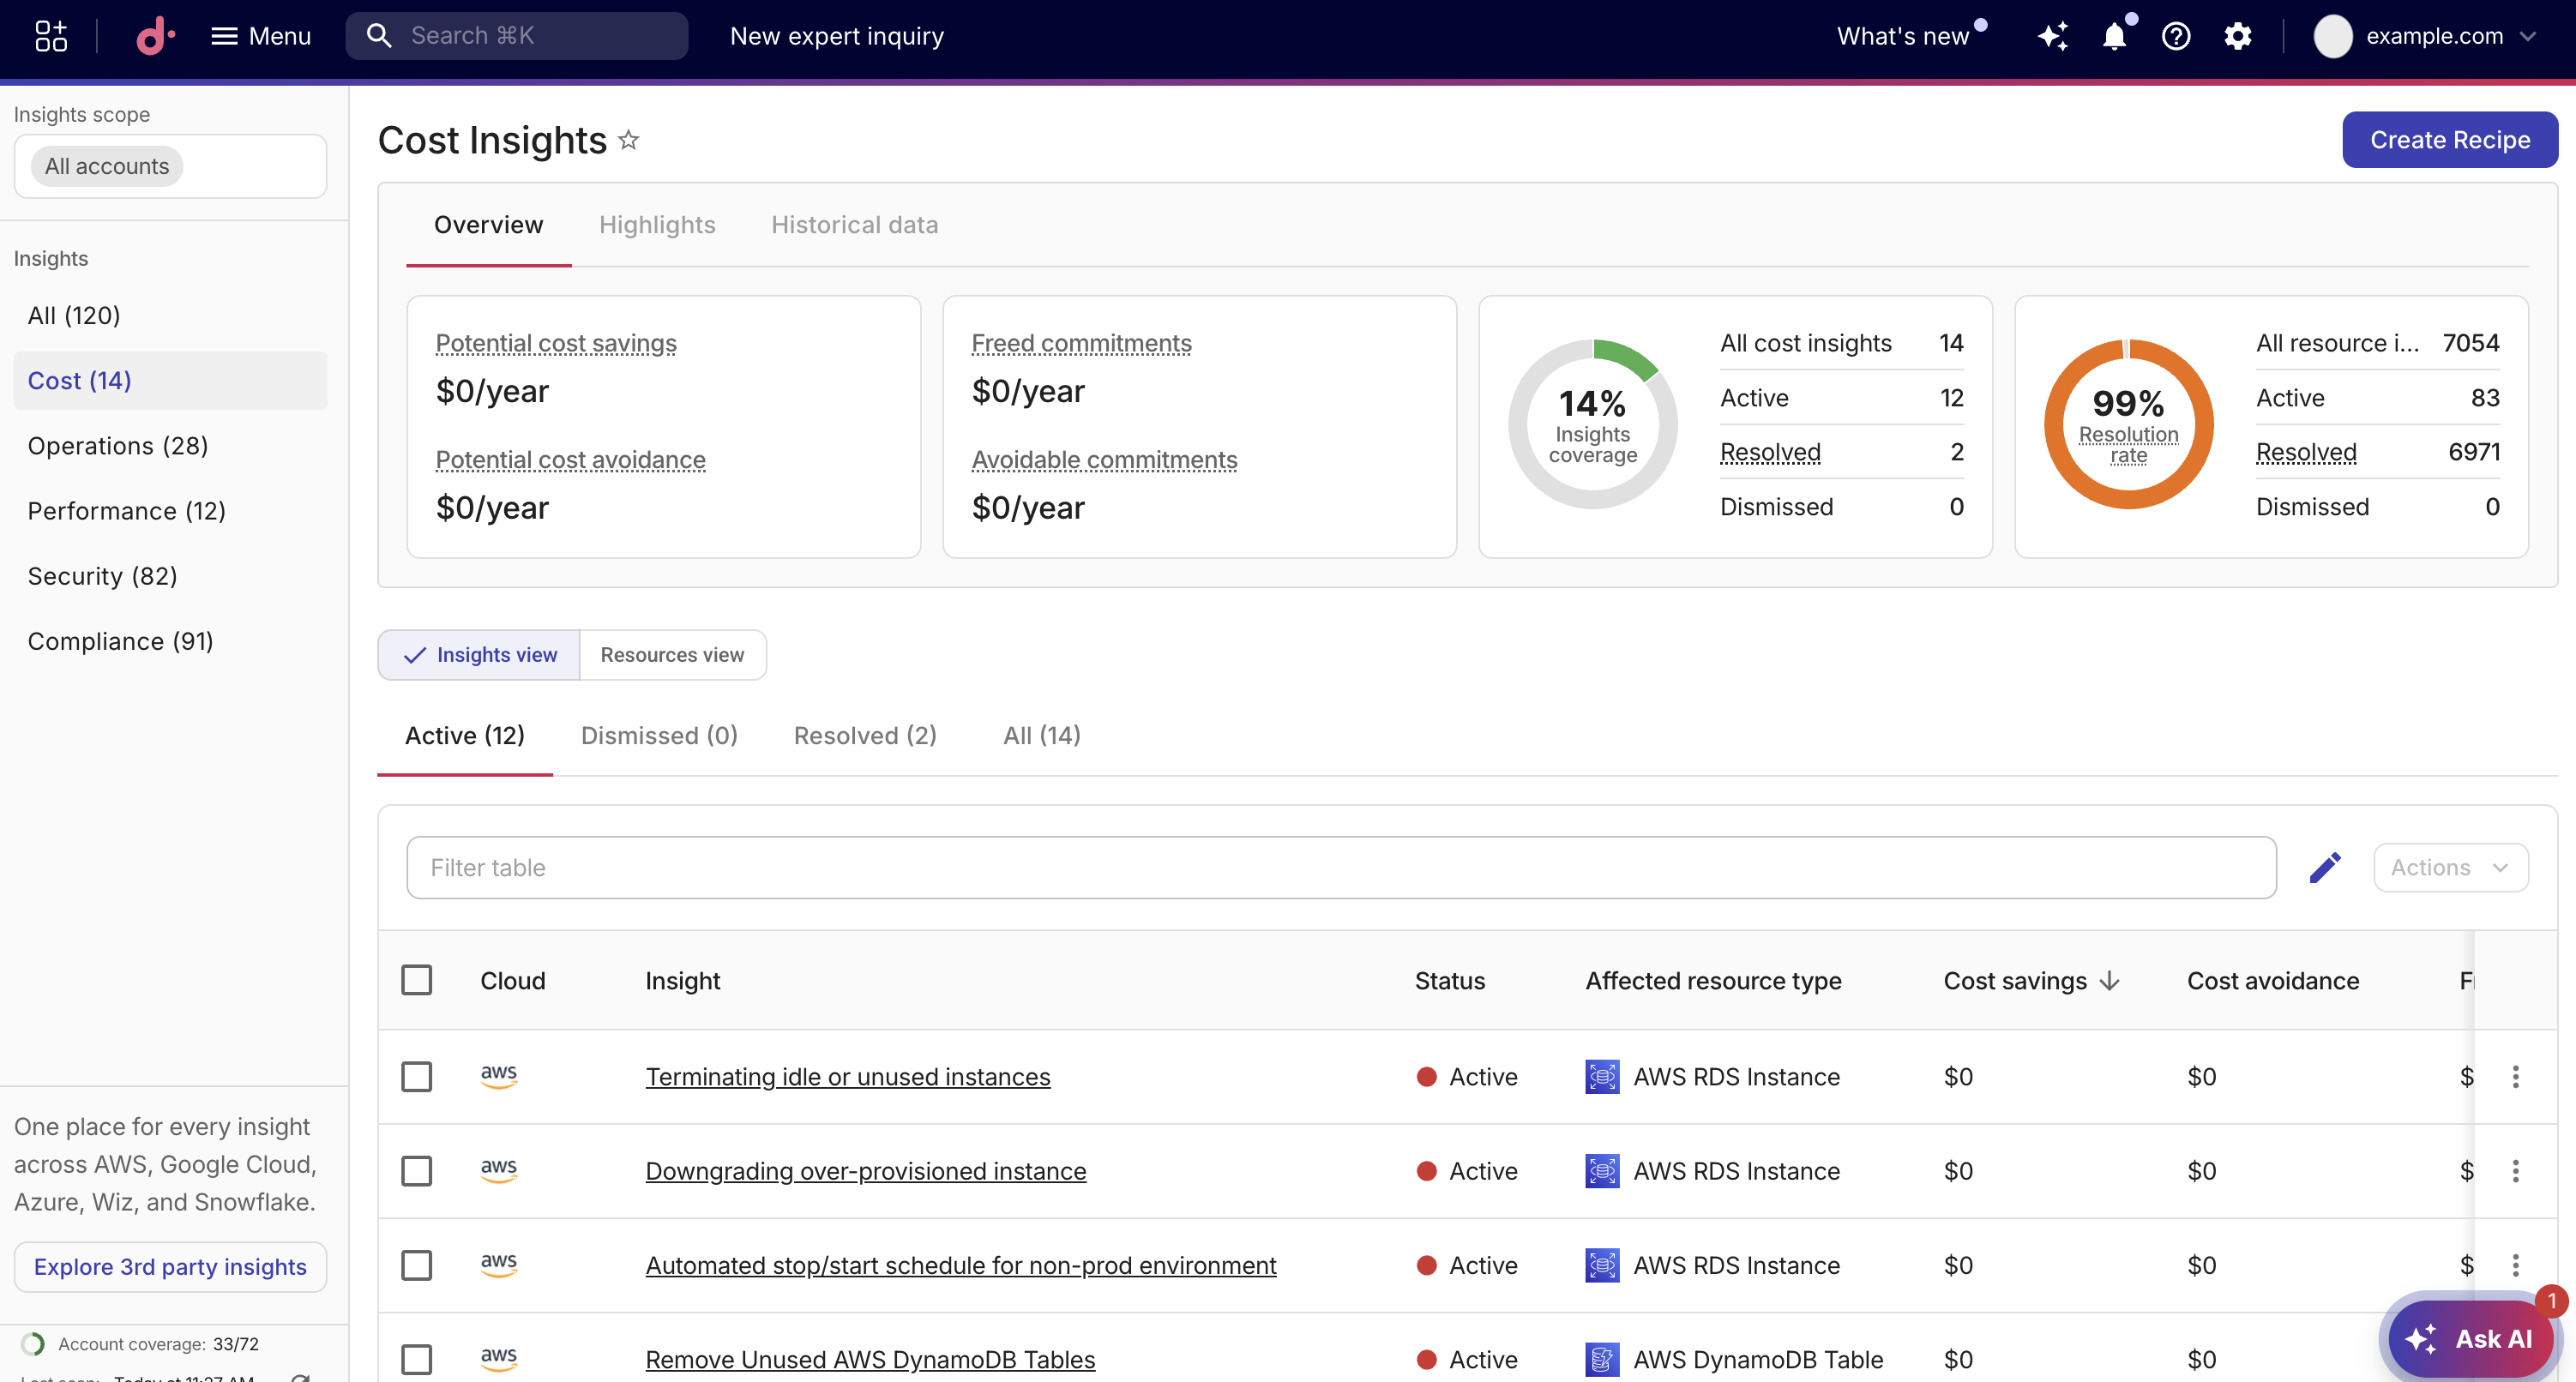
Overview
The Overview tab displays two summary charts of DoiT-proprietary insights and affected resources.
When viewing the Cost or All categories, additional cards appear alongside the insight and resource charts if at least one connected Composer account has billing data:
-
Potential cost savings: The estimated annualized savings from optimizing your current resources, displayed in your organization's currency. Hover the label for a brief definition. See Cost insight financial metrics.
-
Freed commitments: The annualized value of commitment coverage that would be freed when you act, displayed in your organization's currency. Hover the label for a brief definition. See Cost insight financial metrics.
Values are displayed as annualized amounts (per year). For dash values, $0, and the Unable to retrieve data. message, see Dashes and $0. For how all four financial metrics are calculated and how they work together, see Cost insight financial metrics.
The overview also includes the following charts:
-
Insights coverage: Shows the percentage of covered insights relative to all resources. The chart includes a breakdown by status: Active, Resolved, and Dismissed.
-
Resolution rate: Shows the percentage of resource issues resolved, averaged across selected accounts. The chart includes a breakdown by status: Active, Resolved, and Dismissed.
The charts reflect the currently selected cloud accounts and insights category. Adjusting the filters updates the charts to show only the relevant data.
Highlights
The Highlights tab displays two side-by-side panels that surface the most important findings at a glance.
-
Most affected resources: Lists cloud resources ranked by the number of active issues. Each row shows a resource-type icon, the resource name, and color-coded counts for each severity level. Select any row to open the resource details panel for that resource. Scroll down to progressively load more resources.
-
Recent insights: Lists recently detected active insights, ordered by most recent day first and then by severity within the same day. Insights are grouped by relative date, with date labels displayed in your configured app language. Each insight displays a clickable title that opens the insight detail page, along with a severity badge. Scroll down to progressively load more insights.
Both panels reflect the currently selected cloud accounts and insights category.
Historical data
The Historical data tab displays an Active and resolved issues tracker chart that plots the number of active and resolved issues over time.
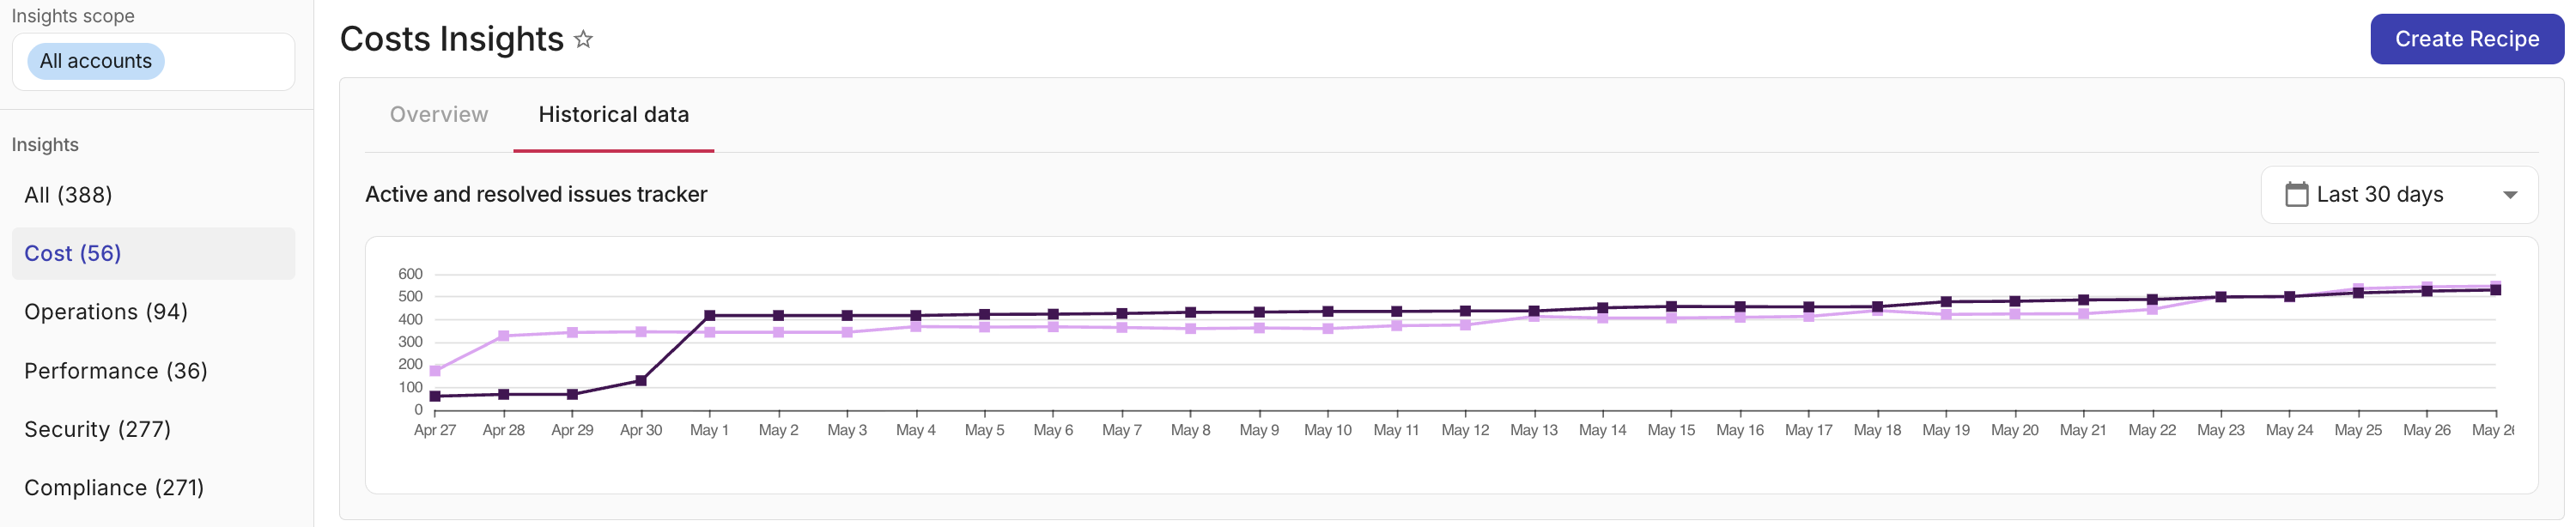
Use the time range selector in the top-right corner of the chart to adjust the displayed period:
-
Last 7 days: Shown in daily intervals.
-
Last 30 days (default): Shown in daily intervals.
-
Last 90 days: Shown in weekly intervals.
The chart updates to show data for the selected insights category in the sidebar, such as Cost, Security, or All, and the selected cloud accounts.
Toggle between views
The Insights dashboard offers two views:
-
Insights View: Lists insights generated by Composer. Each insight is a recommendation based on recipe evaluations across your connected cloud accounts.
-
Resources View: Lists the individual cloud resources affected by active insights.
You can switch between views using the toggle button at the top of the dashboard. The insights scope and category, if specified in the left sidebar, are preserved across views.