Kubernetes Intelligence dashboard
Kubernetes Intelligence incorporates utilization data collected by PerfectScale and billing data by cloud providers. It provides full visibility into your containerized workloads deployed in EKS, GKE, AKS, and self-managed clusters, helping you optimize your Kubernetes environment.
Required permission
- Cloud Analytics Read Only, Cloud Analytics User, or Cloud Analytics Admin
Access the dashboard
Open the Kubernetes Intelligence dashboard in the console.
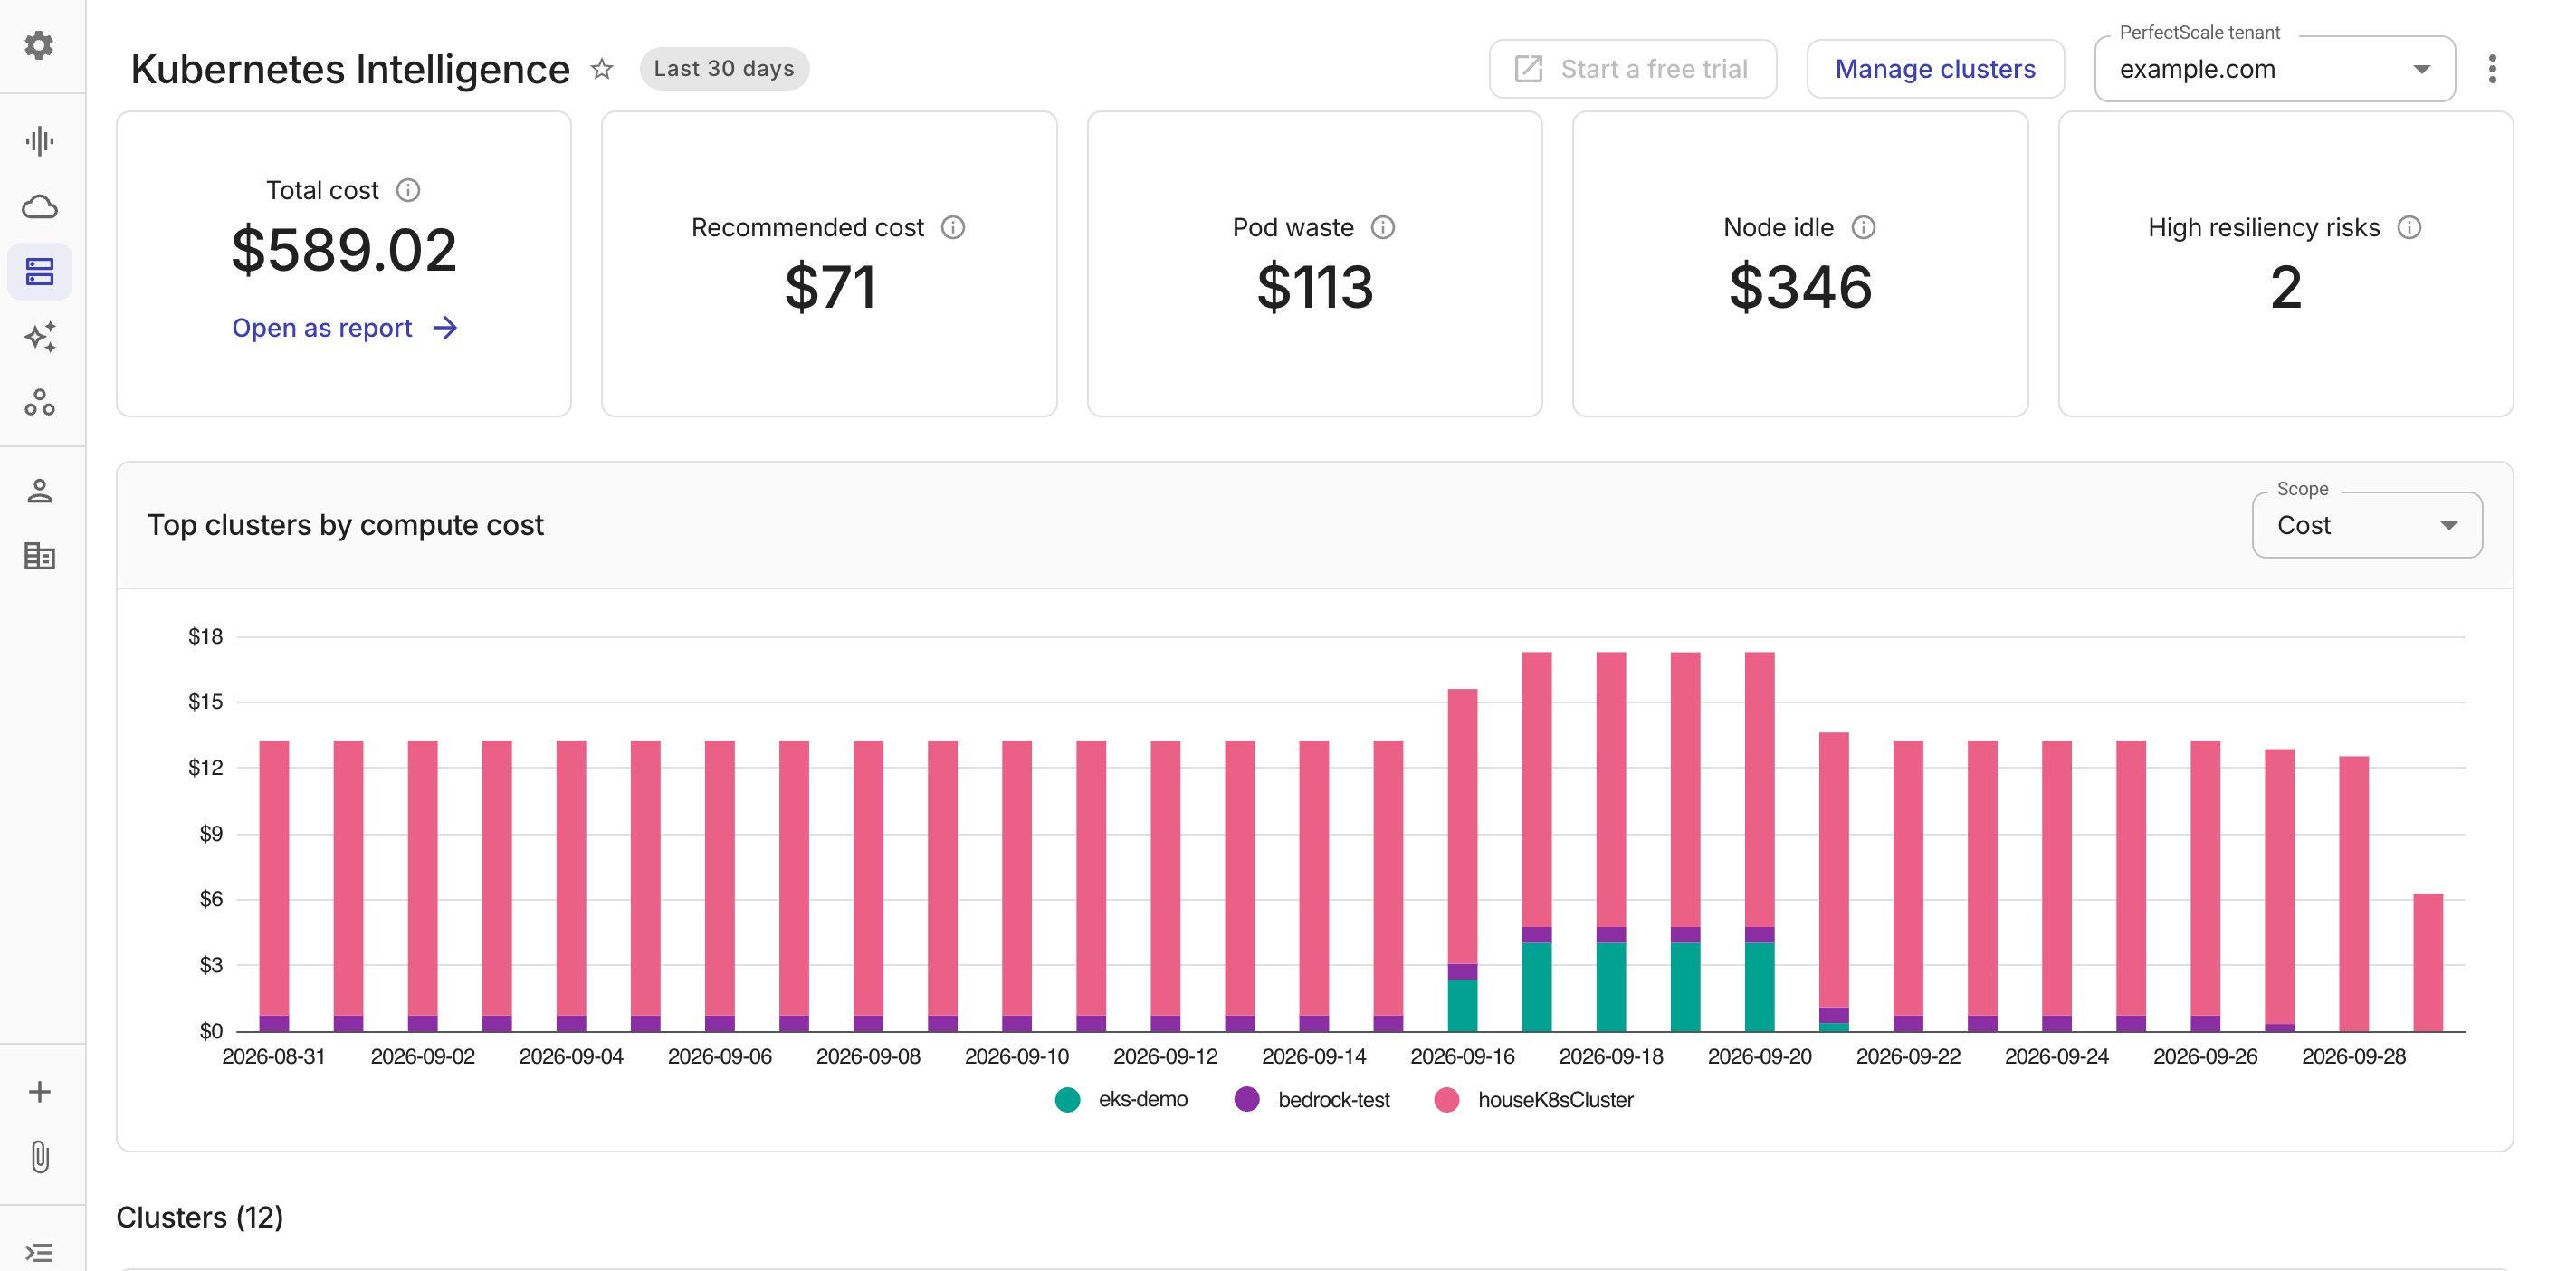
The Kubernetes Intelligence dashboard consists of the following parts:
-
Header bar:
-
A star icon (☆): Select the icon to add Kubernetes Intelligence to your Favorite dashboards dropdown in the Favorites bar.
-
Last 30 days: The overview dashboard always shows data from the last 30 days. You can select different time ranges when viewing individual cluster details on the Cluster utilization dashboard.
-
See General settings for other options in the header bar.
-
-
Metric cards: Overview panels that show the summary for all the clusters that have an active Kubernetes Intelligence agent during the last 30 days.
-
Top clusters by compute cost/waste: By default, this chart displays the top 10 Kubernetes clusters by compute cost from the last 30 days, based on cloud billing data. You can use the Scope dropdown to switch the view between cost and waste.
-
Clusters overview: A list of clusters that have installed the Kubernetes Intelligence agent.
General settings
-
Start a free trial: Select this option to navigate to the PerfectScale for Kubernetes website, or send an invitation if you already have a PerfectScale tenant but haven't signed up as a user.
If you already have full PerfectScale access, this option shows Go to PerfectScale and opens the PerfectScale web application.
-
Manage clusters: Launches the Kubernetes assets page, where you can check agent status, install agent, or upgrade agent.
-
PerfectScale tenant: This option is available only if you have more than one PerfectScale tenant. You can use the dropdown to switch the tenant.
-
More options: Select the kebab menu (⋮) and choose Set as default to set the Kubernetes Intelligence dashboard as your default dashboard, or Share dashboard to copy the dashboard URL and share it with others.
Metric cards
-
Total cost: The total cost of clusters with an active Kubernetes Intelligence agent during the last 30 days.
-
Each cluster's cost is based on its own billing source: DoiT billing data, or a PerfectScale estimate for clusters without billing data.
-
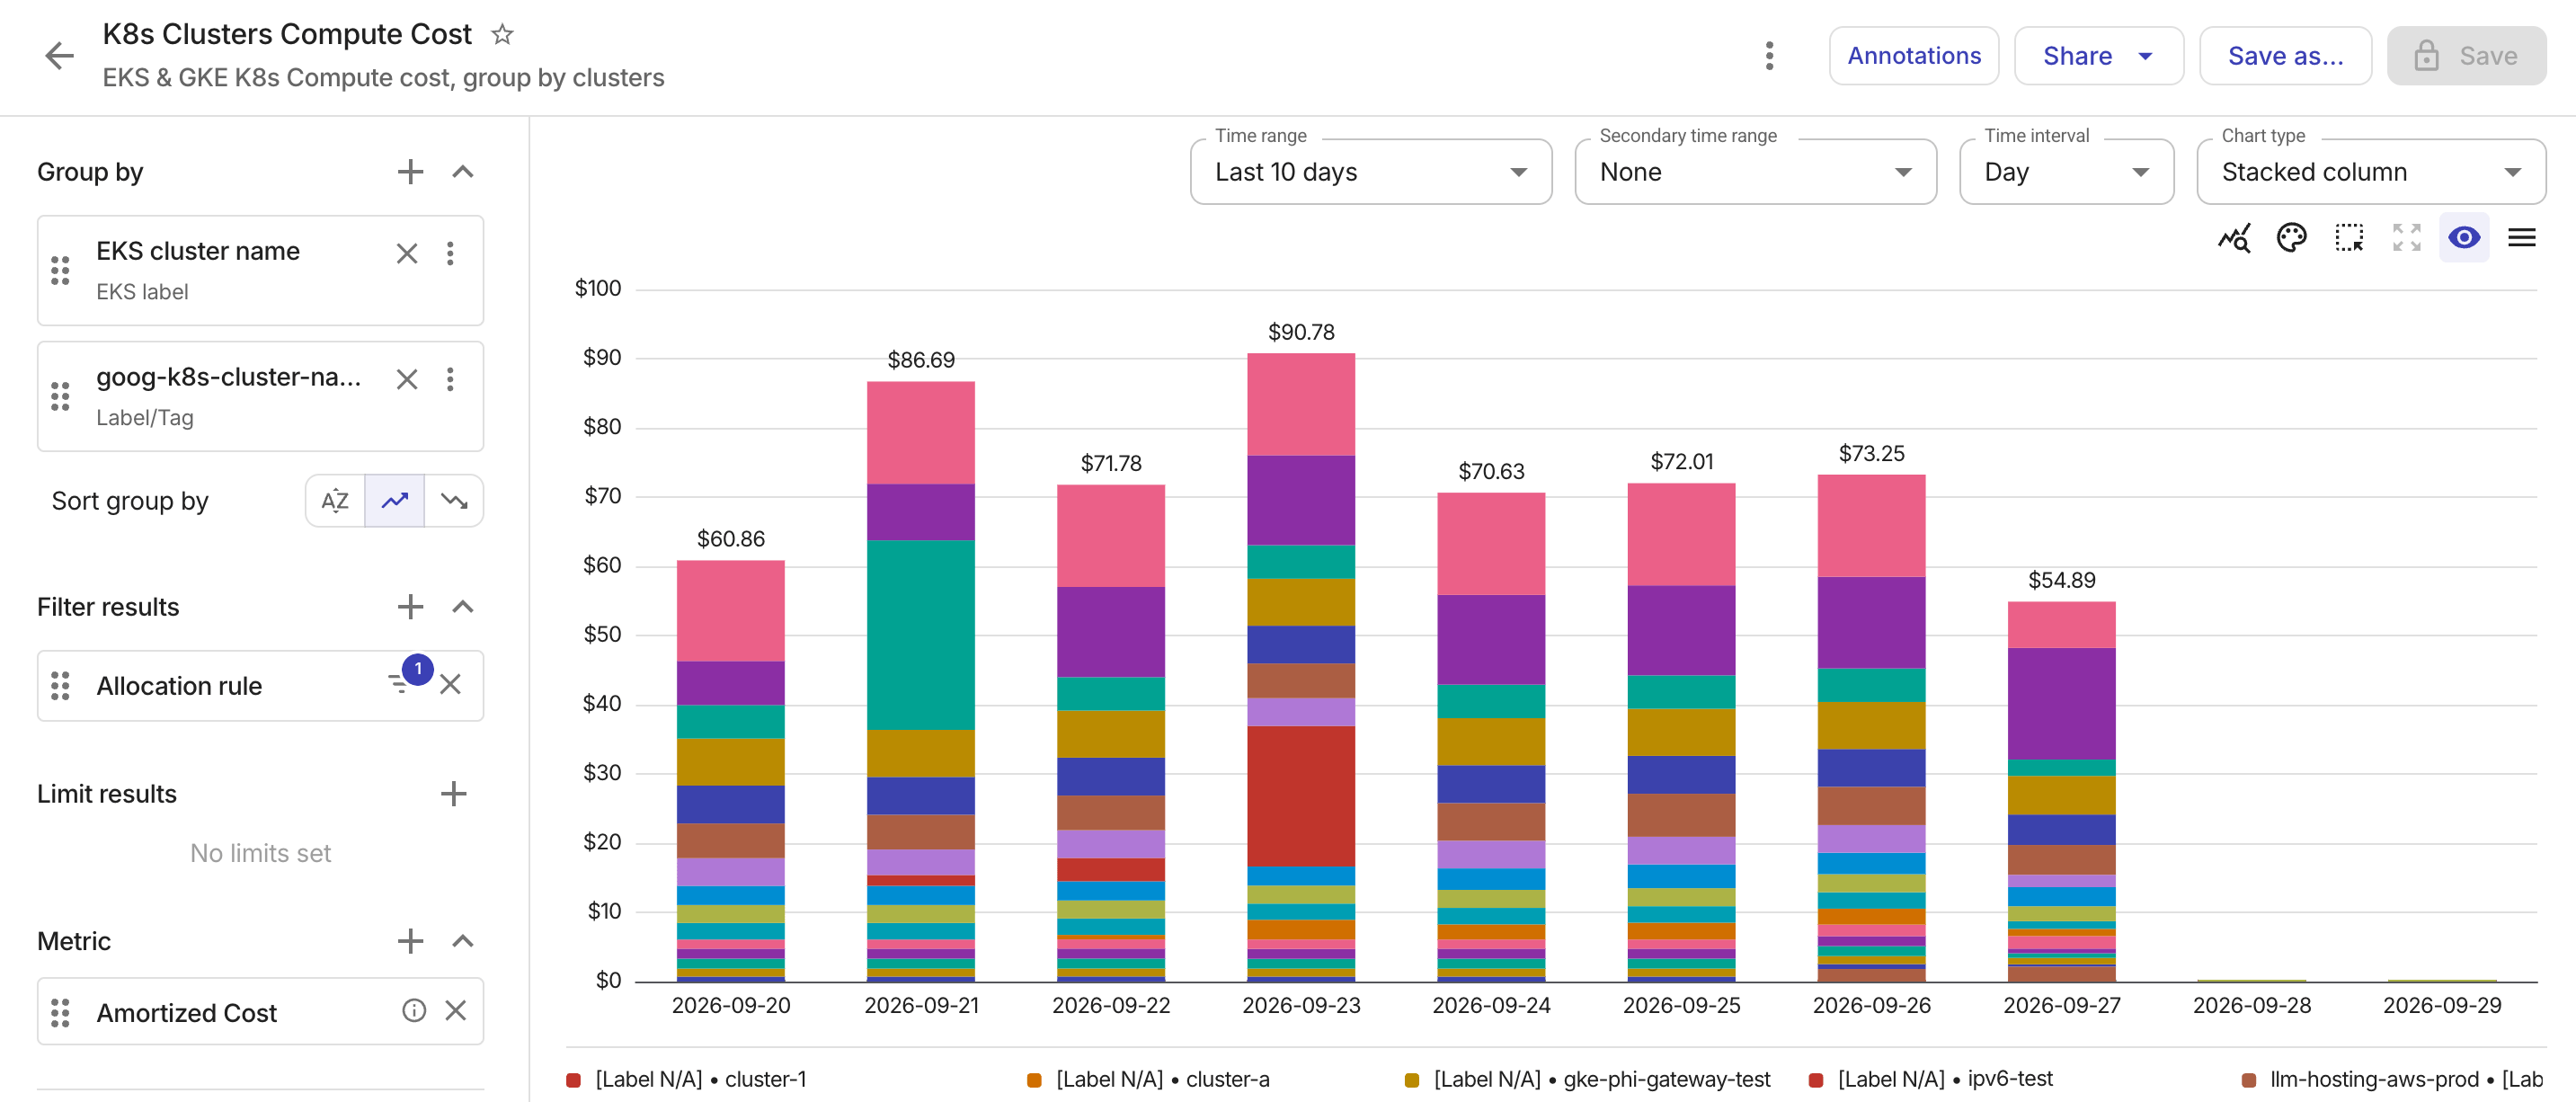
Select Open as report to view the data in the K8s Clusters Compute Cost preset report when billing data is available.
-
-
Recommended cost: The recommended cost that could be achieved based on PerfectScale recommendations.
-
Pod waste: The total cost of overprovisioned pods across clusters during the last 30 days, based on utilization data collected by the Kubernetes Intelligence agent.
-
Node idle: The total cost of idle nodes across clusters during the last 30 days, based on utilization data collected by the Kubernetes Intelligence agent.
-
High resiliency risks: The total number of workloads with high resiliency risks across clusters during the last 30 days, identified by PerfectScale when the
At Riskindicator isHigh. See Resiliency alerts for more information.
Clusters overview
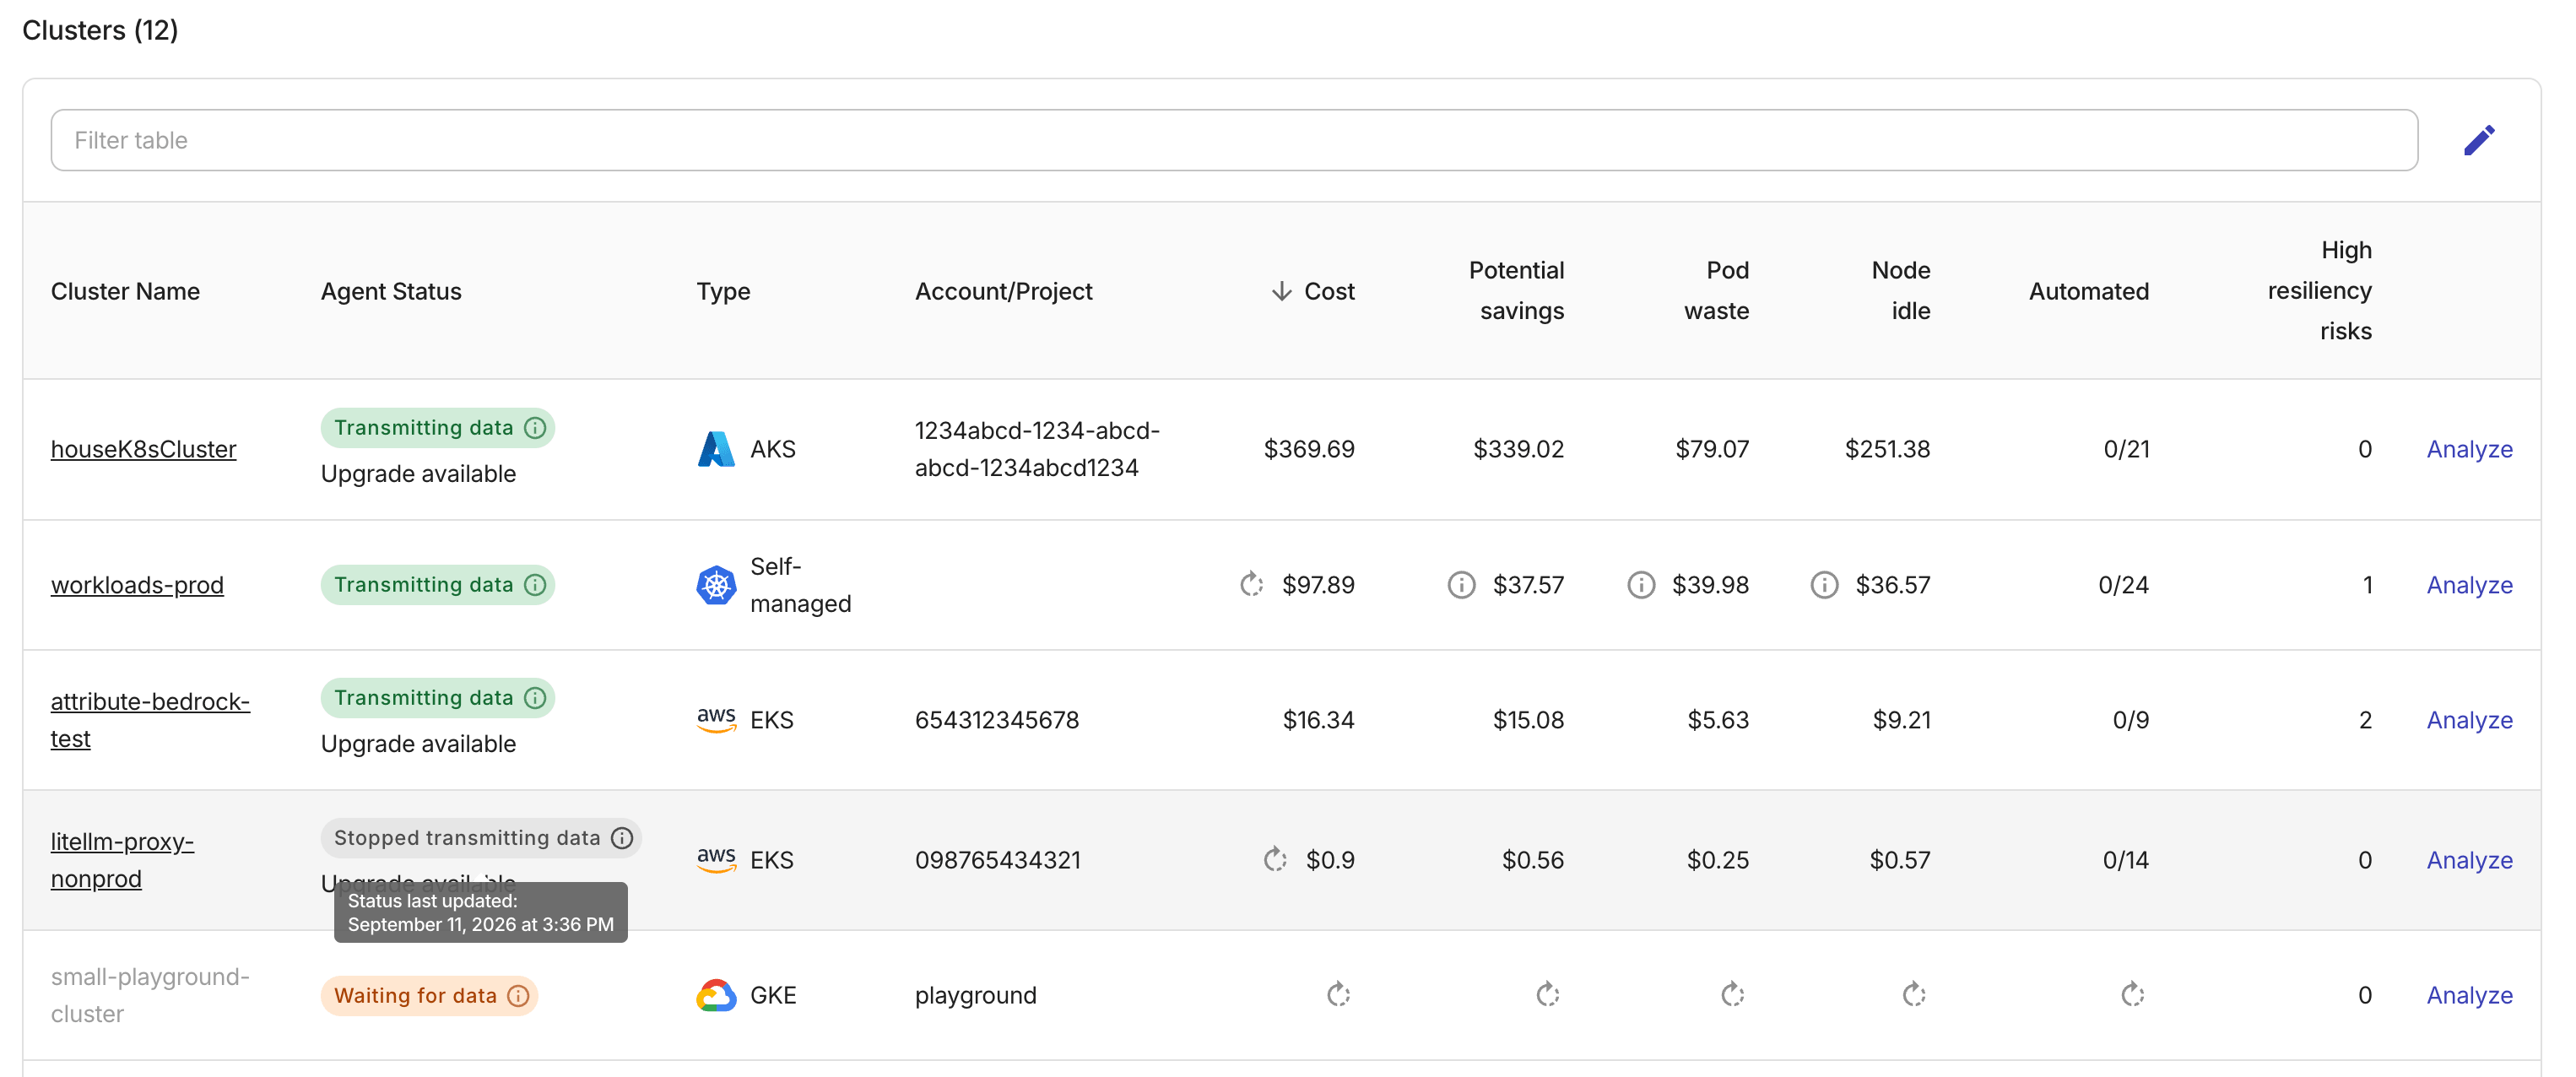
At the bottom of the Kubernetes Intelligence dashboard is the list of clusters with an active Kubernetes Intelligence agent during the last 30 days.
-
Cluster name: The name of the cluster. You can select a cluster name to open its utilization dashboard.
-
GKE clusters: Based on the label key
goog-k8s-cluster-namein the Google Cloud billing data. -
EKS clusters: Based on the
eks:cluster-nametag in AWS cost and usage data. EKS cluster data is populated retroactively for existing billing records. -
AKS clusters: Derived from AKS resource metadata and populated forward-only for new billing data.
-
-
Agent status: The status of the Kubernetes Intelligence agent. You can hover over to check when the status was last updated.
-
Type: The type of the cluster: EKS, GKE, AKS, or self-managed.
-
Cost: The total cost of the cluster. The source of the cost value depends on the cluster type and whether DoiT billing data is available:
-
EKS and GKE clusters: Based on cloud billing data imported into DoiT.
-
AKS clusters: Based on DoiT billing data if available in DoiT. If not yet available, the cost shown is a PerfectScale estimate.
-
Self-managed clusters: Always a PerfectScale estimate based on shelf prices.
-
-
Potential savings: The estimated amount of cost savings that could be achieved by right-sizing workloads and optimizing resource requests, based on PerfectScale recommendations and automation per your current usage.
-
Pods waste: The total cost of overprovisioned pods in the cluster.
-
Node idle: The total cost of idle nodes in the cluster.
-
Automated: The number of automations that have been enabled versus the total number of automations identified. See Enable PerfectScale Automation for details.
-
High risks: The total number of workloads with high resiliency risks in the cluster, identified by PerfectScale when the
At Riskindicator isHigh. See Resiliency alerts for more information.