Dashboard
This page explains how to interact with the Commitment Simulator dashboard, such as selecting data, reading the summary table, interpreting charts, and understanding page states.
Commitment Simulator dashboard
To access the Commitment Simulator dashboard:
-
Sign in to the DoiT console.
-
Select Rate optimization > PerfectScale for Commitments from the top navigation mega menu.
-
Select Commitment Simulator to launch the dashboard.
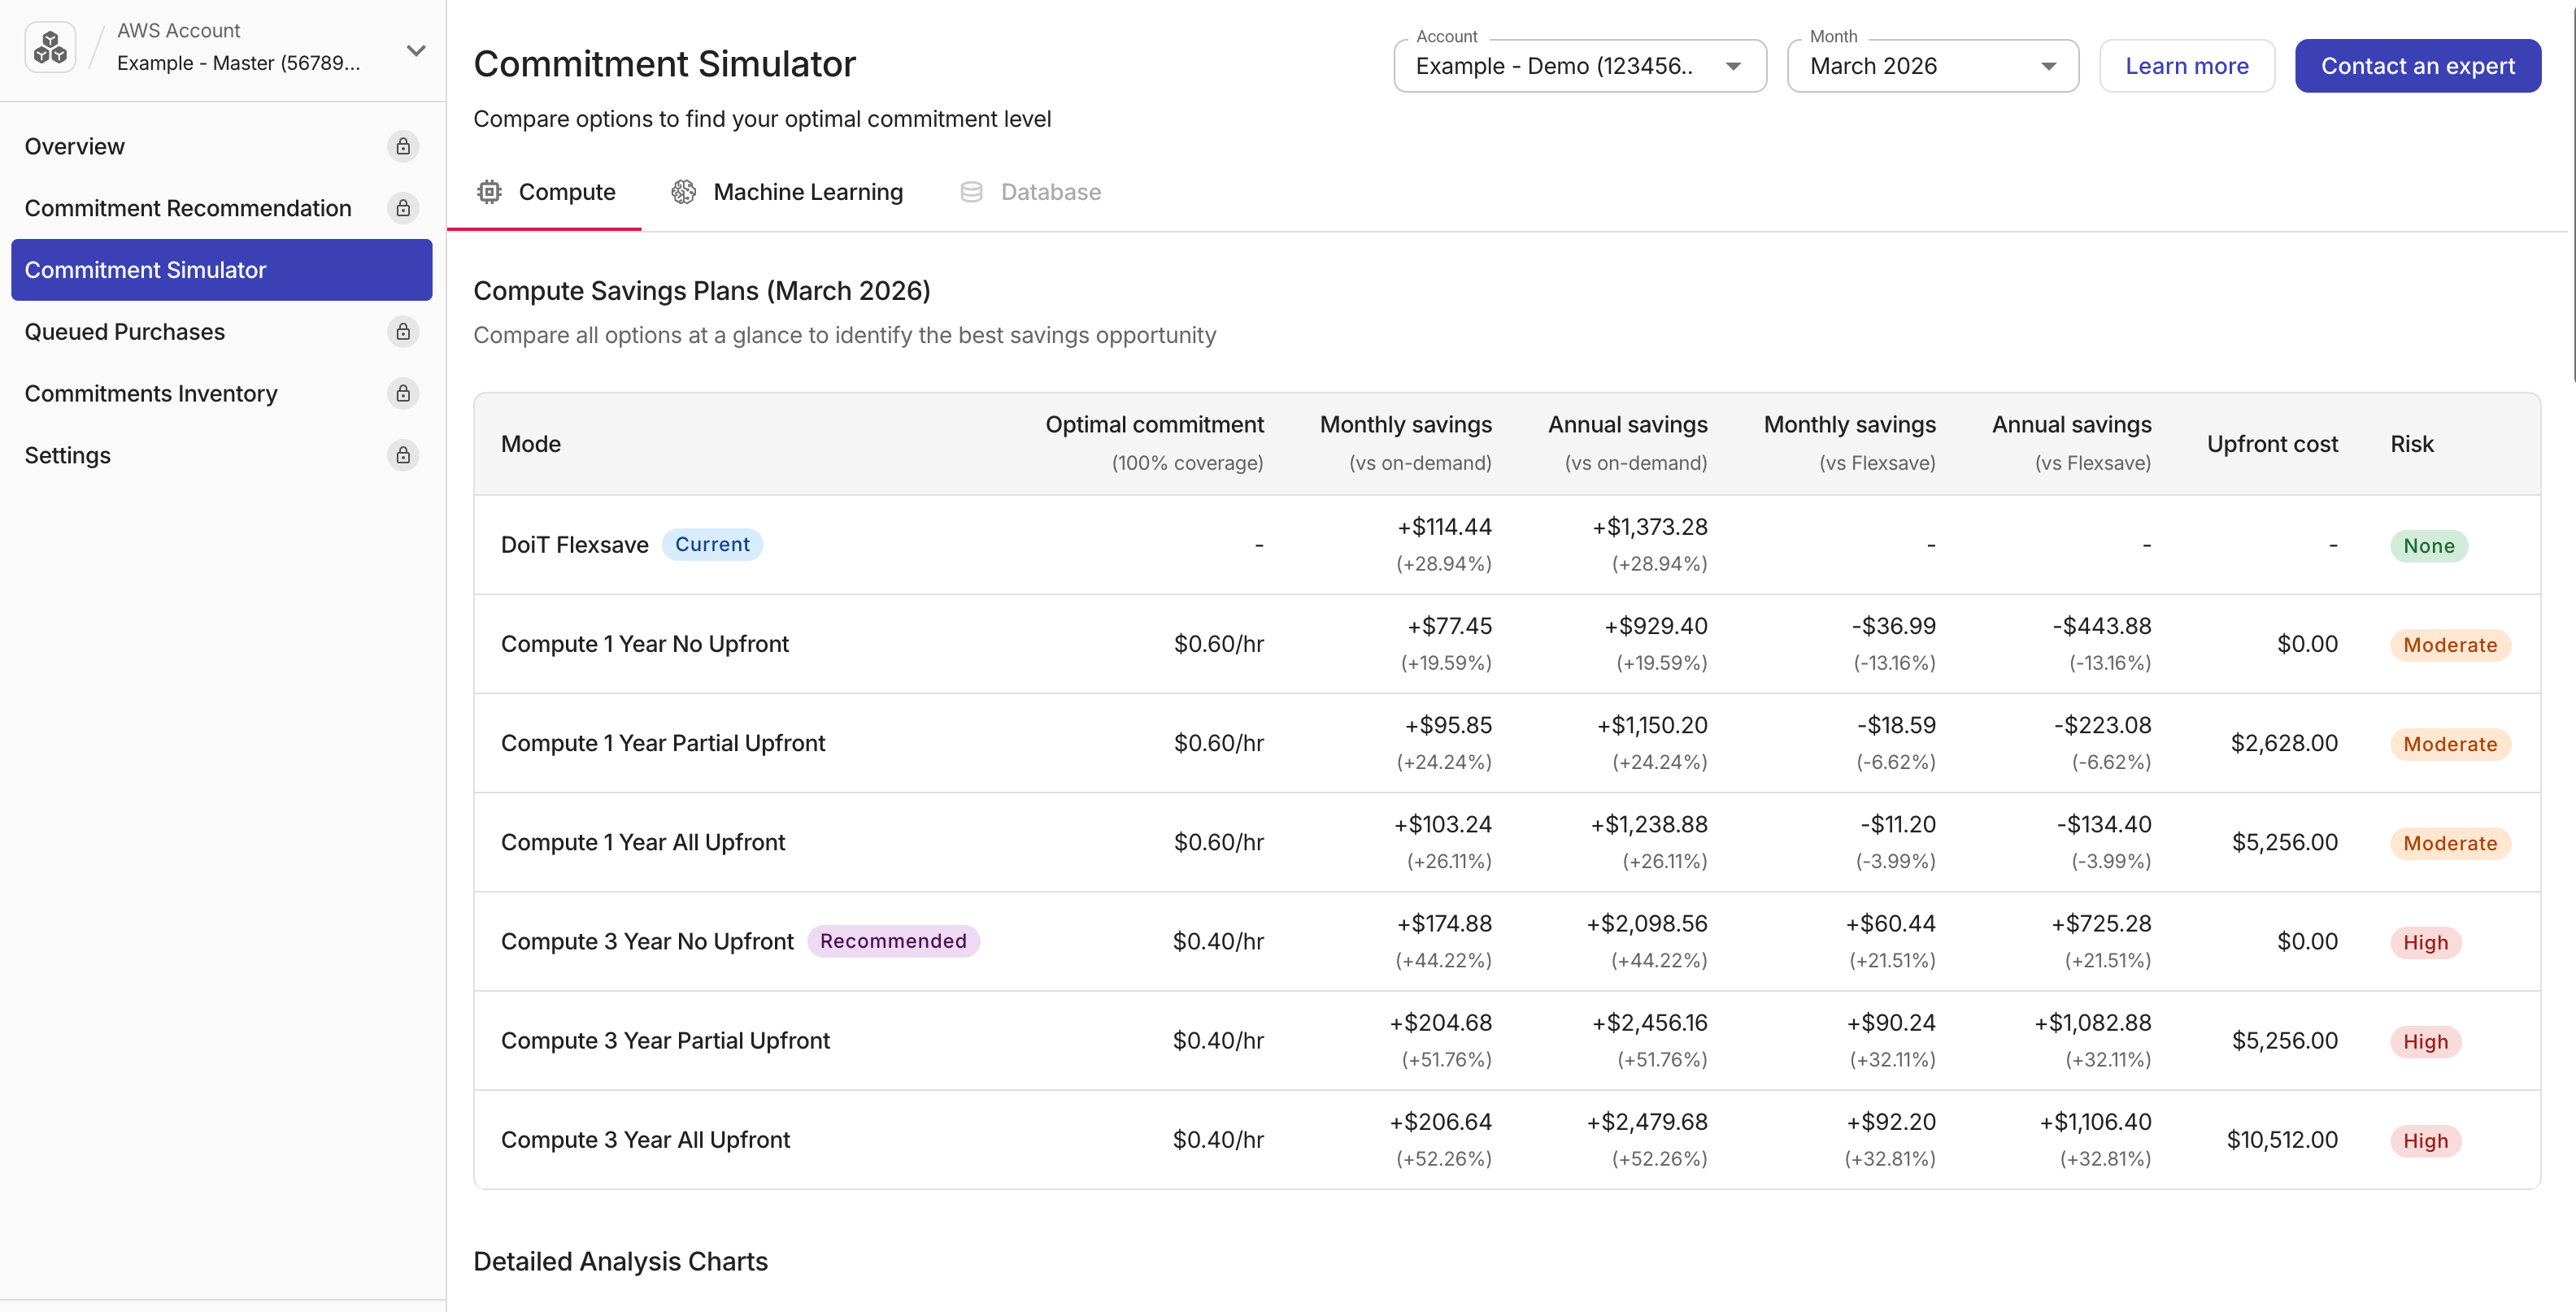
Selectors
Use the dropdowns at the top of the page to define the scope to analyze:
| Selector | Description |
|---|---|
| Management Account | The AWS Management Payer Account name and ID. Management account is the primary billing account in an AWS Organization that aggregates costs from linked accounts. Each payer account is analyzed independently. |
| Account | AWS member accounts. This option allows you to analyze Savings Plans at the account level. |
| Month | The billing month to analyze. The most recent month is shown by default. |
Commitment types
Select a tab to view specific commitment types. A disabled tab means the selected account had no usage that could benefit from that commitment type during the selected month.
AWS Savings Plan types
| Typ | Covered services |
|---|---|
| Compute | Amazon EC2, AWS Fargate (ECS and EKS), AWS Lambda |
| Machine Learning | AWS SageMaker: Unified Studio Notebooks, Studio JupyterLab, Studio Code Editor, On-Demand Notebooks, RStudio, Processing, Data Wrangler, Training, Real-Time Inference, Async Inference, Batch Transform, HyperPod Clusters |
| Database | Aurora (RDS Instances, Serverless v2, DSQL), DynamoDB (On-Demand & Provisioned), ElastiCache for Valkey (Instances & Serverless), DocumentDB (Instances & Serverless), Neptune (Instances, Serverless, Analytics), Keyspaces, Timestream, DMS (Instances & Serverless), OpenSearch |
-
Compute and Machine Learning Savings Plans support all combinations of term (1-year, 3-year) and payment option (No Upfront, Partial Upfront, All Upfront).
-
Database Savings Plans only support 1-year term with No Upfront payment.
Summary table
The summary table compares all available commitment options for the selected scope.
-
Each row represents a term and payment combination. For example, Compute 3 Year No Upfront.
-
A row for DoiT Flexsave is included when Flexsave for Compute is active.
| Column | Description |
|---|---|
| Mode | Term and payment option. The best option is marked Recommended (green). |
| Optimal commitment | The $/hr commitment that would have produced the greatest savings for that mode and billing month, based on actual past usage. See Understanding the optimal commitment. |
| Monthly savings | Monthly savings at the optimal commitment point, shown separately vs on-demand and vs Flexsave (if applicable). |
| Annual savings | Annualized savings (monthly savings × 12). |
| Upfront cost | One-time payment required at purchase. See Payment options. |
| Risk | Risk levels are decided by the commitment terms. |
Payment options
| Payment option | Upfront payment | Best for |
|---|---|---|
| No Upfront | $0 | Preserving cash flow |
| Partial Upfront | Half of total commitment cost | Balancing savings with cash flow |
| All Upfront | Full commitment cost | Maximizing discount when capital is available |
Risk levels
| Risk | Term | Description |
|---|---|---|
| No risk | Flexsave | Fully managed by DoiT; no long-term commitment. |
| Moderate | 1-year | One year of commitment. Easier to adjust if usage changes. |
| High | 3-year | Deeper discounts with a three-year lock-in. |
Once purchased, a Savings Plan:
-
Cannot be canceled or modified.
-
Charges the committed hourly rate regardless of actual usage.
-
Remains in effect for the full 1- or 3-year term.
Analysis charts
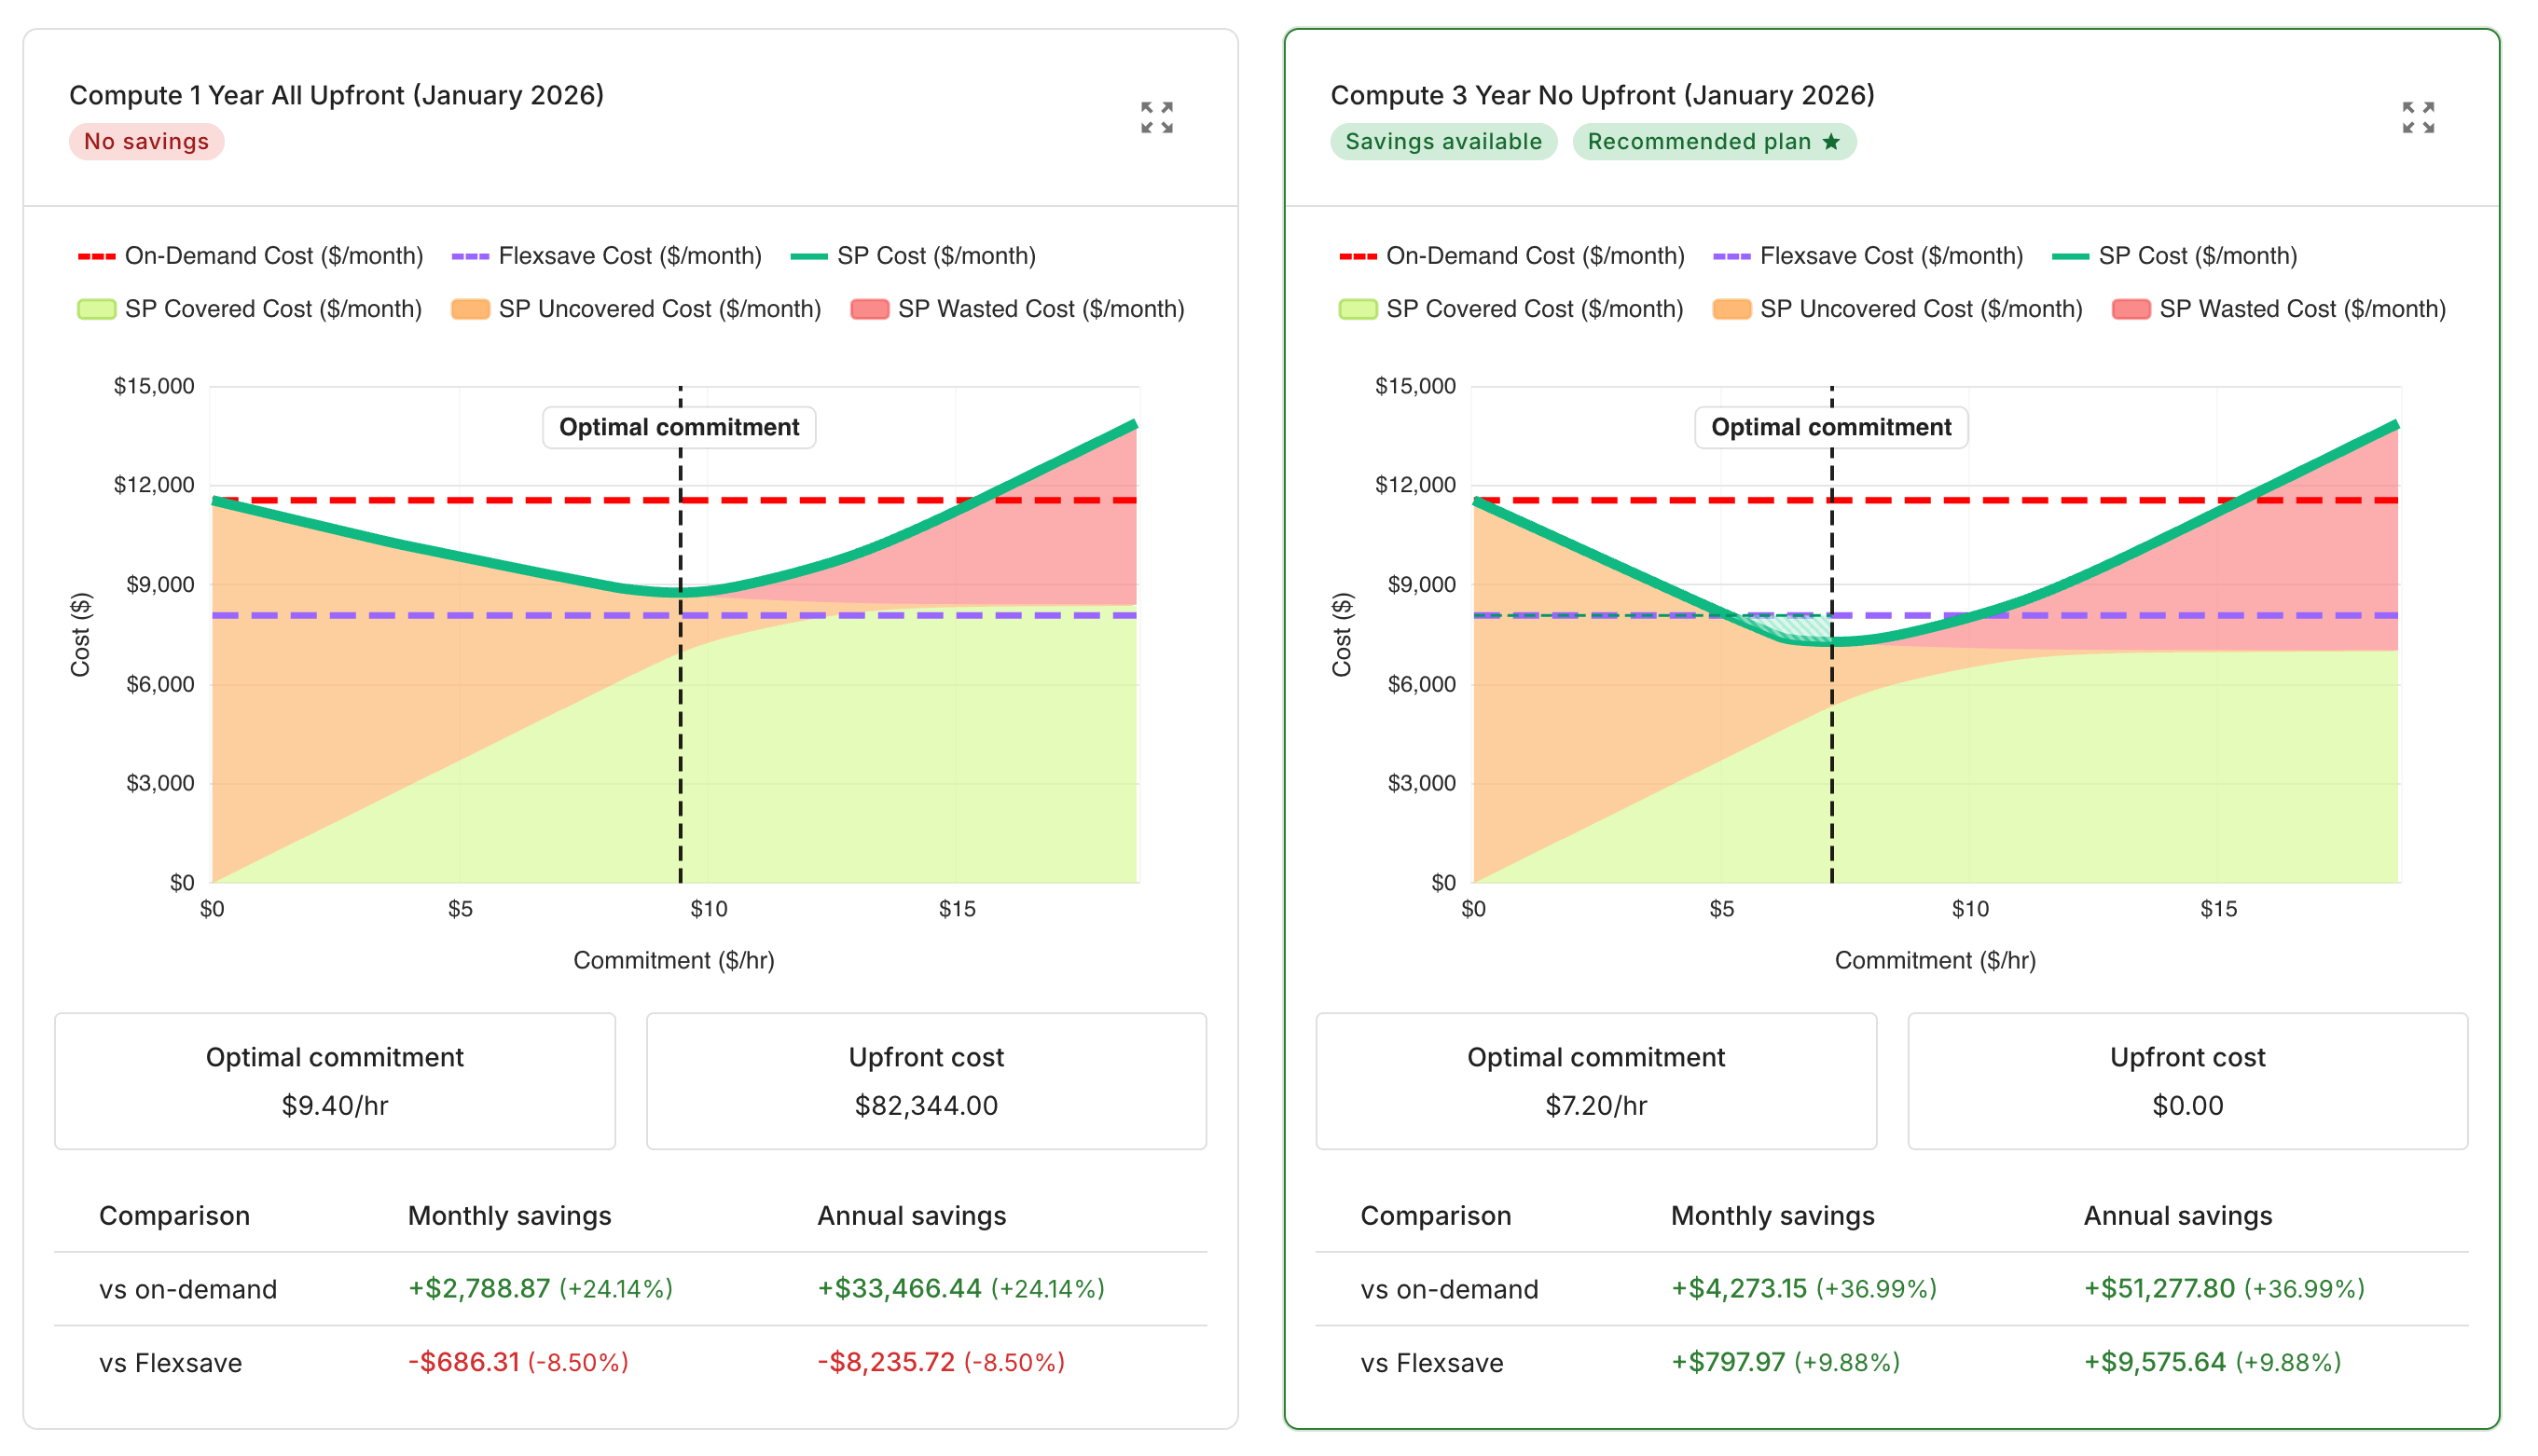
Below the summary table, detailed charts provide further analysis. For each term and payment option, a chart plots the full cost curve, showing how total cost changes as the hourly commitment increases from $0/hr to the point where the Savings Plan costs more than on-demand.
Cost metrics
The analysis charts use the following cost metrics:
| Metric | Description |
|---|---|
| On-Demand Cost | Baseline monthly cost for the eligible usage at full on-demand rates. This is what you would have paid if Flexsave was not active. |
| Flexsave Cost | Monthly cost under DoiT Flexsave. This is what you actually paid for that month with Flexsave (visible only if Flexsave is active). |
| SP Cost | Total cost at a given hourly commitment. This is what you would have paid if you had committed that $/hr. Equals SP Covered + SP Uncovered + SP Wasted. |
| SP Covered Cost | The part of your commitment budget consumed by eligible usage, billed at discounted SP rates instead of on-demand. |
| SP Uncovered Cost | Usage that exceeded what your commitment could cover, charged at full on-demand rates. |
| SP Wasted Cost | Commitment budget that had no usage to cover. |
| Upfront Cost | One-time payment at purchase. See Payment options for the calculation. |
The ideal commitment maximizes SP Covered while keeping SP Uncovered and SP Wasted as low as possible.
In practice, a small amount of uncovered spend is preferable to wasted spend; unused commitment cannot be recovered, while uncovered usage simply stays at the on-demand rate you're already paying.
Cost curve
Each chart answers one question: What would I have paid in the selected month if I had committed $X/hr?
-
The X-axis is the hourly commitment; the Y-axis is the total monthly cost.
-
Green line:
SP Cost. The total monthly cost (SP Covered+SP Uncovered+SP Wasted) at each commitment amount. The lowest point is the optimal commitment. -
Red dashed line:
On-Demand Cost. A flat baseline showing the eligible usage at full on-demand rates, without Flexsave. -
Purple dashed line:
Flexsave Cost. A flat baseline showing what you actually paid with Flexsave active. Visible only if Flexsave is enabled. -
Vertical dashed line: Marks the optimal commitment: the point where
SP Costis the lowest.
Follow the green line on a chart from left to right:
-
At $0/hr, it starts at the red baseline, no commitment, no discount, full on-demand price.
-
As you move right, the line drops, each additional dollar of commitment covers usage at discounted SP rates instead of on-demand.
-
At the vertical dashed line, the line bottoms out. That's the optimal commitment where total cost is lowest.
-
Past the vertical dashed line, the line climbs back up, meaning most savings are already captured and every extra dollar committed is wasted.
The optimal commitment shows what would have been best for the selected month. It is not a purchase recommendation.
Usage patterns might change from month to month, and Savings Plans cannot be canceled. Committing slightly below the optimal captures most of the savings with much less risk. See Understanding the optimal commitment for practical guidance.
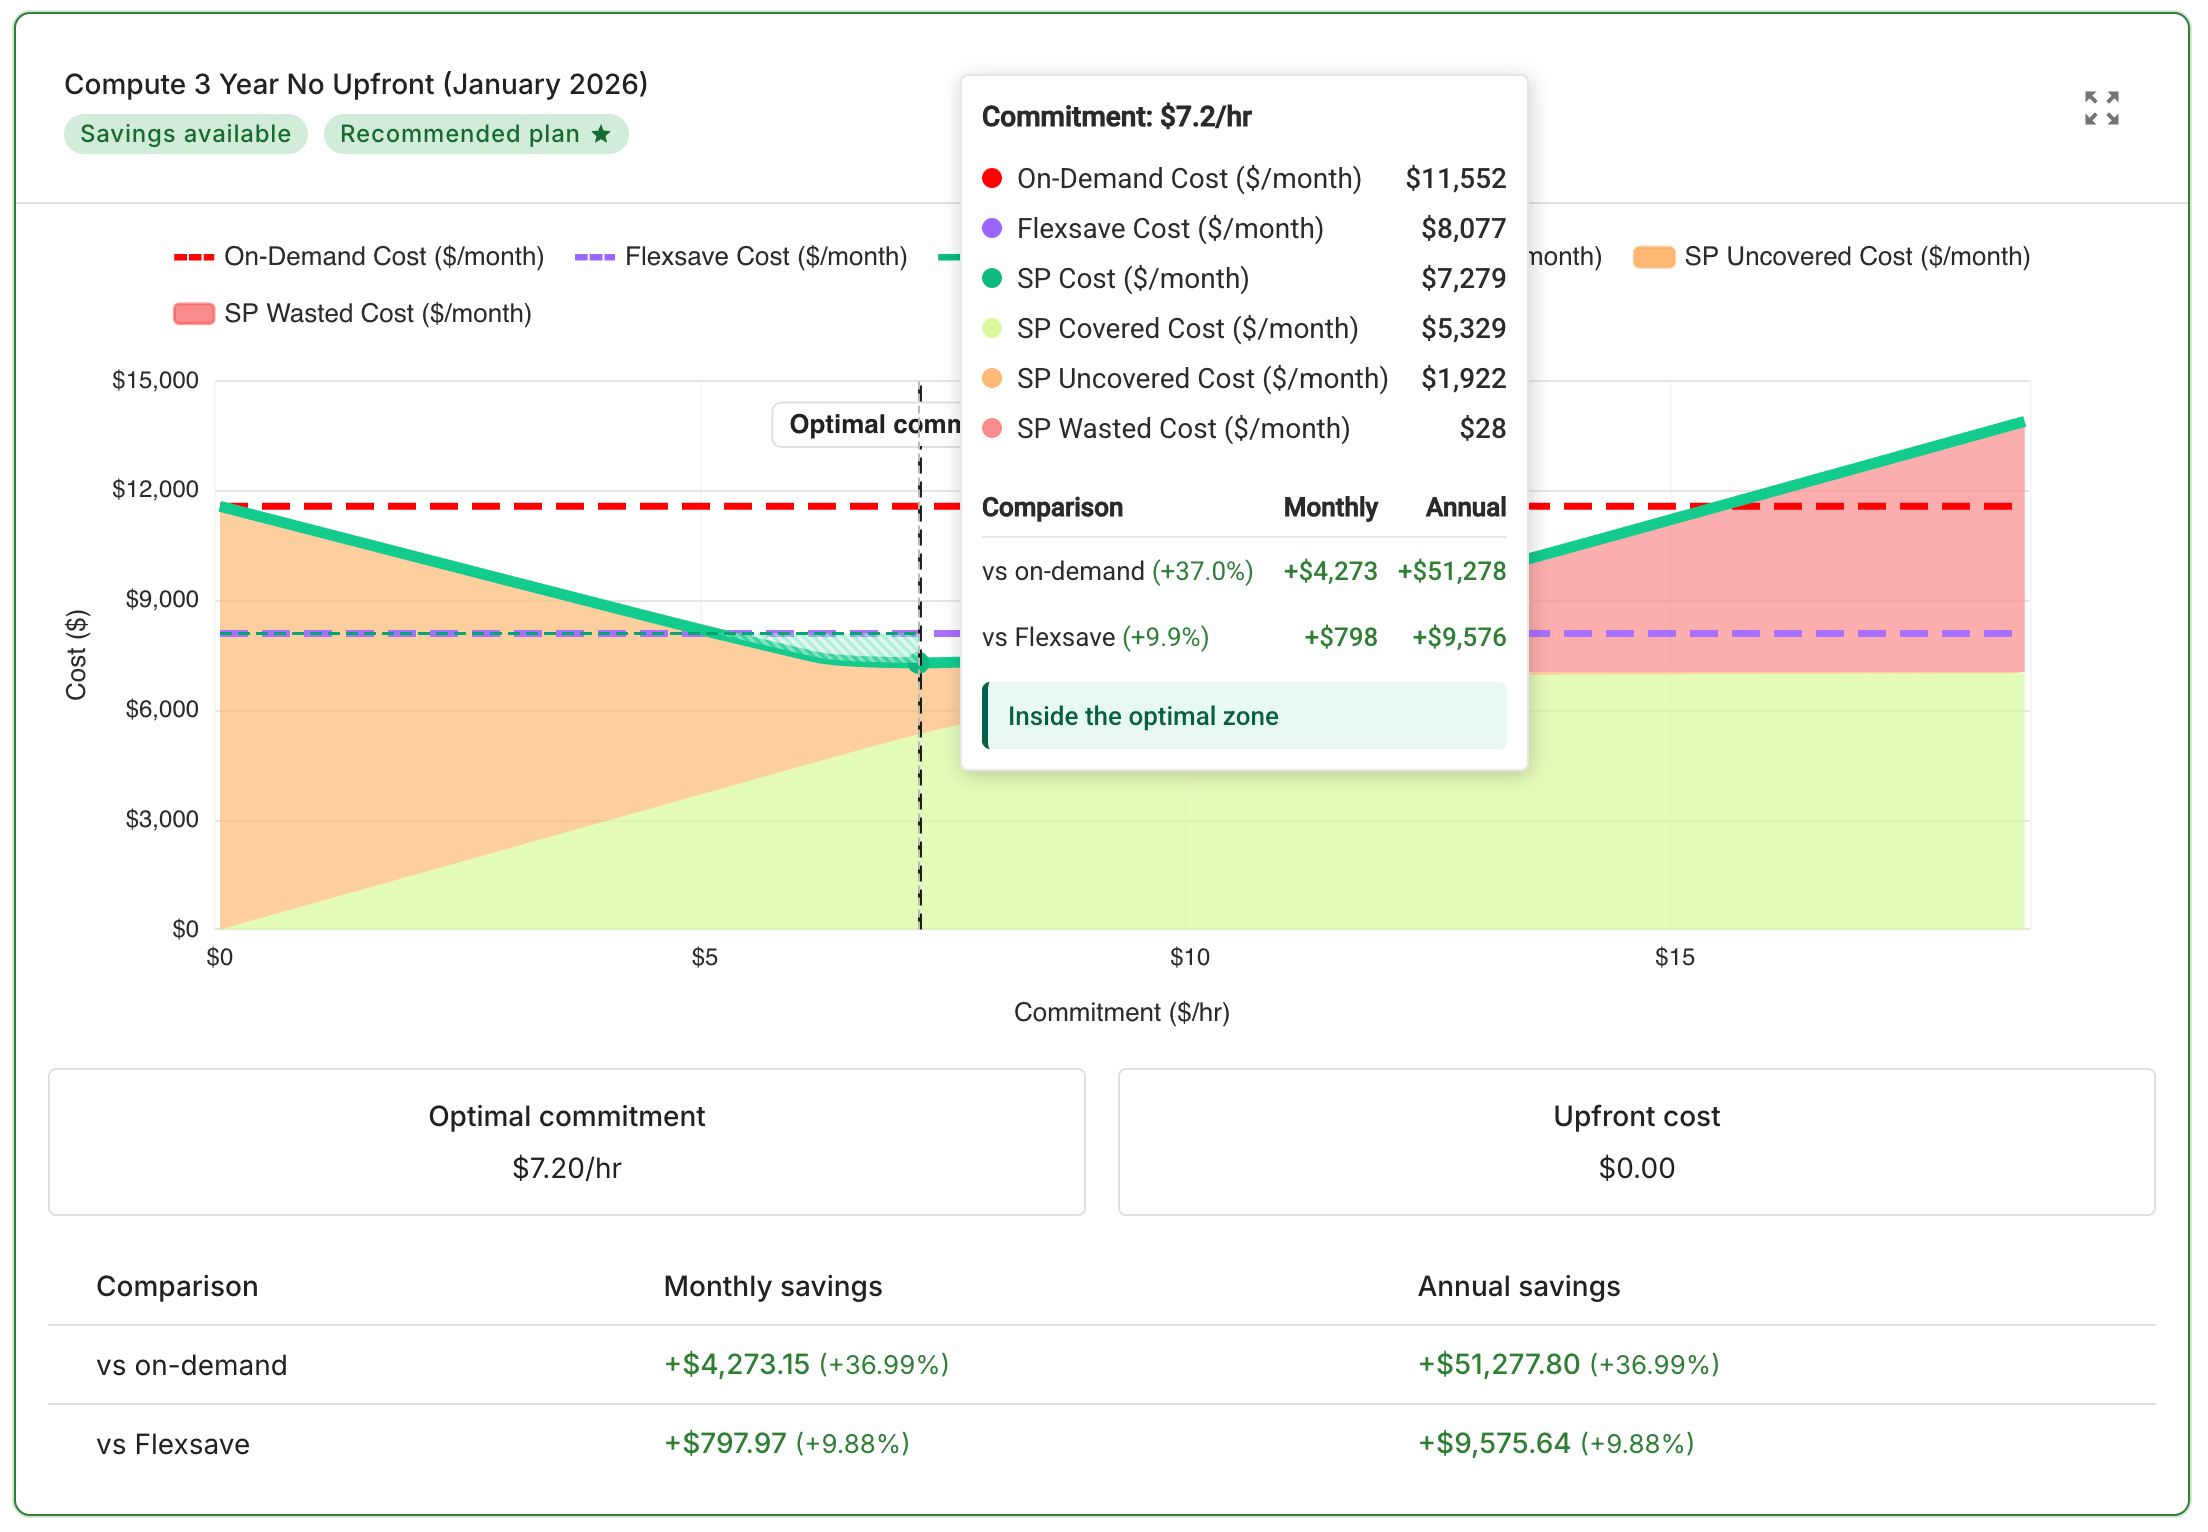
Chart tooltip
Hovering over any point on a chart reveals the exact cost breakdown at that hourly commitment:
-
Dollar and percentage savings versus on-demand
-
Dollar and percentage savings versus Flexsave if applicable
-
Individual cost components (
SP Covered,SP Uncovered,SP Wasted)
Status messages and page states
Commitment Simulator displays a status page instead of the normal analysis when certain conditions apply.
| State | Condition | What to do |
|---|---|---|
| We're compiling your data | Billing data has not been processed yet. | Wait a few hours and check again. The processing is automatic. |
| Your Savings Plans are fully optimized | No hourly commitment across any payer account would reduce costs. | No action needed. Your existing Savings Plans and Reserved Instances already cover the eligible usage, or usage is too low for a commitment. |
| No optimal commitments found | For the selected payer and month, no hourly commitment would reduce costs below on-demand pricing. | Try a different month or payer account. If usage is consistently low, a Savings Plan may not be cost-effective. |