Commitments overview
The Commitments overview gives you visibility into your existing commitments across all payer accounts. If you have enabled both the Compute and Database commitment services, use the All, Compute, and Database tabs to filter data by service type.
Required permissions
- PerfectScale Commitments Admin or PerfectScale Commitments Read Only
Accounts Overview
After initial setup, PerfectScale for Commitments opens to Accounts Overview: a cross-account summary of all configured payer accounts so you can compare performance and optimization opportunities in one place.
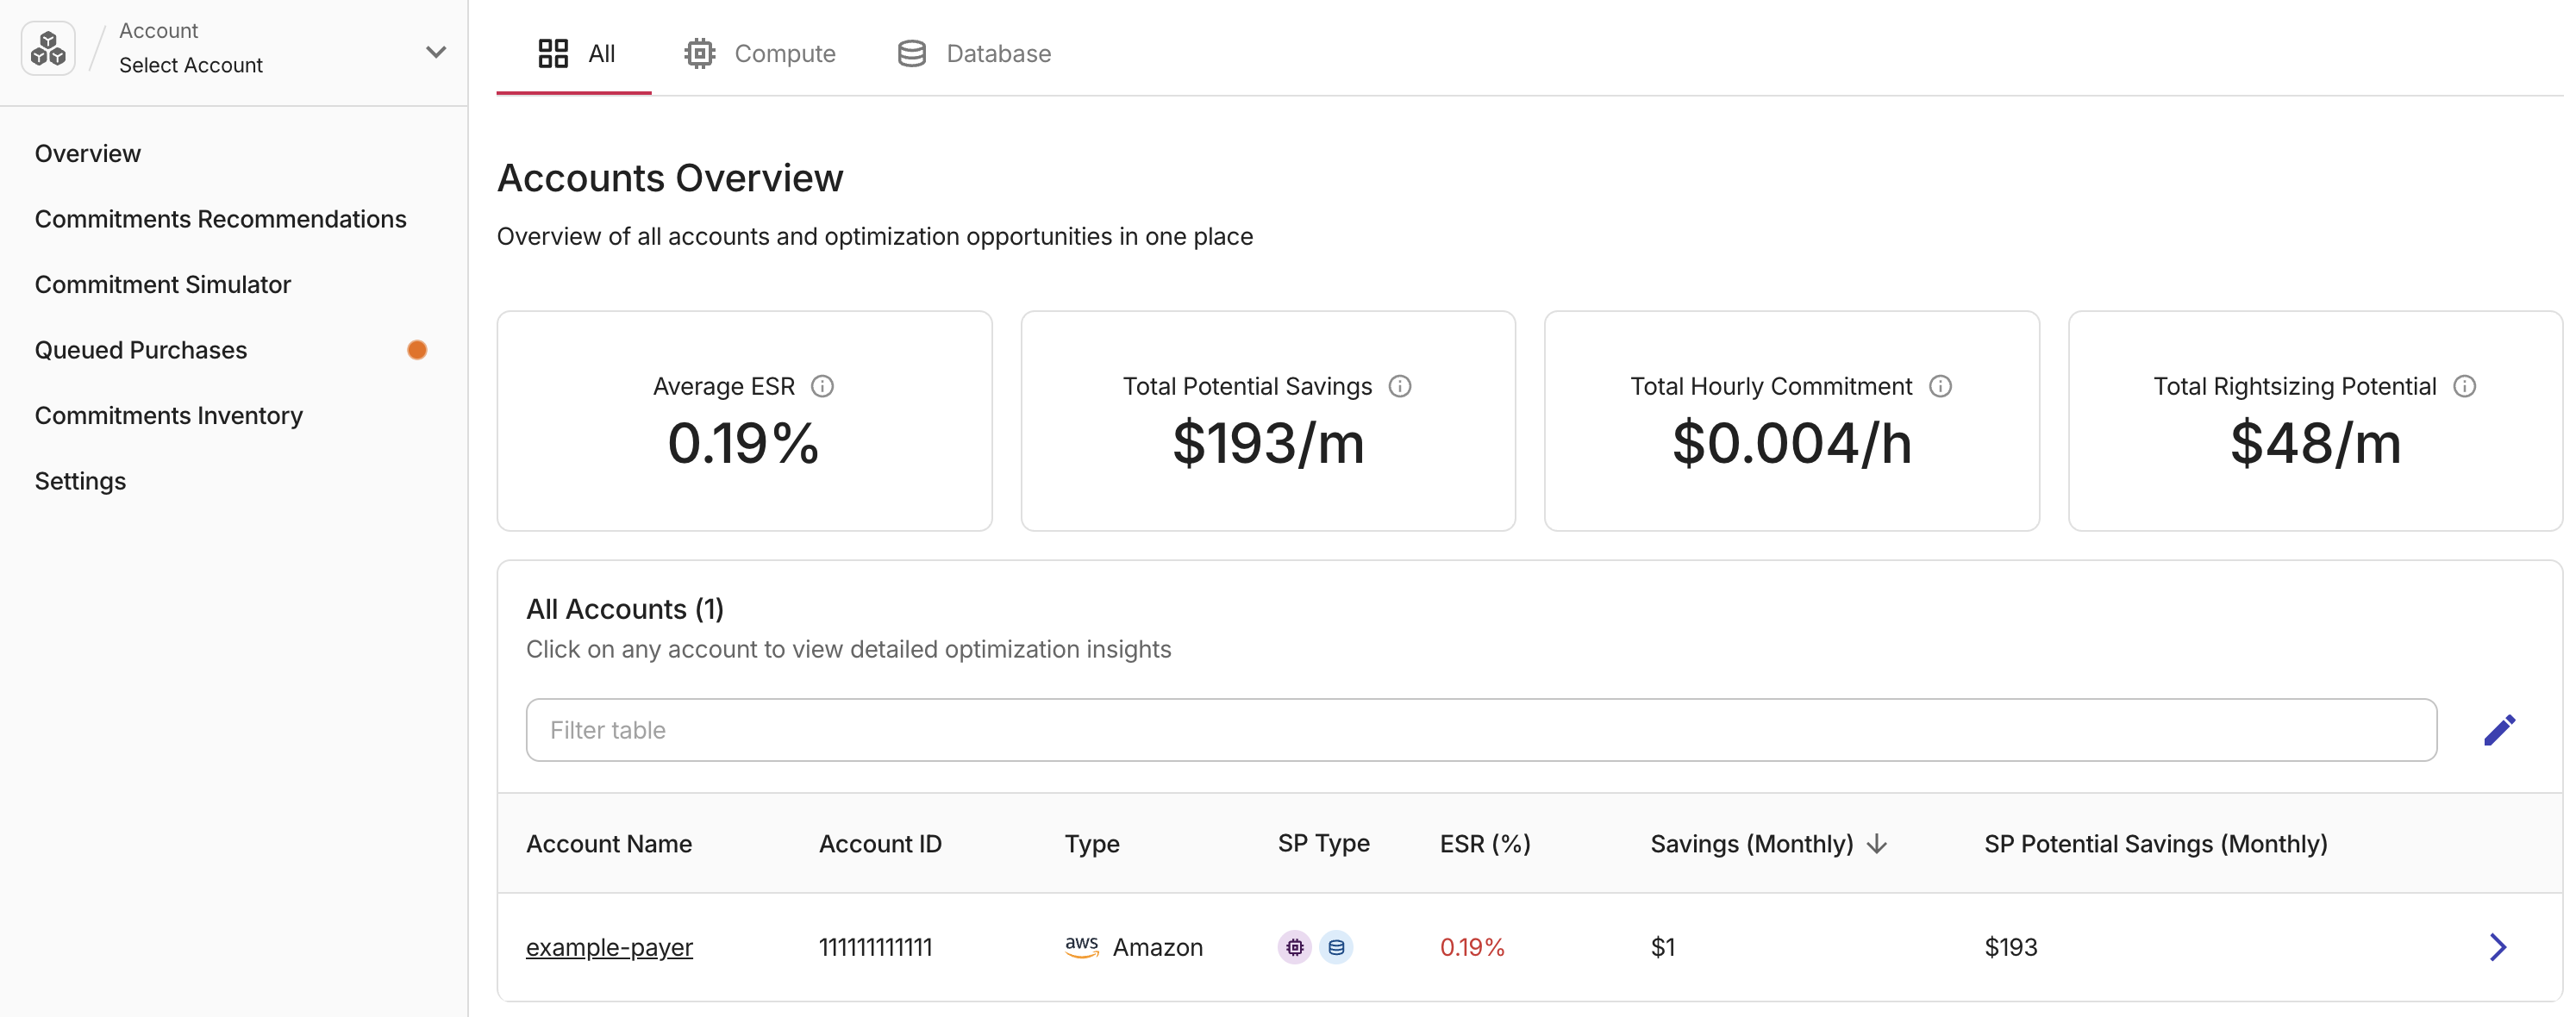
Accounts Overview shows four metric cards with organization-wide totals. These totals are calculated from Active accounts only, see Account status below.
-
Average ESR: The average Effective Savings Rate across all active accounts.
-
Total Potential Savings: Combined monthly savings opportunity across all active accounts from commitment optimizations.
-
Total Hourly Commitment: Total active commitment ($/h) summed across all active accounts.
-
Total Rightsizing Potential: Estimated monthly savings from rightsizing your environment based on actual usage patterns. Select View all Insights to open the Insights page for detailed rightsizing recommendations.
The All accounts table below lists each account with its Status, Account Name, Account ID, Cloud Provider type, Commitment type, Effective Savings Rate (ESR), current monthly savings, and potential monthly savings. Rows are sorted by status (Active first, then Inactive, then Unsupported). Select any row to open that account's individual overview.
To return to Accounts Overview at any time, open the Account menu in the sidebar and select Go to Accounts Overview.
Commitment type icons
Icons in the Type column show which commitment services (Compute, Database) are enabled in PerfectScale for Commitments (colored icons), and which services have usage or commitments detected in your cloud but are not yet enabled (grey icons with +). Hover an icon to see details. To enable a detected type, turn on that commitment service in Settings. If a service has no coverage and the commitment service is not enabled, no icon appears.
Account status
Each payer account has a Status that depends on the account and on the tab you have selected (All, Compute, or Database):
-
Active: The account is enabled for PerfectScale for Commitments for the current view. On All, at least one commitment service (Compute or Database) is enabled. On Compute or Database, that service is enabled for the account.
-
Inactive: On All, the account is not yet enabled for PerfectScale for Commitments (Commitment Simulator only). On Compute or Database, either the account is not configured for the product, or it is enabled for the other service line only.
-
Unsupported: The cloud provider is not yet supported for full commitments management.
Accounts not yet configured
If you select an account that is visible in the Commitment Simulator but not configured for PerfectScale for Commitments, you see a dedicated page that offers Configure account or Commitment Simulator. To run the setup flow, select Configure account and follow Set up PerfectScale for Commitments.
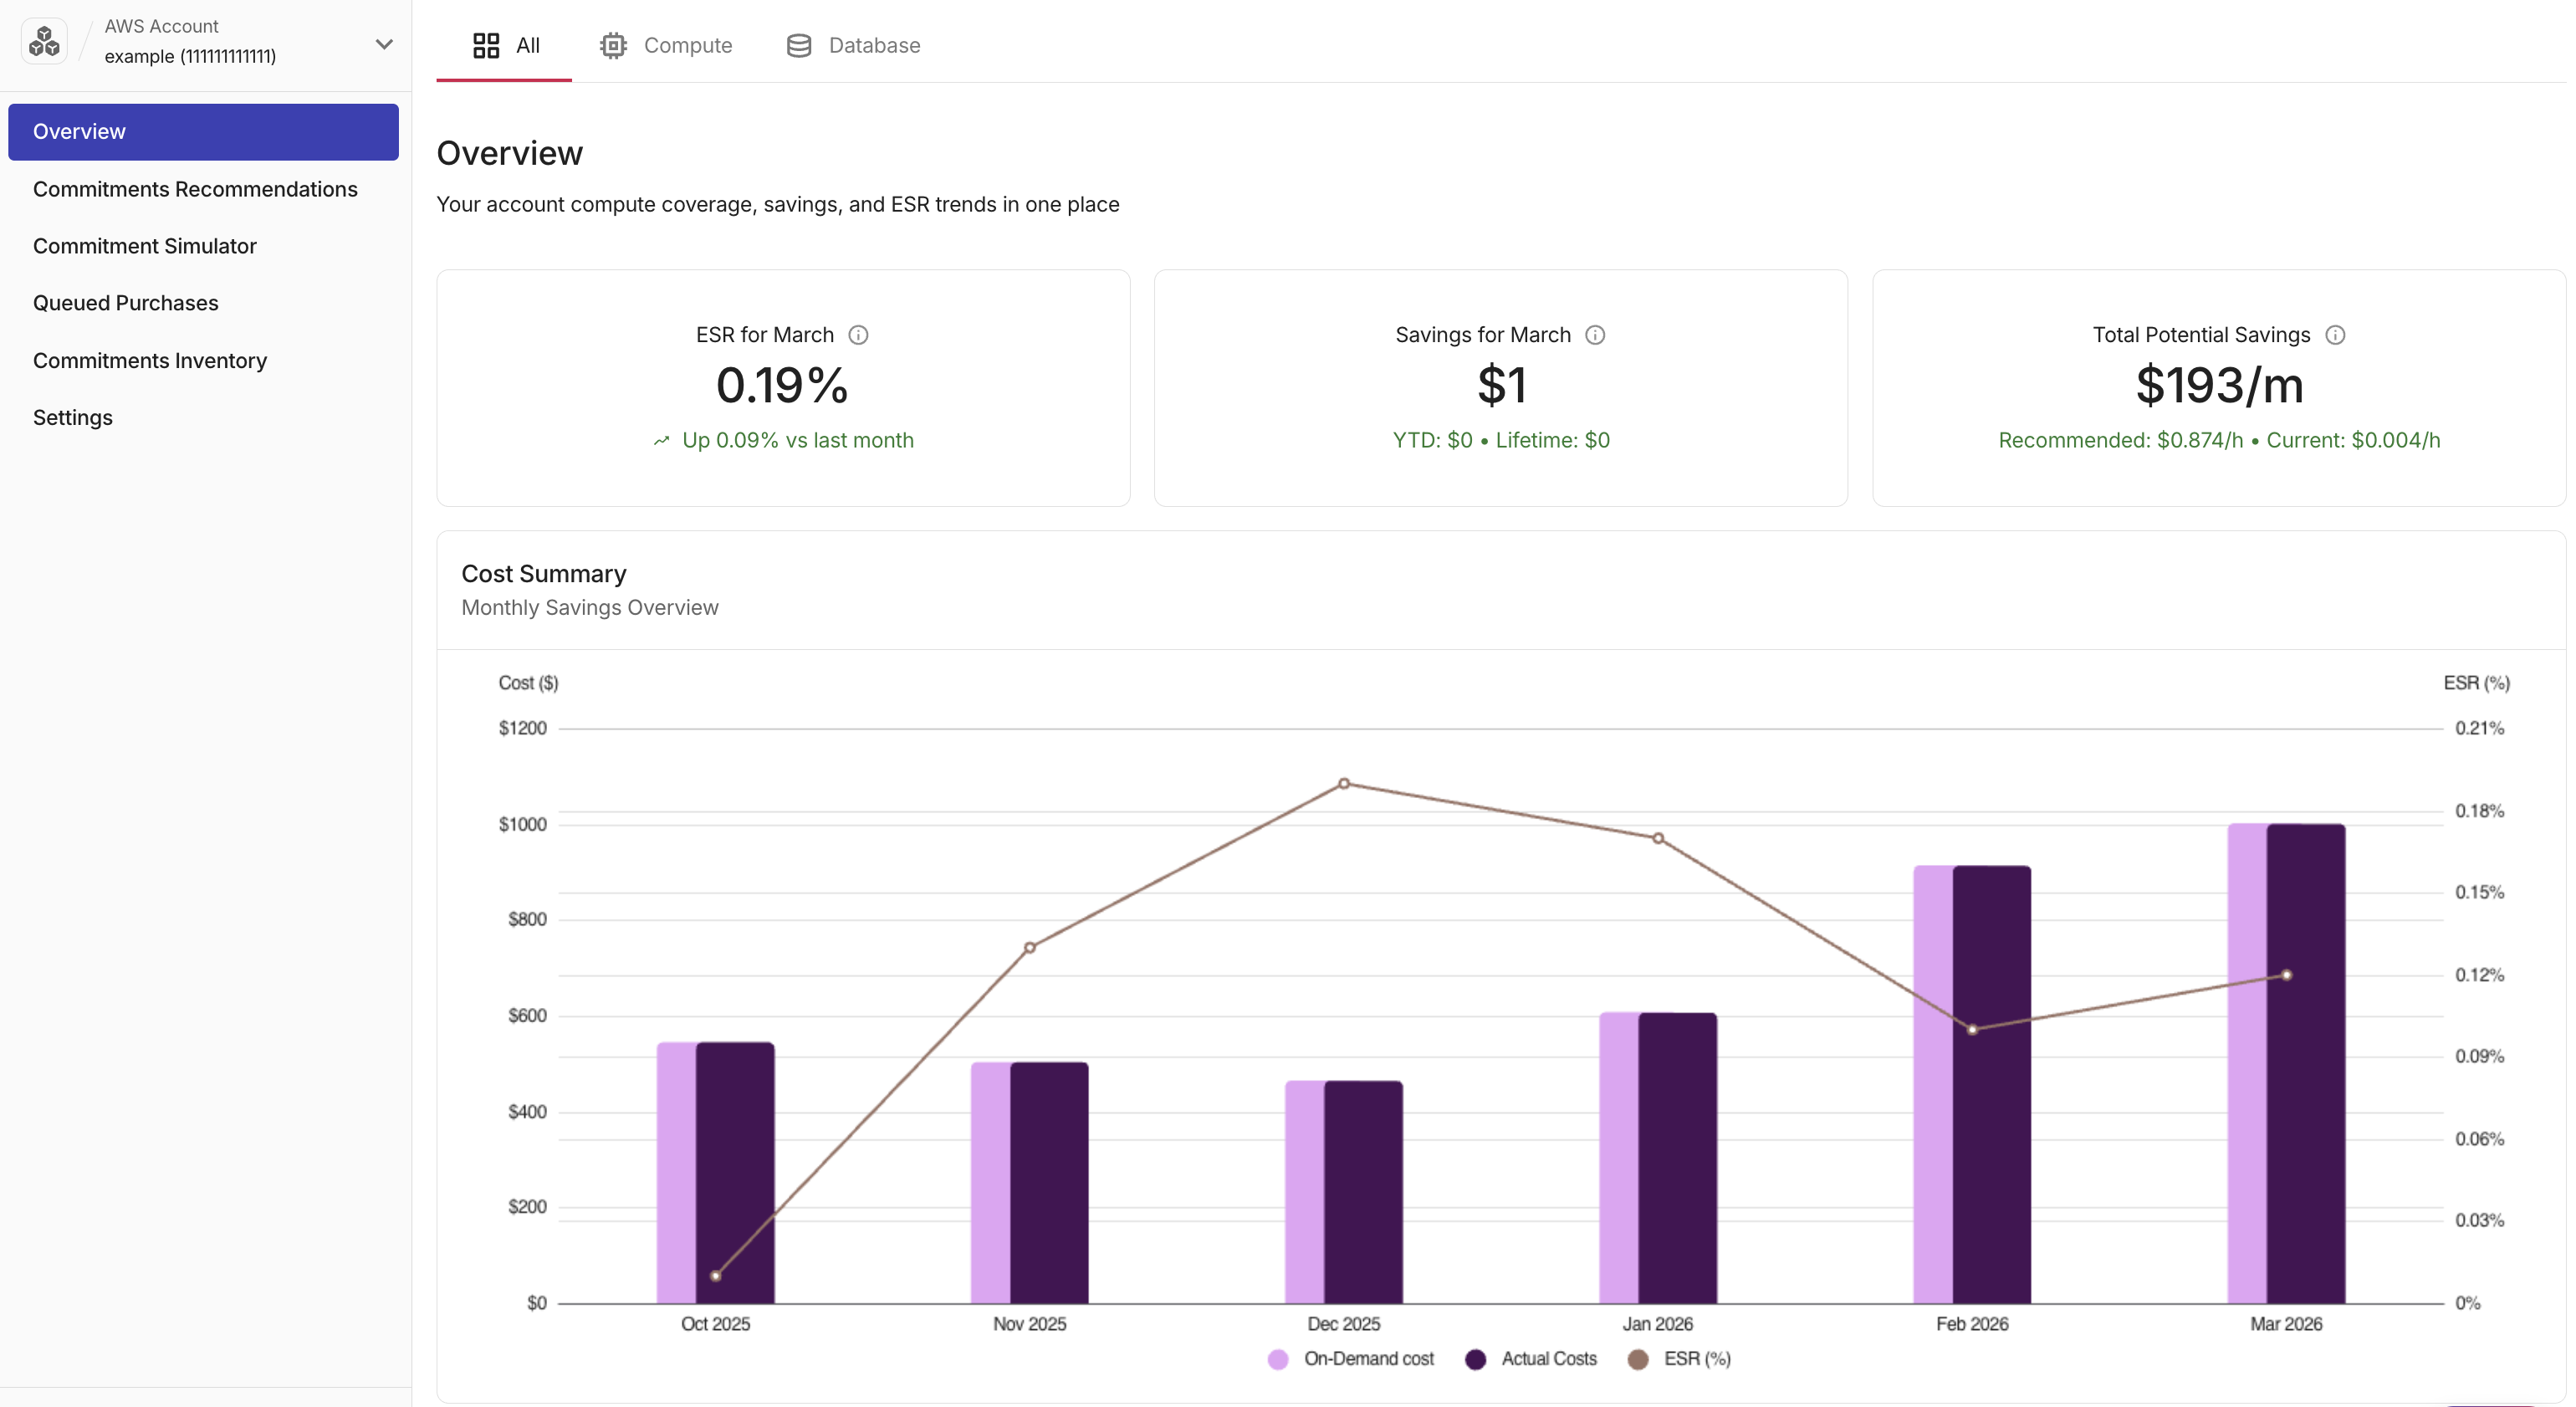
Payer account overview
Selecting a payer account from Accounts Overview opens its Overview tab, which shows coverage, savings, and Effective Savings Rate (ESR) trends for that payer account.
The sidebar shows the selected account, its status, and which commitment services (Compute / Database) are enabled. Use the Account menu to switch accounts.
The sidebar also displays a Lifetime Savings counter at the bottom: total savings accumulated across all accounts since the earliest date your organization was configured for PerfectScale for Commitments.
Effective Savings Rate
Effective Savings Rate (ESR) measures what fraction of your eligible spend is saved through active commitments. A higher ESR means your discounted commitment coverage is well utilized. A declining ESR often signals coverage gaps, underutilized commitments, or a rise in uncovered on-demand spend. On AWS, commitments include Savings Plans and Reserved Instances where applicable.
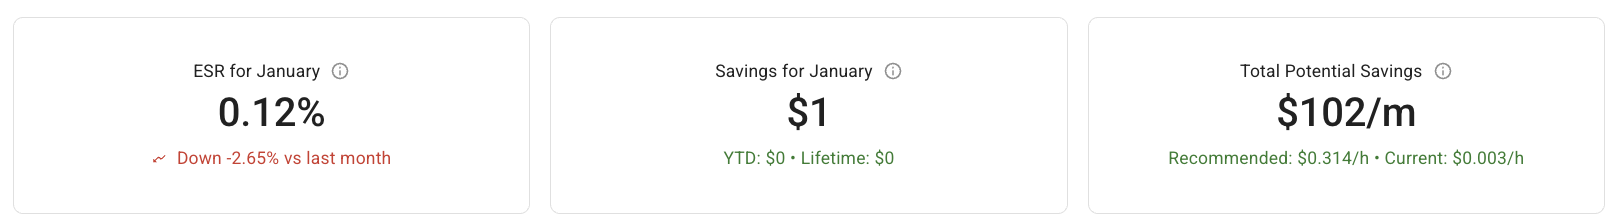
In the three cards at the top of Overview, you can see the account's current state.
-
ESR (%, current month): The account's Effective Savings Rate for the last 30 days, expressed as a percentage. A trend indicator shows how ESR changed compared to the previous month.
-
Savings ($, current month): Total USD savings achieved in the last 30 days, with year-to-date and lifetime totals shown below.
-
Total Potential Savings ($/month): The estimated monthly savings you could unlock by moving from your current to the recommended commitment level. The card displays both the recommended and current $/h rates for comparison.
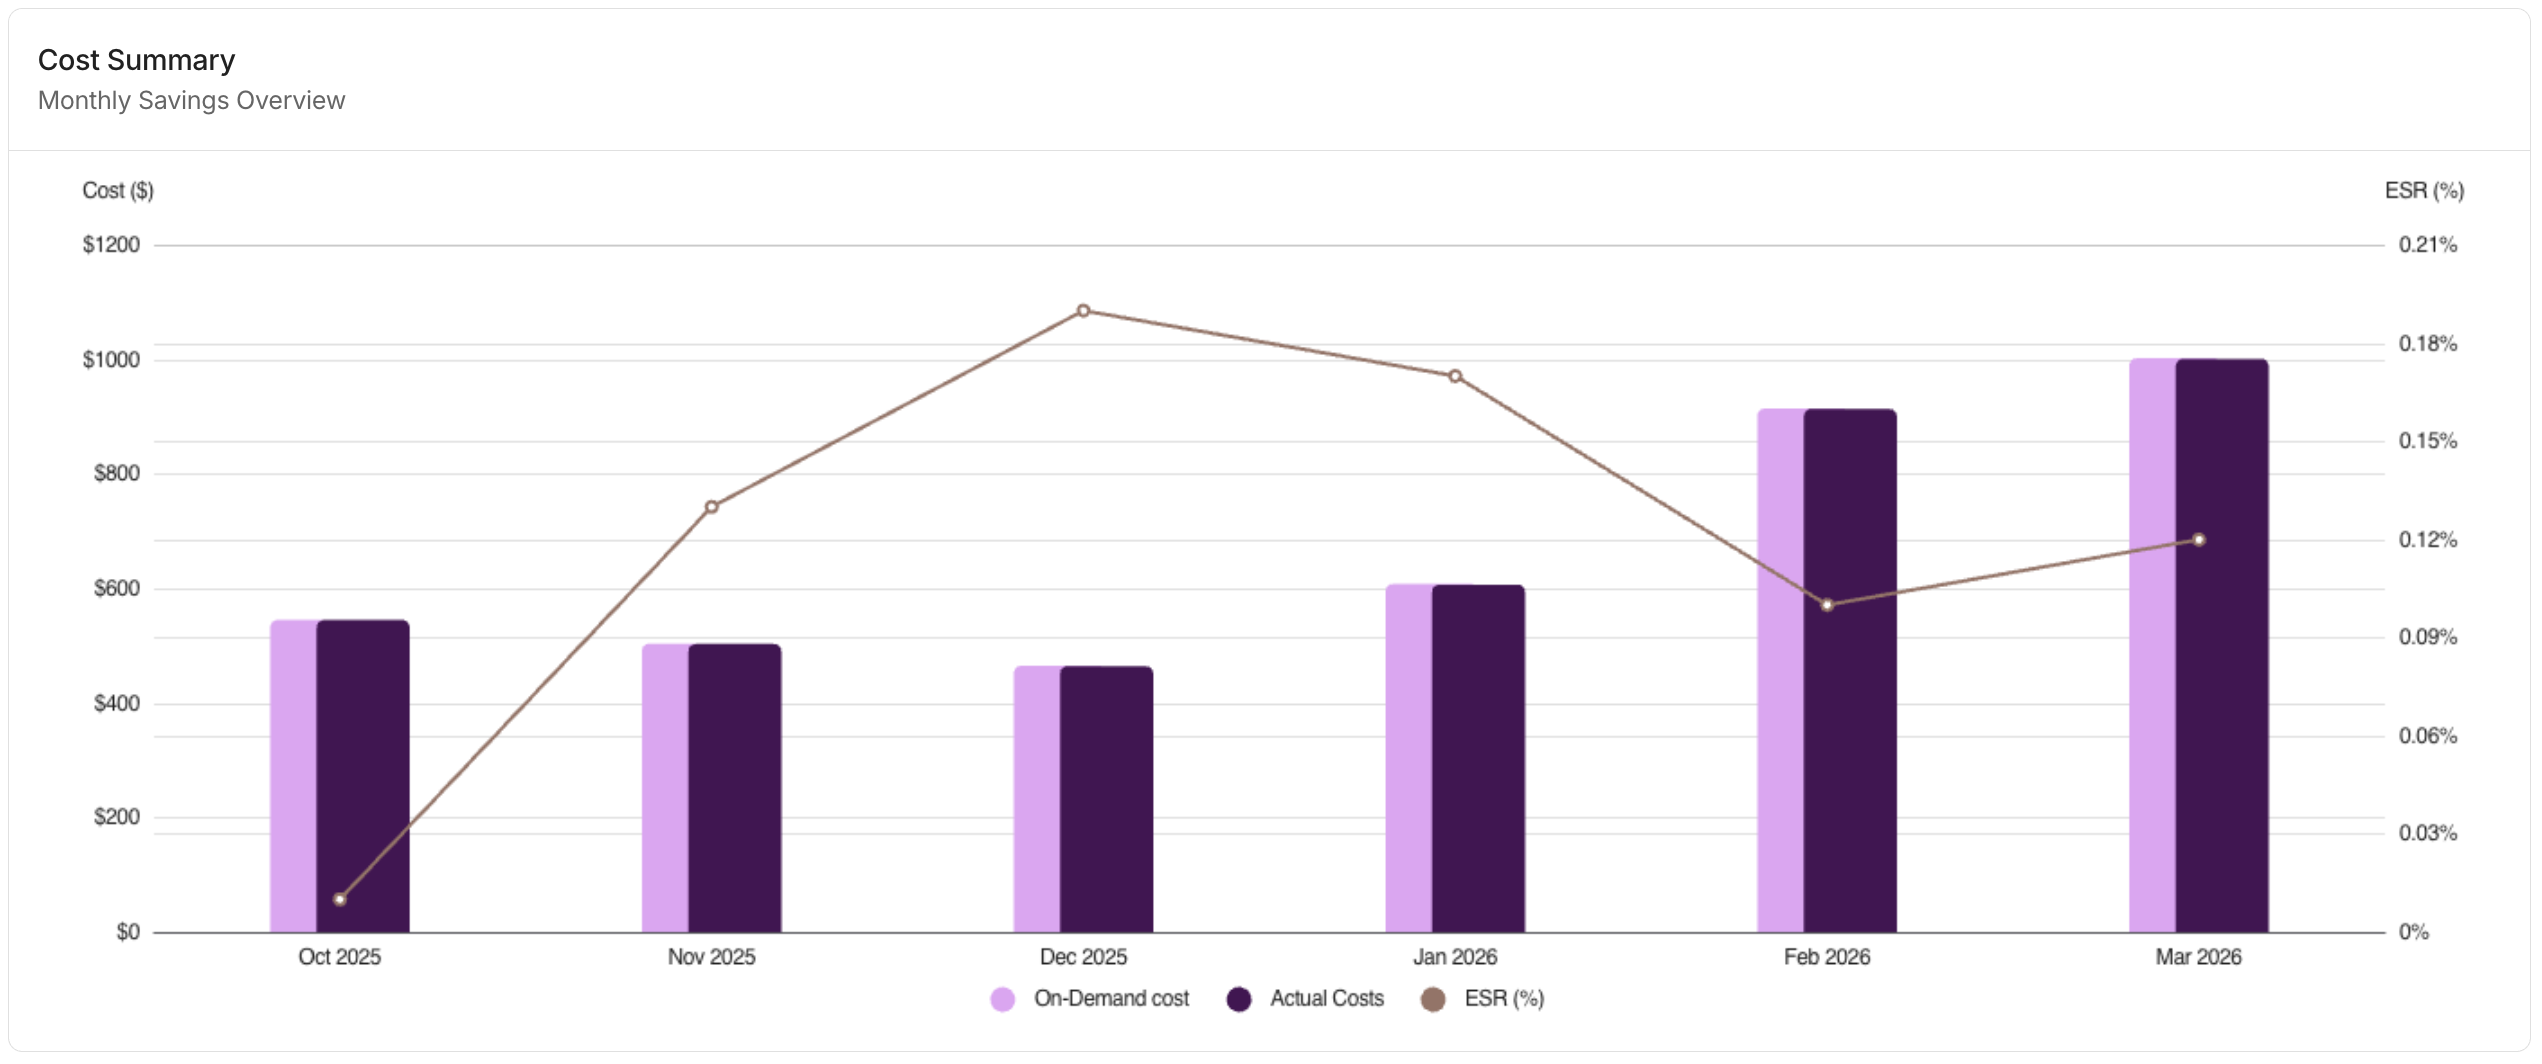
Cost Summary
Cost Summary plots monthly On-Demand cost and cost-with-savings as overlapping bars, with ESR as a line on the secondary axis. Use this chart to see whether your savings rate is improving or declining over time and how it correlates with overall spend.
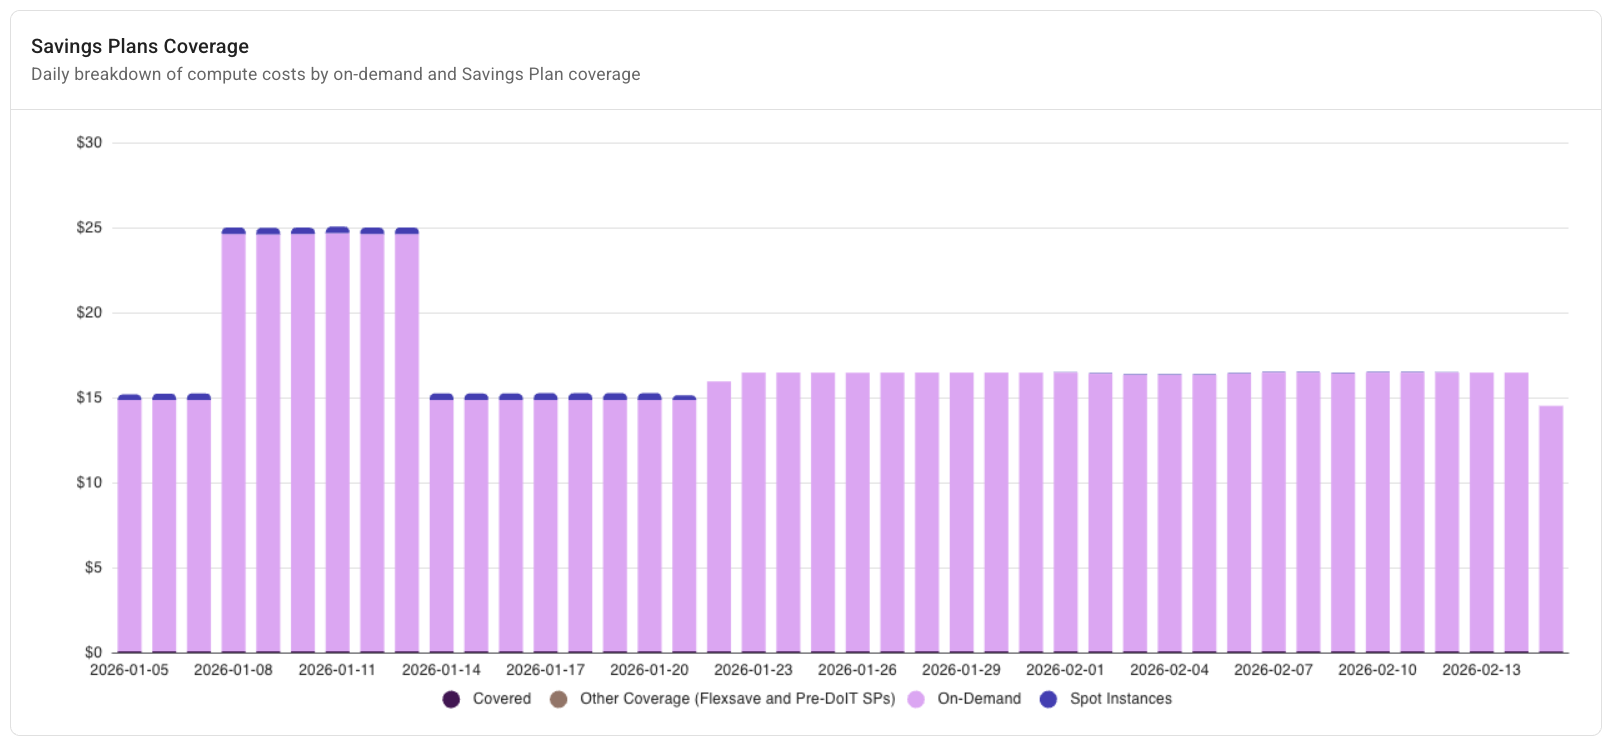
Commitment Coverage
Commitment Coverage shows daily compute spend broken down into the same categories as the chart legend (today implemented for AWS workloads):
-
Covered On-Demand: Spend covered by customer-purchased Savings Plans or Reserved Instances.
-
Flexsave On-Demand Equivalent: Spend covered by DoiT Flexsave Savings Plans or Savings Plans purchased before DoiT management began.
-
Eligible On-Demand: Spend charged at full on-demand rates, not covered by a Savings Plan, Reserved Instance, or Flexsave.
-
Spot Instances: Compute spend served by Spot Instances.
Recommendations use a 60-day analysis of your cost, coverage, and utilization to calculate the commitment level needed to cover eligible on-demand spend.