GitHub Intelligence
GitHub Intelligence helps you understand and optimize your GitHub costs across Actions, Copilot, storage, and Enterprise Cloud licenses. The dashboard consolidates your GitHub billing data into four tabs with preset widgets, so you can track spend by organization, repository, and product.
Required permission
To access GitHub Intelligence, your DoiT account needs the Cloud Analytics Read Only, Cloud Analytics User, or Cloud Analytics Admin permission.
Prerequisites
GitHub Intelligence is available on plans that include it. Without the plan, opening GitHub Intelligence shows an upgrade page.
You also need at least one GitHub connection that is active or paused. Without one, the page invites you to connect GitHub instead of showing data.
The OAuth connection covers everything the dashboard shows: billing data, seat counts, and Copilot activity. The optional DoiT GitHub App does not add data to any card today. Some placeholder cards show an Enable enriched data button when the App is not installed, but installing it does not fill those cards yet. See Cards that are not available yet.
The Copilot activity data needs the connecting GitHub user to hold a role that can read Copilot usage metrics. If it does not, GitHub answers with an error and the Copilot activity cards stay empty. See GitHub roles.
GitHub Intelligence dashboard
The GitHub Intelligence dashboard consists of preset widgets organized into four tabs: Overview, Actions & storage, Copilot, and Repositories.
To access the dashboard, select Dashboards from the top navigation mega menu, and then select GitHub Intelligence under Workloads & Ops in the dashboards list.
If GitHub stops accepting a connection's billing requests, for example because the connecting user is no longer an owner, a banner above the tab content names the connection and asks an organization owner to reconnect it.
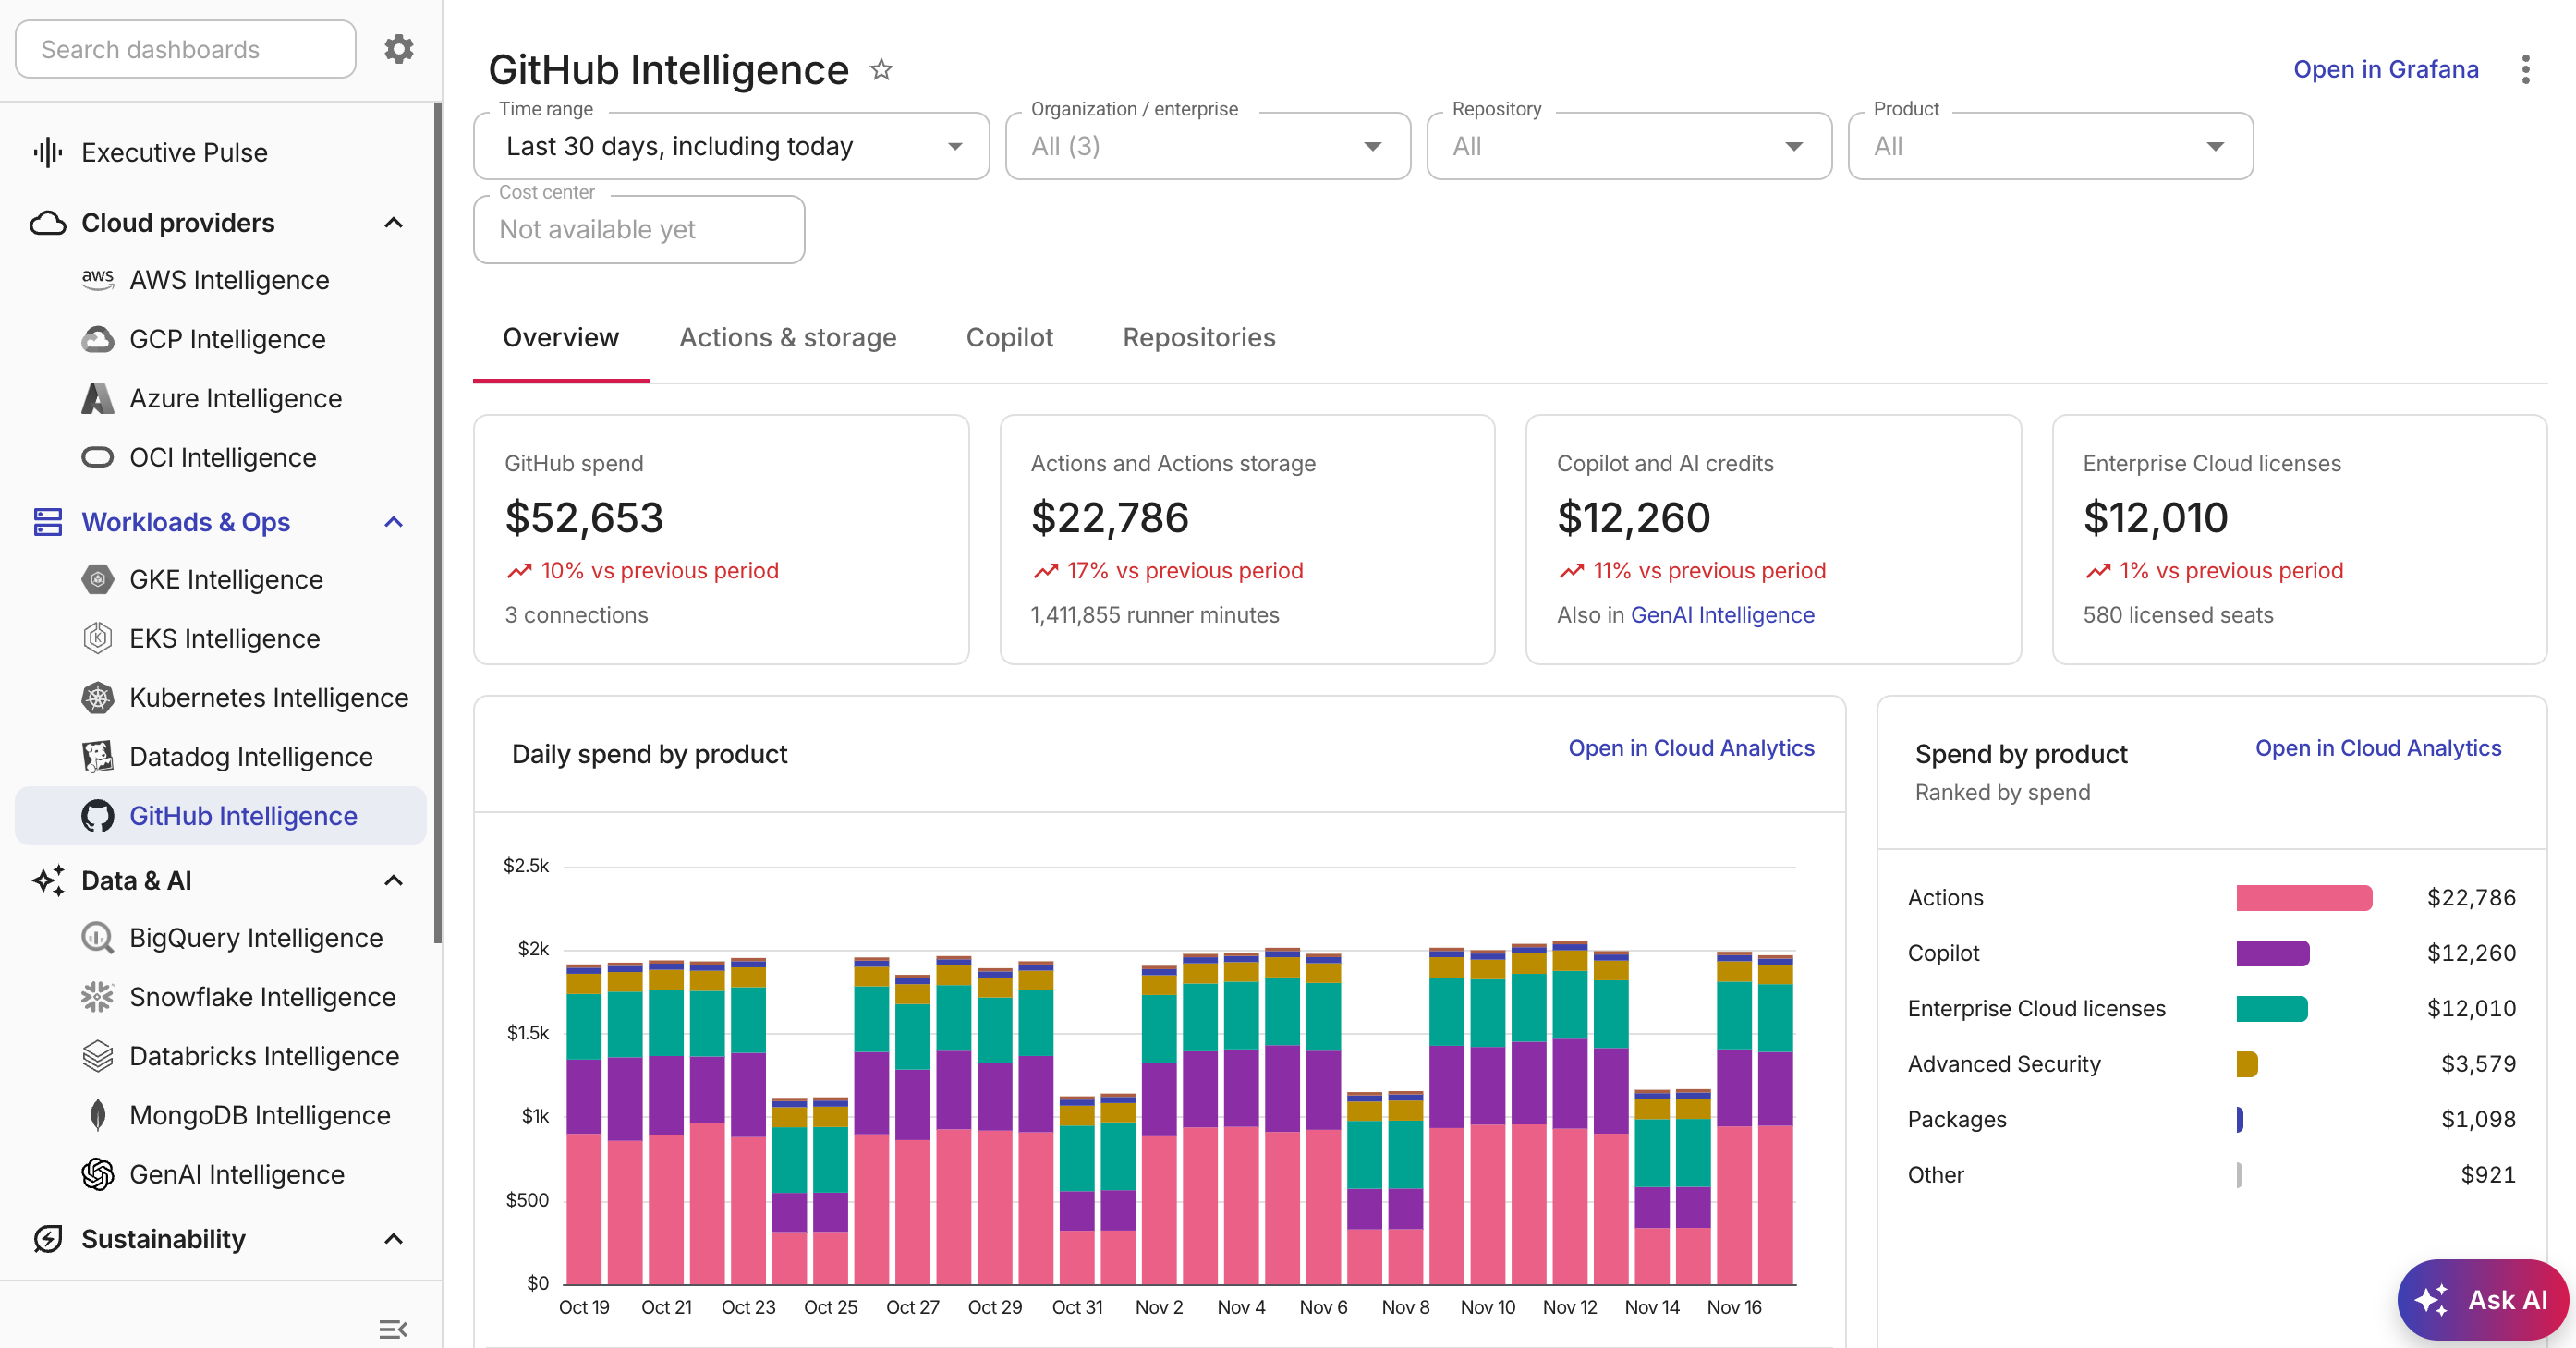
Filters
A filter bar at the top of the dashboard lets you narrow data across all tabs:
-
Time range: The time period for the displayed data. Defaults to the last 30 days, including today.
-
Organization / enterprise: Filter by one or more GitHub organizations or enterprises.
-
Repository: Filter by specific repositories.
-
Product: Filter by GitHub product, such as Actions, Copilot, Packages, Enterprise Cloud licenses, Advanced Security, Code Quality, Codespaces, or Git LFS.
-
Cost center: Shown but disabled, with the value Not available yet. GitHub billing rows do not carry a cost center yet, so there is nothing to filter on.
Apply and Clear appear after you change a filter and while a filter is applied. Select Apply to update the dashboard, or Clear to reset all filters.
When organization, repository, or product filters are applied, two groups of Copilot data are unavailable and the cards show a message asking you to clear the filters: per-user data (users with credits, spend with no user, credits by model family, and the Copilot users table), and activity data (users with activity and adoption by feature). The data sources behind them cannot be filtered by those dimensions.
Overview
The Overview tab provides a high-level summary of your GitHub spend.
KPI cards:
-
GitHub spend: Total GitHub spend for the selected period, with the number of connections and how many of them are stale.
-
Actions and Actions storage: Combined cost of GitHub Actions runner minutes and Actions storage.
-
Copilot and AI credits: Total Copilot and AI credits spend.
-
Enterprise Cloud licenses: License cost with the number of billed seats.
Widgets:
-
Daily spend by product: A stacked chart showing daily spend broken down by product.
-
Spend by product: Products ranked by total spend.
-
Actions minutes by runner: A table of runner types (Linux, Windows, macOS) with minutes and cost.
-
Top repositories by Actions and storage: The top repositories by combined Actions and storage cost.
-
Connections: A summary of each GitHub connection showing its name, scope (organization or enterprise), last data date, and GitHub App installation status.
Actions & storage
The Actions & storage tab focuses on GitHub Actions runner usage and storage costs.
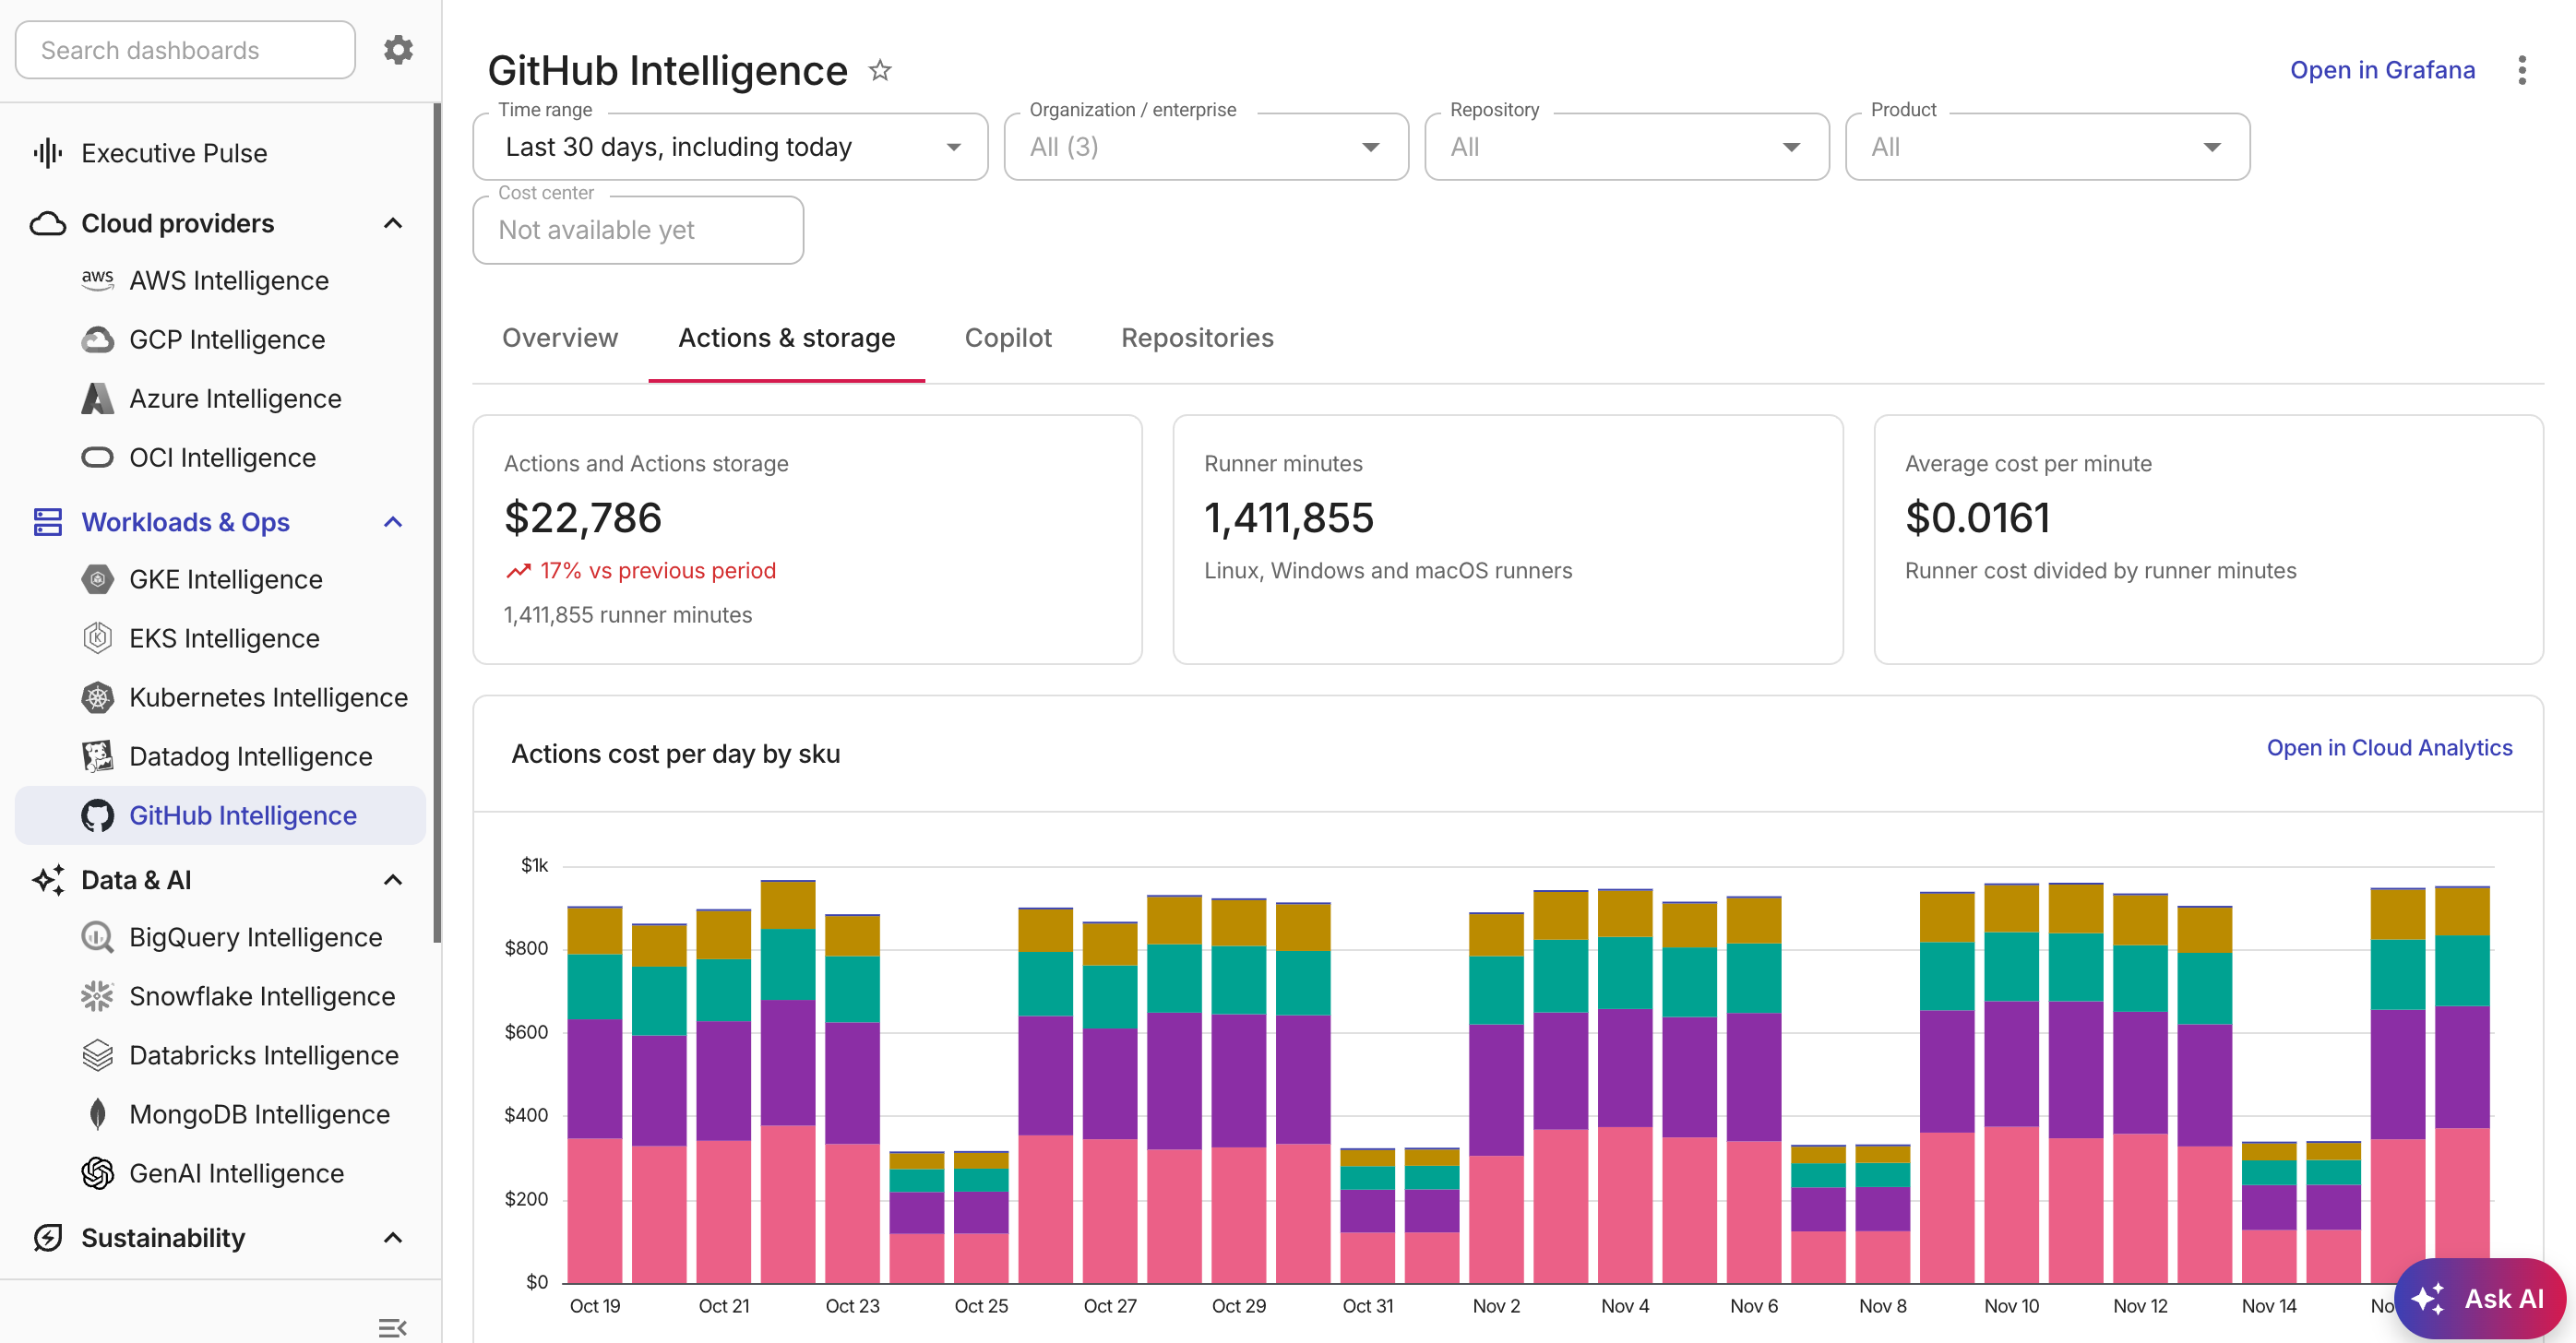
KPI cards:
-
Actions and Actions storage: Combined Actions and storage spend.
-
Runner minutes: Total runner minutes across Linux, Windows, and macOS runners.
-
Average cost per minute: Runner cost divided by total runner minutes.
Widgets:
-
Actions cost per day by sku: A stacked chart of daily Actions spend broken down by runner type.
-
Actions minutes by runner: A table of runner types with minutes, cost, and cost per minute.
-
Actions minutes by organization: A table showing Actions minutes and cost per organization.
-
Storage by repository: Repositories ranked by storage cost.
Copilot
The Copilot tab provides visibility into Copilot spend, seat usage, per-user credits, and feature adoption. If none of your connected organizations has Copilot spend or activity in the selected period, the tab shows a single No Copilot spend in this period message instead.
The Users with credits, Spend with no user, Credits by model family, and Copilot users cards are built from per-user Copilot credits. Until those are published to your account, the cards show a waiting message, such as Waits on per-user Copilot credits, in place of data.
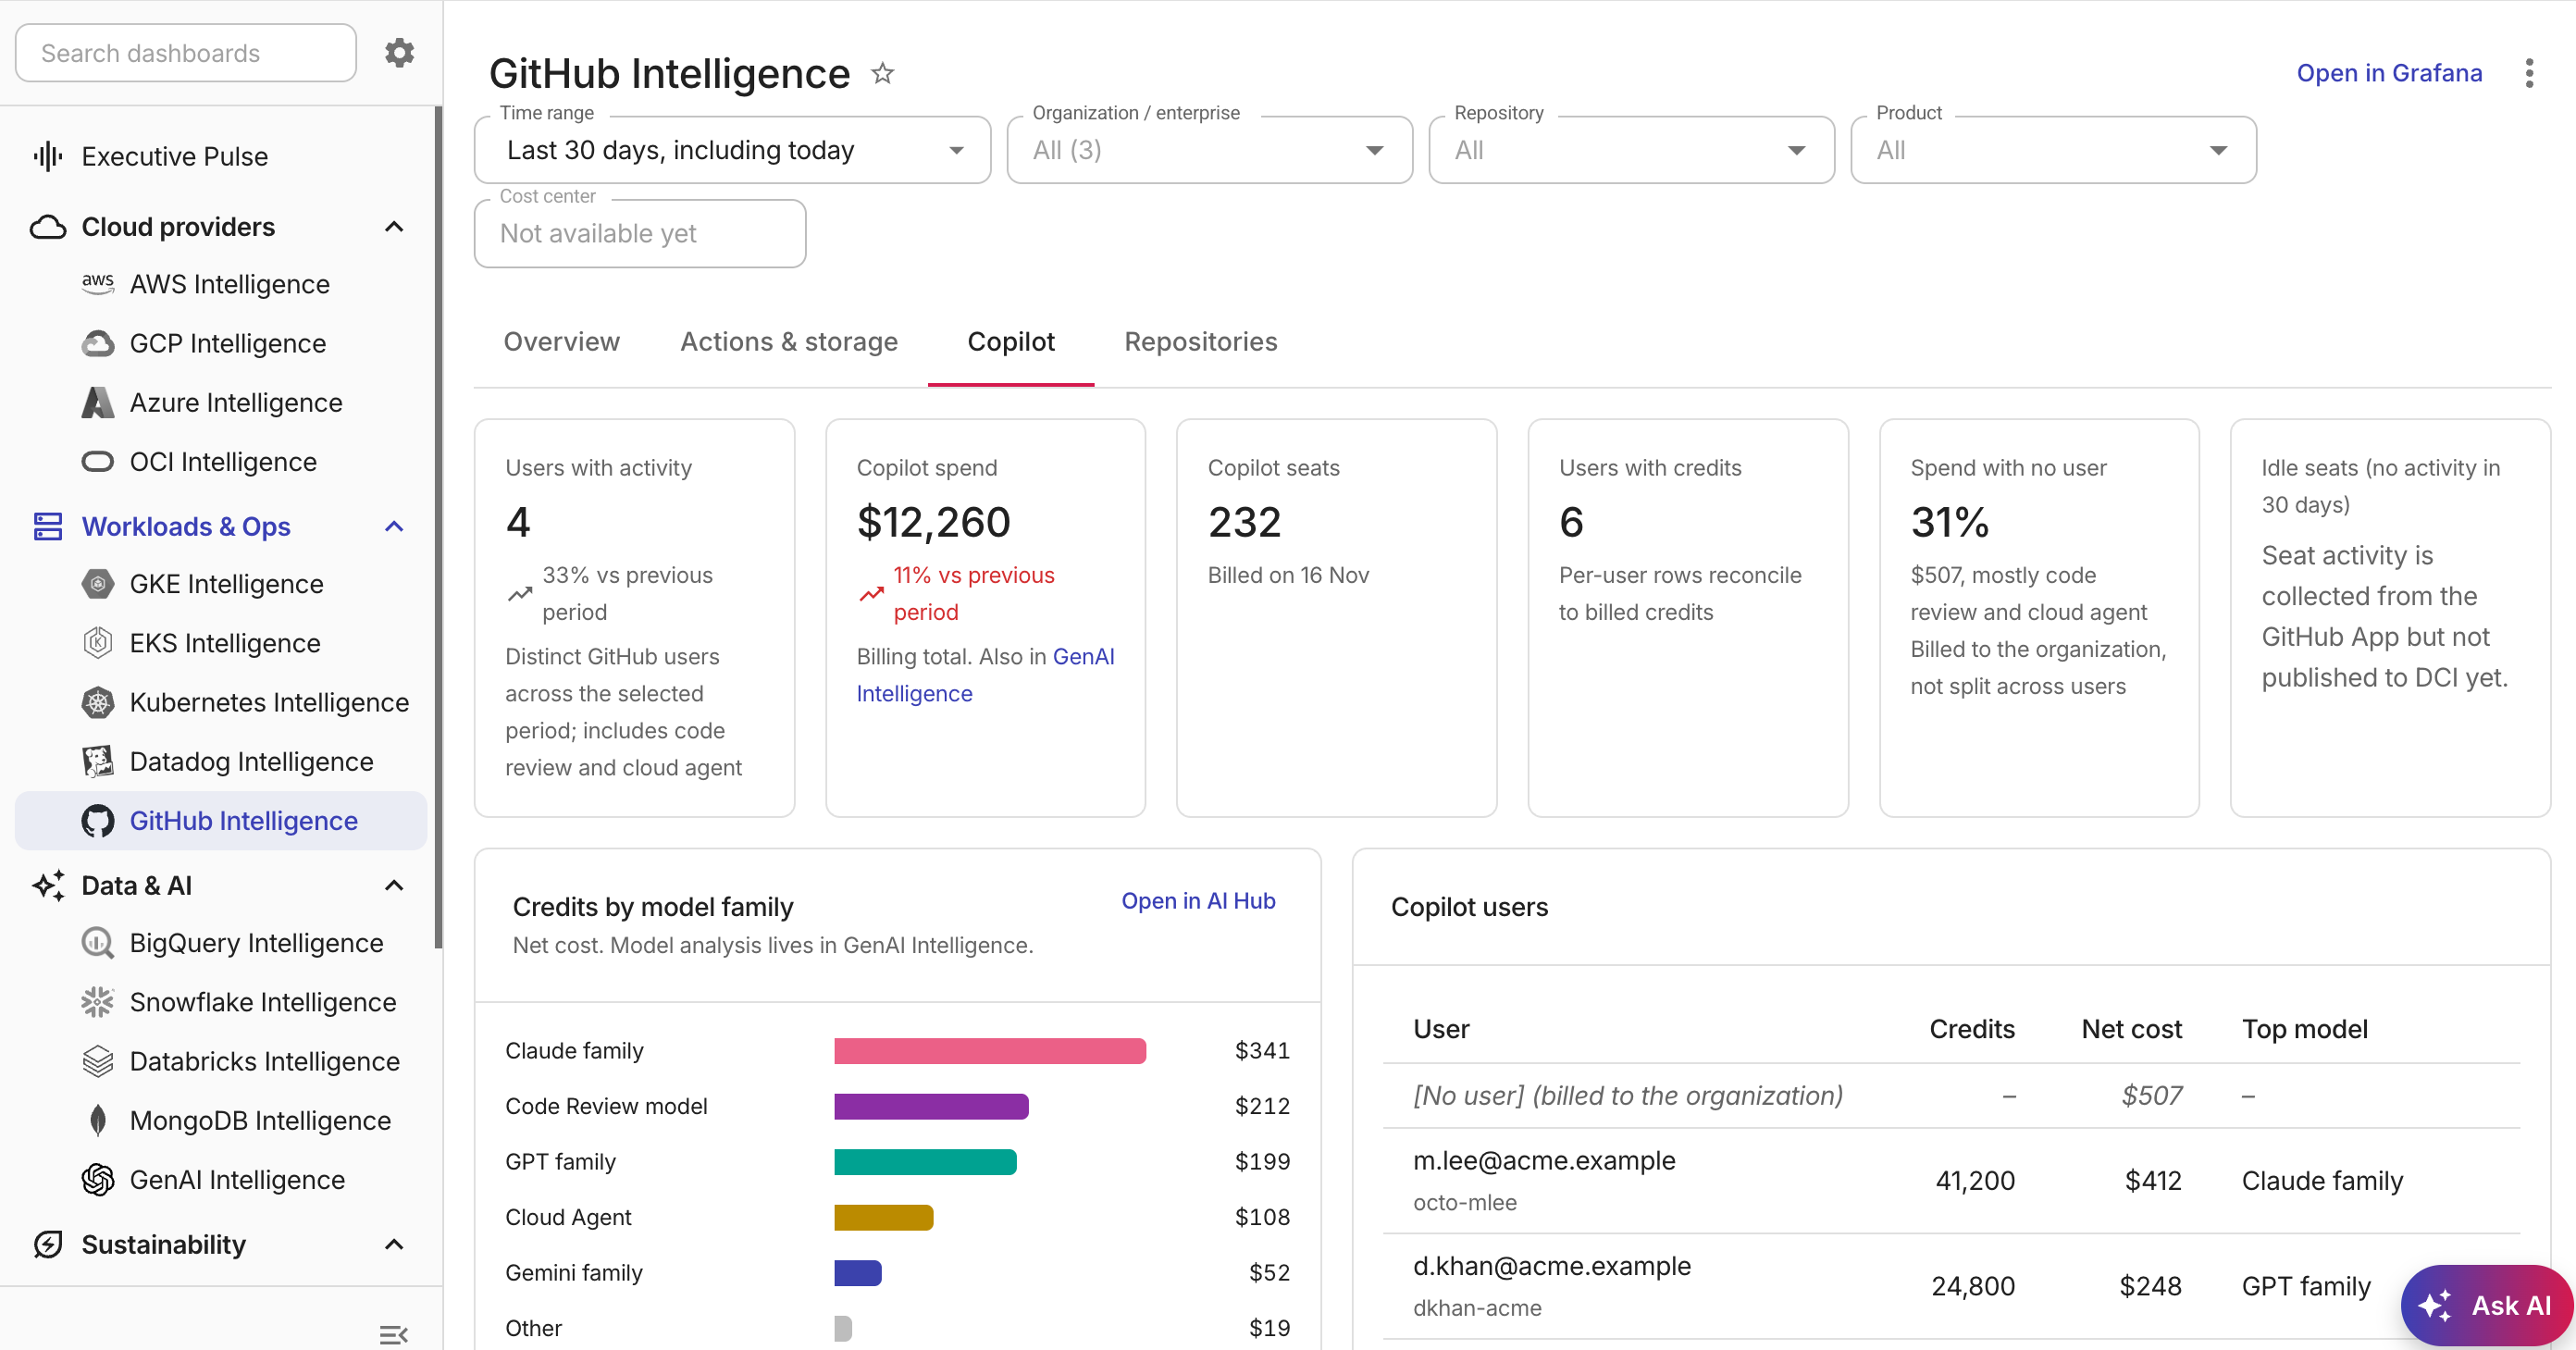
KPI cards:
-
Users with activity: The number of distinct GitHub users with Copilot activity in the selected period, including code review and cloud agent usage.
-
Copilot spend: Total Copilot billing cost.
-
Copilot seats: The number of Copilot Business and Enterprise seats billed on the last complete billing day. Shows no value, with the message No seat plan, AI credits only, when the organization is on AI credits only.
-
Users with credits: Users with per-user credit rows that reconcile to billed credits.
-
Spend with no user: The share of Copilot cost billed to the organization rather than to individual users, with the amount. This is mostly code review and cloud agent usage.
Widgets:
-
Credits by model family: The top model families ranked by net Copilot credit cost.
-
Copilot users: A table of individual users with their credits, net cost, and top model used. Users appear as GitHub logins. When your GitHub organization has verified domains, the table shows each user's work email on those domains instead, and a banner on the tab says when no emails could be matched.
-
Copilot spend per day: A stacked chart of daily Copilot spend by SKU.
-
Copilot spend by organization: Organizations ranked by Copilot spend.
-
Copilot spend by repository: Repositories ranked by Copilot spend.
-
Adoption by feature: A chart showing Copilot adoption across features such as Chat, IDE agent, CLI, code completion, cloud agent, and code review.
-
GenAI Intelligence: Copilot spend also appears in the GenAI Intelligence dashboard alongside other AI provider costs. For model-level analysis, use GenAI Intelligence.
-
AI Hub: When AI Hub is available on your account, the Copilot cards link to its Providers page.
Repositories
The Repositories tab shows cost breakdowns by repository and organization, with period-over-period comparison.
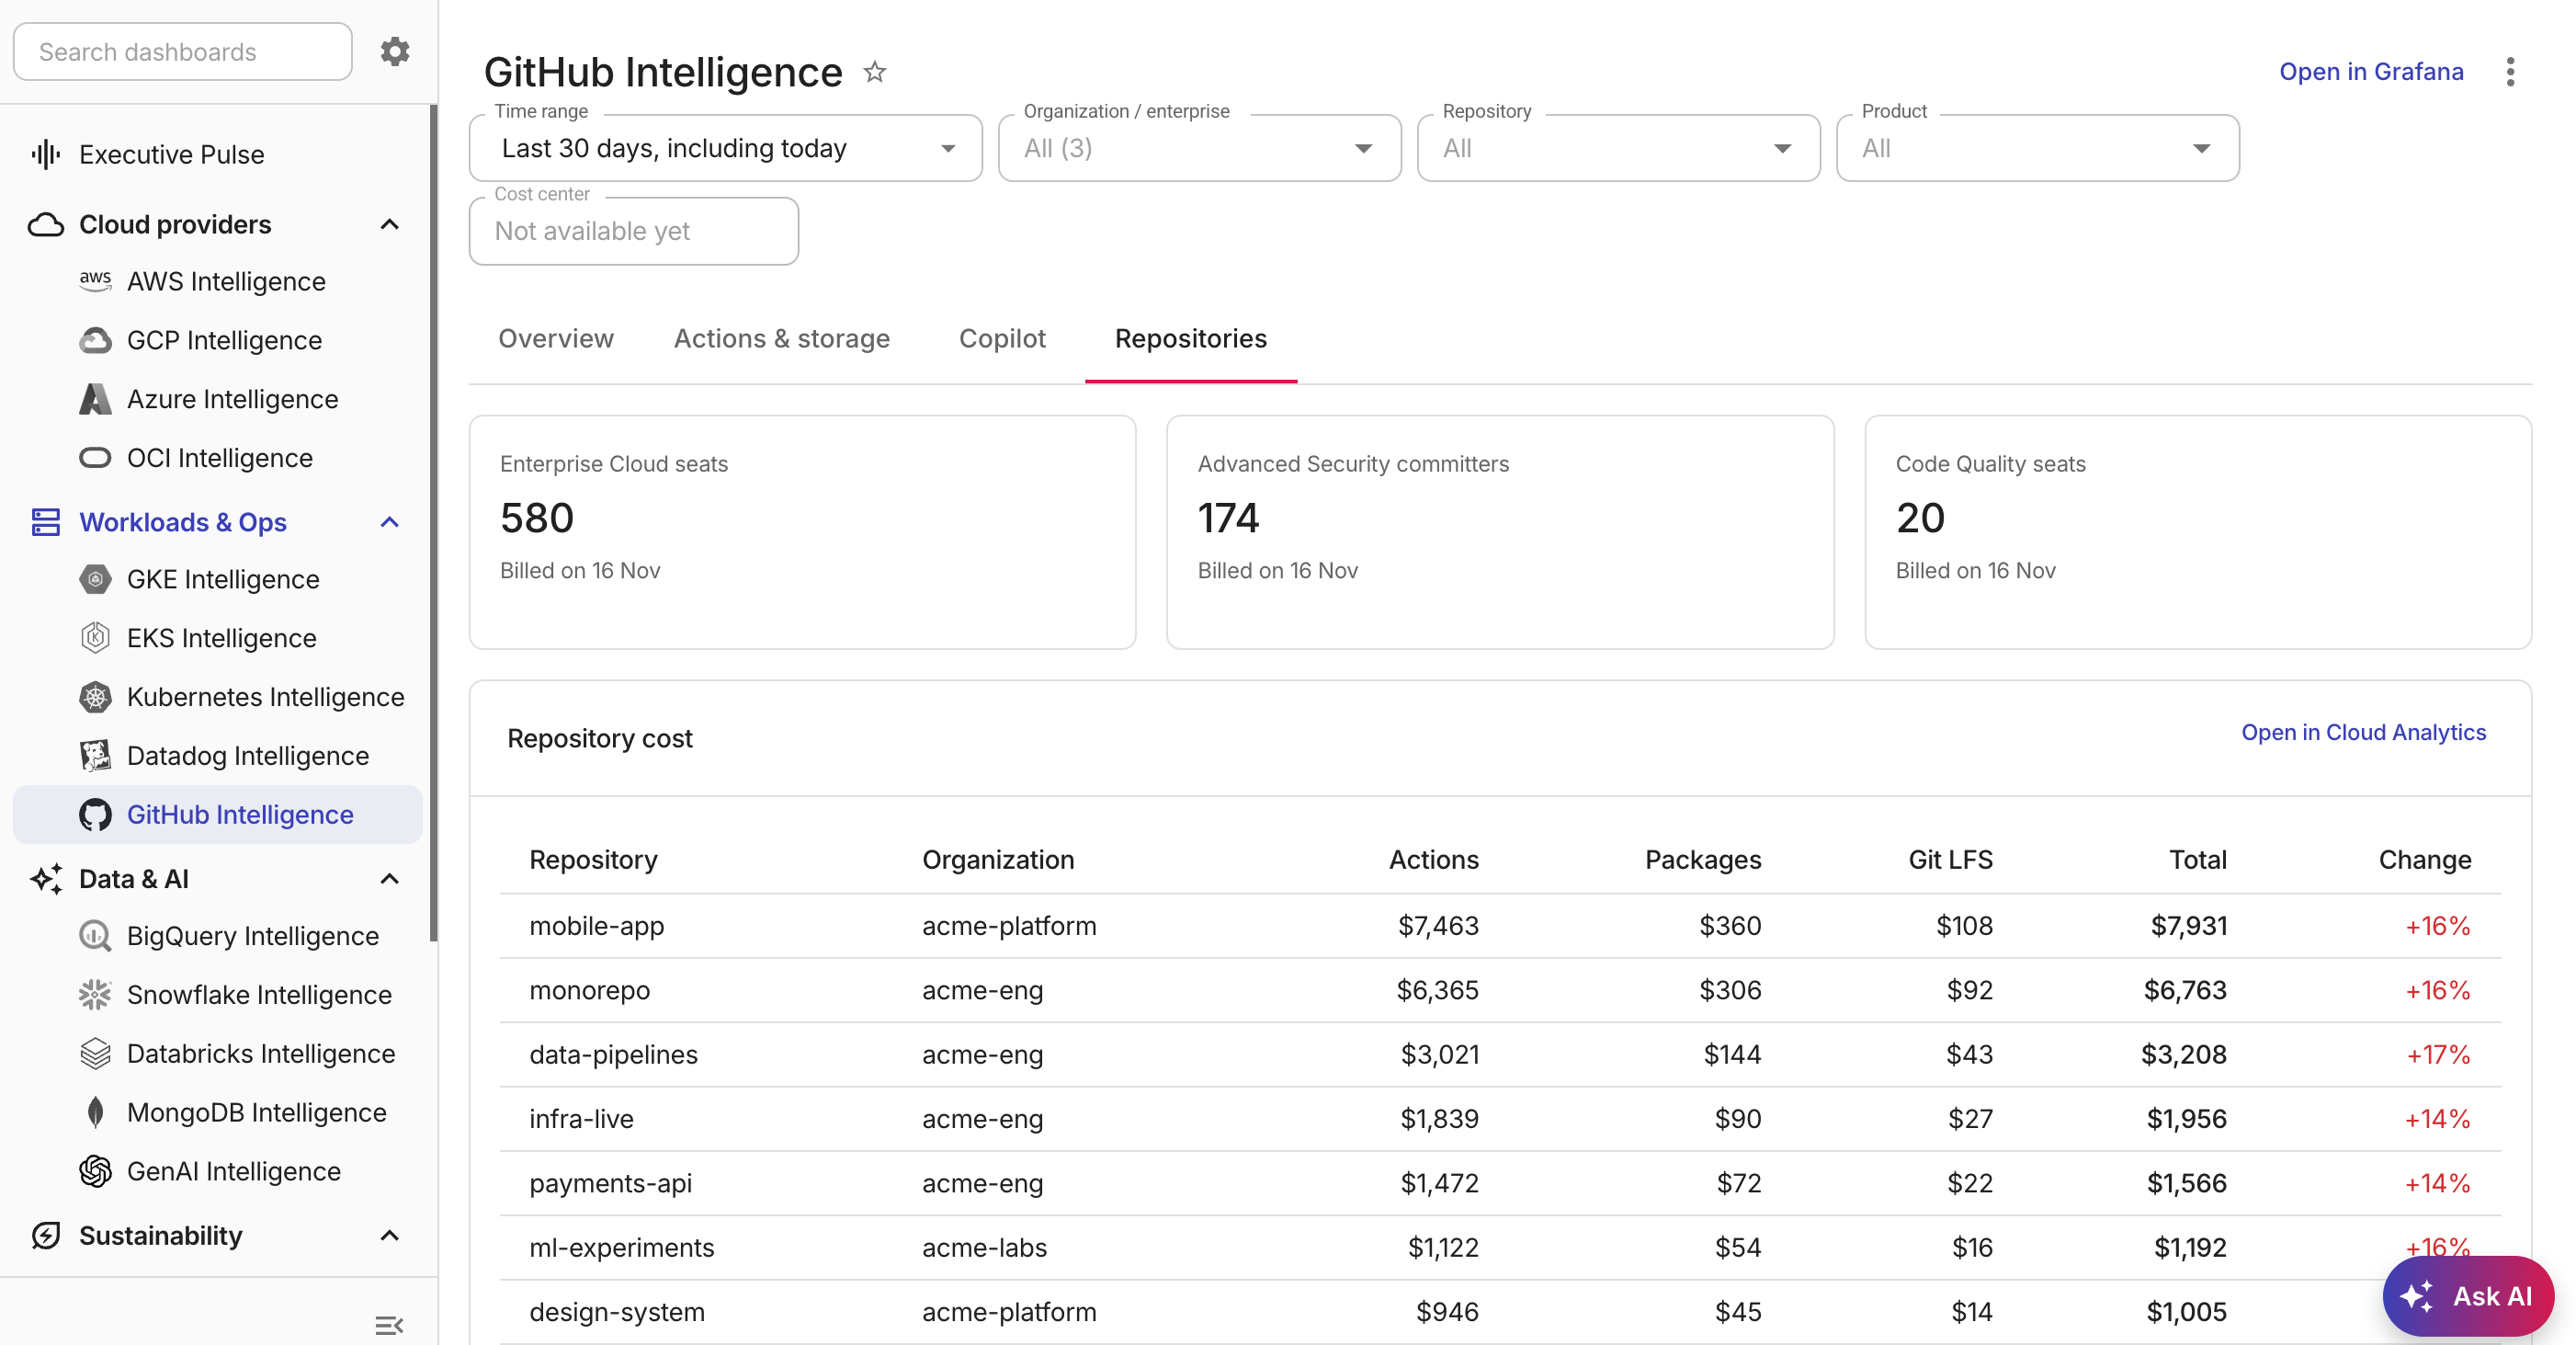
KPI cards:
-
Enterprise Cloud seats: The number of GitHub Enterprise Cloud seats billed.
-
Advanced Security committers: The number of GitHub Advanced Security unique committers billed.
-
Code Quality seats: The number of Code Quality seats billed.
Widgets:
-
Repository cost: A table listing each repository with cost columns per product (Actions, Packages, Git LFS, Codespaces, and others), a total, and a period change indicator.
-
Top organizations: Organizations ranked by total spend.
Cards that are not available yet
Some cards are in the dashboard as placeholders and show a message in place of data. They need data or a GitHub permission that is not collected yet. Installing the DoiT GitHub App does not change this today, even on cards that offer an Enable enriched data button.
-
Idle seats (no activity in 30 days) and Spend per user against seat price, on the Copilot tab: Need Copilot seat activity and seat plans published to Cloud Intelligence.
-
Cost per workflow, on the Actions & storage tab: GitHub billing data does not break cost down by workflow or job.
-
Cost by team, on the Repositories tab: Group repositories into teams with a Cloud Intelligence allocation on the repository dimension. If you can create allocations, the card has a Create allocation from repositories button that starts one.
-
Cost center chargeback, on the Repositories tab: GitHub billing rows carry no cost-center column yet.
-
Pull requests merged per repository, on the Repositories tab: Needs a GitHub App permission that is not granted yet.
Data refresh
DoiT refreshes GitHub billing data every 6 hours, and new usage typically appears 24–26 hours after GitHub generates it. See Data refresh.