Providers
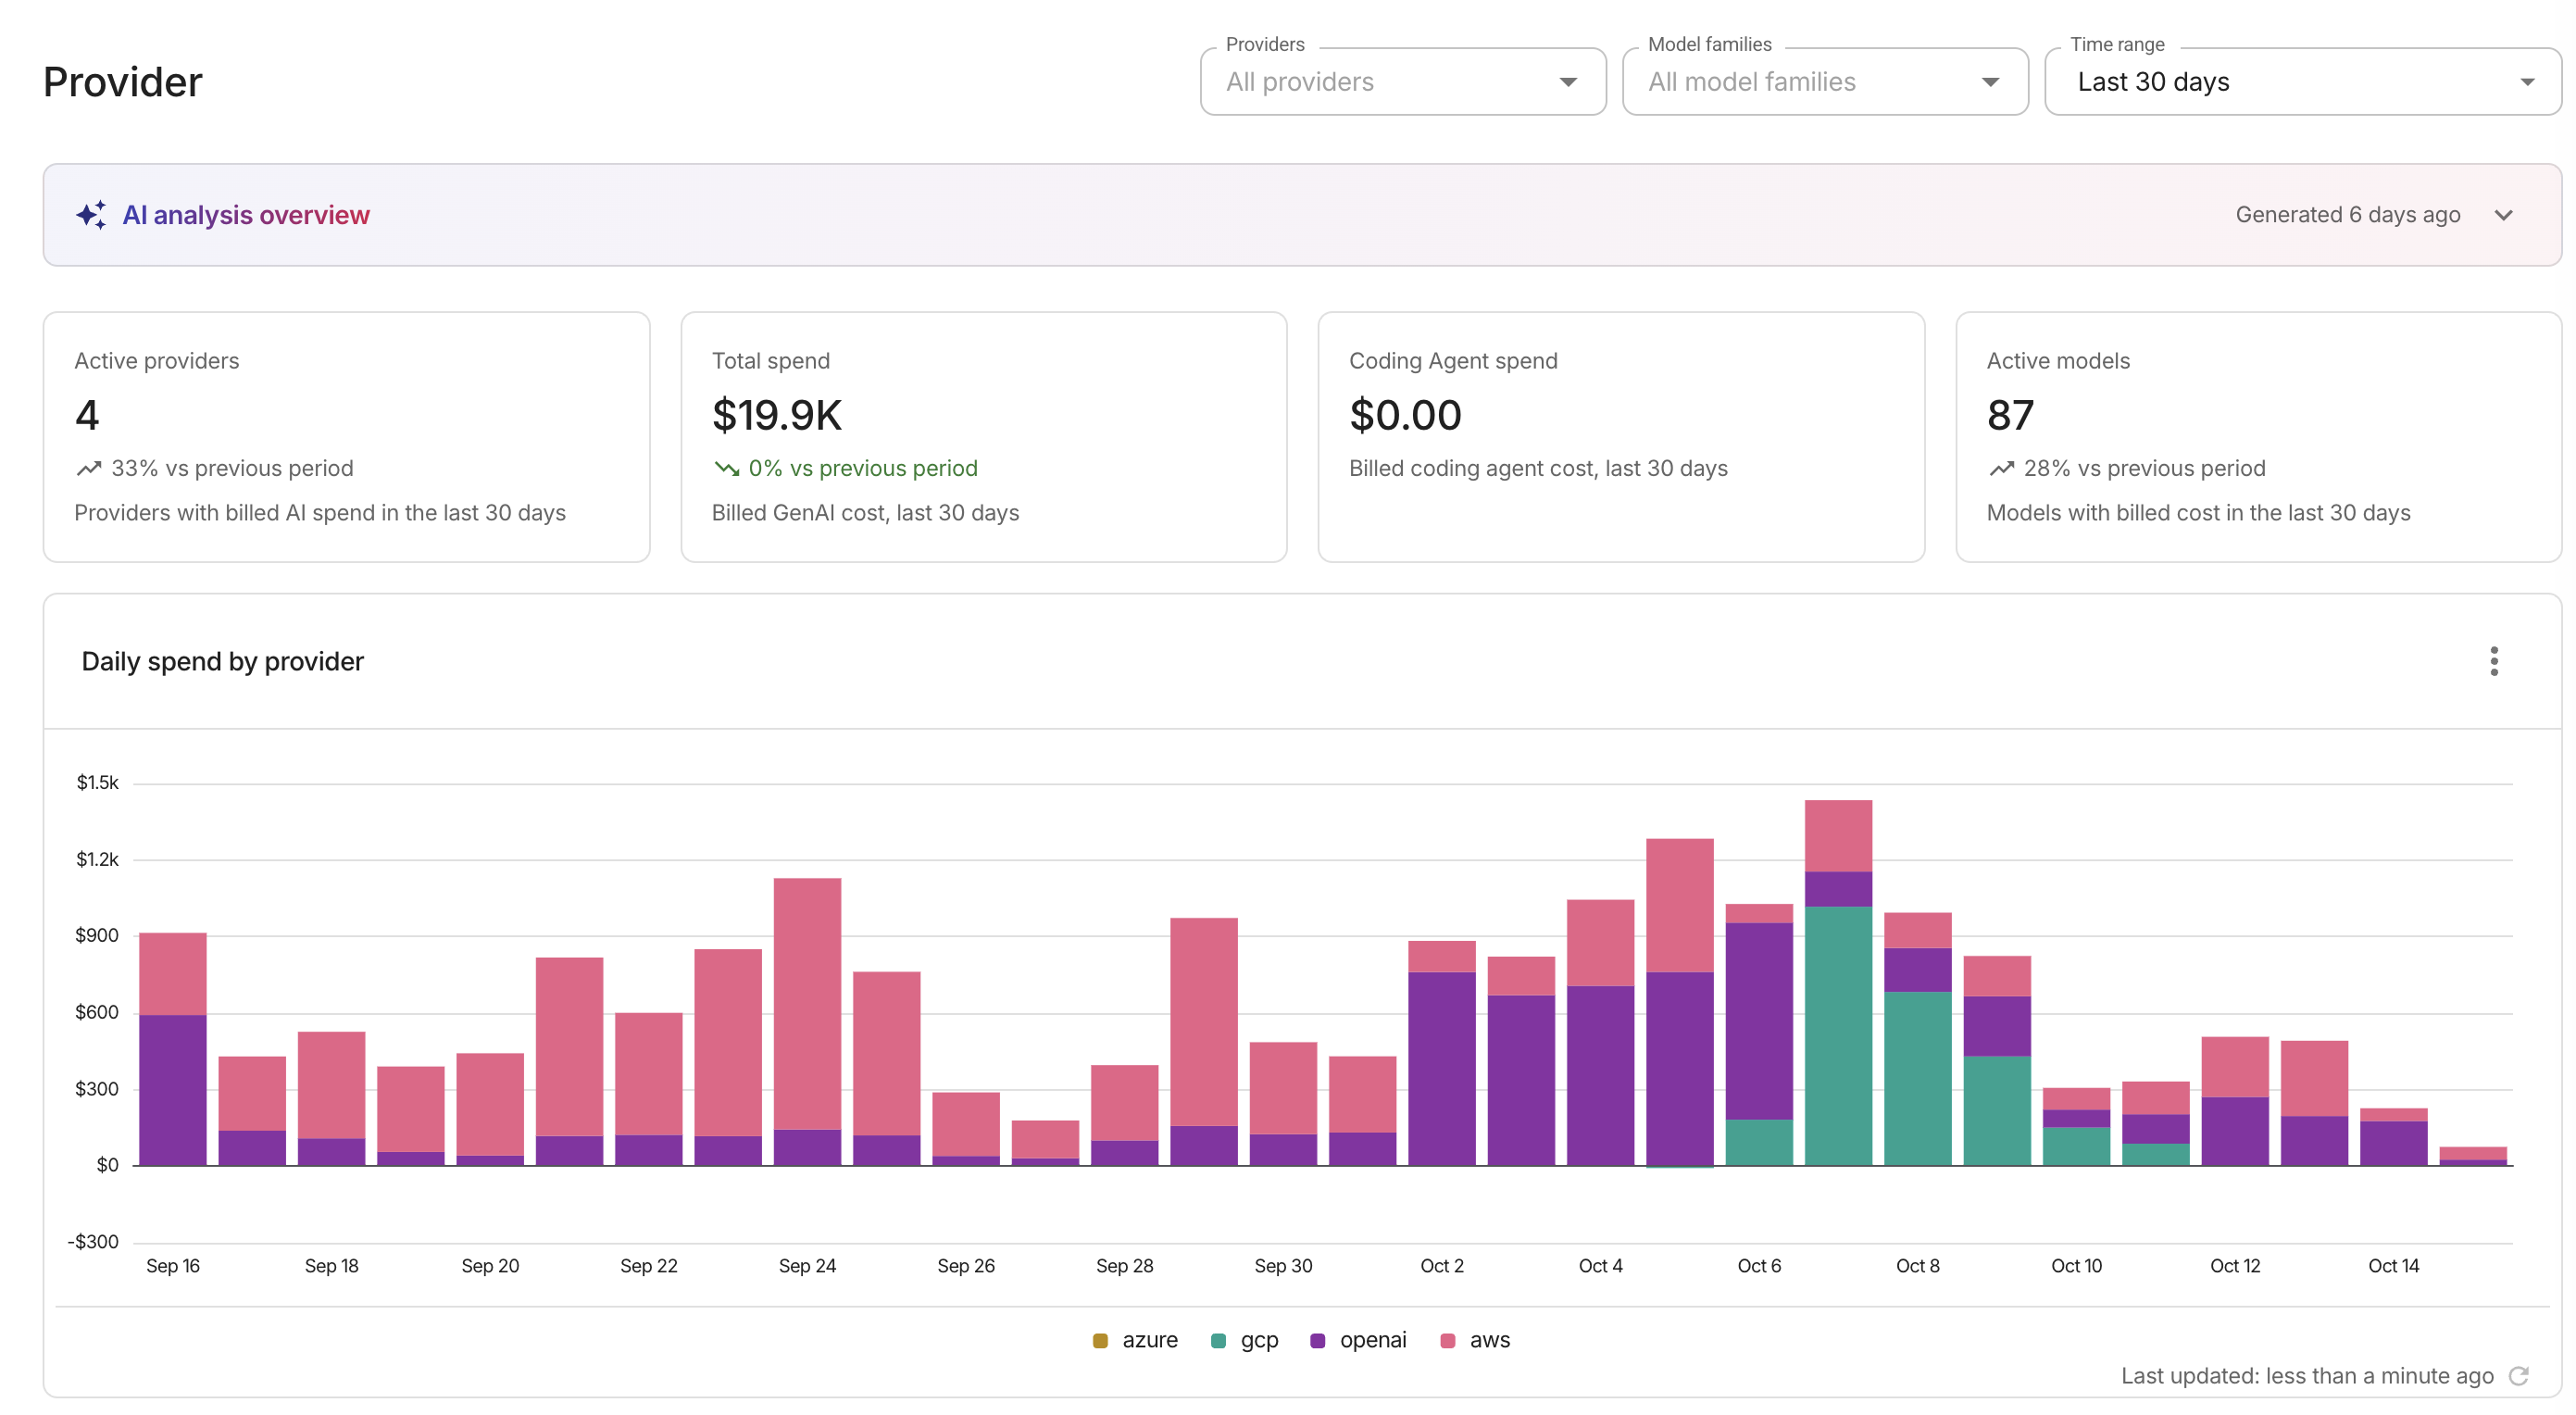
The Providers page in AI Hub gives you a consolidated view of your generative AI spend broken down by provider, model, and skill. Use it to track which providers are driving costs, compare model-level spend within each provider, and monitor skill adoption across your organization.
Required permission
To access the Providers page, your DoiT account needs the Cloud Analytics User permission.
Access the Providers page
In the AI Hub sidebar, go to Tokenomics > Provider.
Filters
Three filters at the top of the page let you narrow the data shown in the KPI cards and report widgets:
- Providers: Select one or more providers (for example, OpenAI, Anthropic, or Google Cloud) to focus on.
- Model families: Select one or more model families to filter by.
- Time range: Choose a custom date range. The default is the last 30 days.
After adjusting filters, select Apply to refresh the page. Select Clear to reset all filters to their defaults.
KPI cards
Four summary cards appear at the top of the page. Each card shows the current value, a comparison to the previous period, and a trend indicator.
-
Active providers: The number of providers with billed AI spend in the selected period. The trend indicator is neutral (neither positive nor negative).
-
Total spend: Your total billed GenAI cost for the selected period. The trend indicator treats an increase as a cost rise.
-
Coding Agent spend: Your billed coding agent cost for the selected period. The trend indicator treats an increase as a cost rise.
-
Active models: The number of models with billed cost in the selected period. The trend indicator is neutral.
Report widgets
Below the KPI cards, four report widgets visualize your provider and model data.
The Top skills by usage widget is hidden when your organization has no skill usage data. All other widgets are always visible.
Daily spend by provider
Shows your daily GenAI spend broken down by provider over the selected period. Use this chart to spot spending trends and detect unexpected cost spikes. The chart shows the five highest-cost providers and groups the rest into Other.
Total spend by provider
Ranks your providers by total GenAI spend for the selected period. This helps you identify which providers are driving the most cost. The card shows the ten highest-cost providers and groups the rest into Other.
Spend by provider and model
Displays a treemap of your GenAI spend grouped by provider and model. Each provider block contains its individual models, letting you see both the provider-level split and the model-level breakdown in a single view. Rows without a recognized model are filtered out.
Top skills by usage
Ranks your Anthropic skill invocations by skill for the last 30 complete days. The card shows the ten most-used skills and groups the rest into Other. This widget is hidden when your organization has no skill usage data.