Analyze unit economics cost
Objectives
In this tutorial, you'll learn how to:
-
Upload CSV from the DoiT console.
-
Create a unit metric to measure the unit economics per user interaction of features delivered by different teams.
This tutorial uses contrived data for demonstration purposes. In real-world scenarios, always sanitize your data, for example, mask personally identifiable information (PII), before sending it.
Step 1: Identify data source
In this tutorial, the organization fetches product usage data from a third-party service provider. The data shows how many user interactions happened during each calendar month, per team.
Below is the example source CSV file.
user-interactions-per-team.csv
Month,Team,User Interactions
2024-03-01,platform,"1,042"
2024-04-01,platform,979
2024-05-01,platform,"1,103"
2024-03-01,adoption,575
2024-04-01,adoption,671
2024-05-01,adoption,722
2024-03-01,data,"2,206"
2024-04-01,data,"2,649"
2024-05-01,data,"2,840"
2024-03-01,growth,365
2024-04-01,growth,449
2024-05-01,growth,512
2024-03-01,qa,31
2024-04-01,qa,30
2024-05-01,qa,31
Step 2: Define data granularity, prepare CSV
To measure the unit economics per user interaction, you first need to ingest the dataset of user interactions into DoiT DataHub.
When preparing the CSV:
-
Add
label.teamto the header row, indicating thatteamis a custom dimension. -
Add
metric.user_interactionsto the header row, indicating thatuser_interactionsis a custom metric
Below is the reformatted example CSV.
user-interactions-per-team-to-upload.csv
usage_date;label.team;metric.user_interactions
2024-03-01T00:00:00Z;platform;1042
2024-04-01T00:00:00Z;platform;979
2024-05-01T00:00:00Z;platform;1103
2024-03-01T00:00:00Z;adoption;575
2024-04-01T00:00:00Z;adoption;671
2024-05-01T00:00:00Z;adoption;722
2024-03-01T00:00:00Z;data;2206
2024-04-01T00:00:00Z;data;2649
2024-05-01T00:00:00Z;data;2840
2024-03-01T00:00:00Z;growth;365
2024-04-01T00:00:00Z;growth;449
2024-05-01T00:00:00Z;growth;512
2024-03-01T00:00:00Z;qa;31
2024-04-01T00:00:00Z;qa;30
2024-05-01T00:00:00Z;qa;31
Step 3: Upload CSV
-
Sign in to the DoiT console, select Data ingestion and integrations > DataHub from the top navigation mega menu.
-
Select Create new dataset.
-
Follow the instructions to Create a new dataset and Upload CSV file.
If successful, the data will be available in DoiT console in 15 minutes.
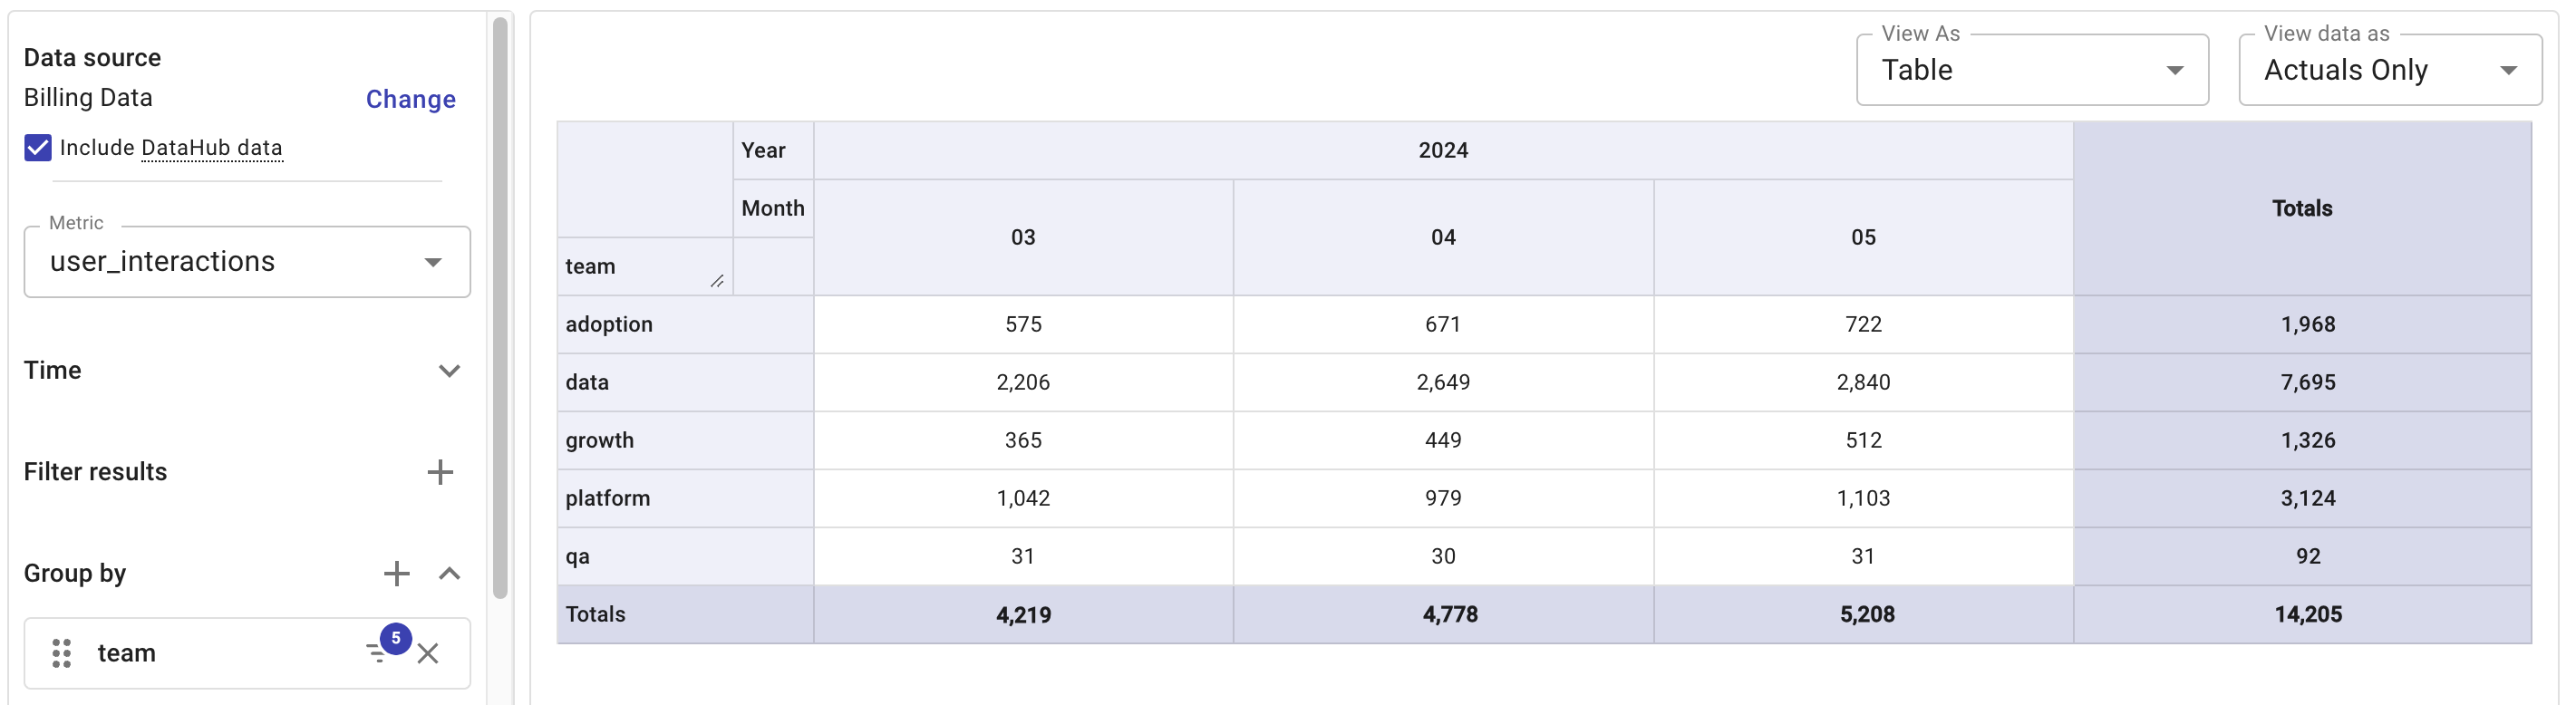
Step 4: Explore the ingested dataset
-
Sign in to the DoiT console.
-
Create a new Cloud Analytics report:
-
Select Include DataHub data under Data source.
-
In the Metric drop-down, select
User Interactionsunder DataHub metrics. -
In the Group by section, select
teamunder Labels and filter by team names.
-
-
Run the report.
Step 5: Create a unit metric
Create a unit metric to measure the cost per user interaction:
-
Create a custom allocation rule named
Everything, using the Provider dimension to include the relevant datasets. See Create allocations. -
Create a custom metric named
Cost per Interaction, using the DataHub metricuser_interactionsand the basic metricCostas base metrics. See Create metrics.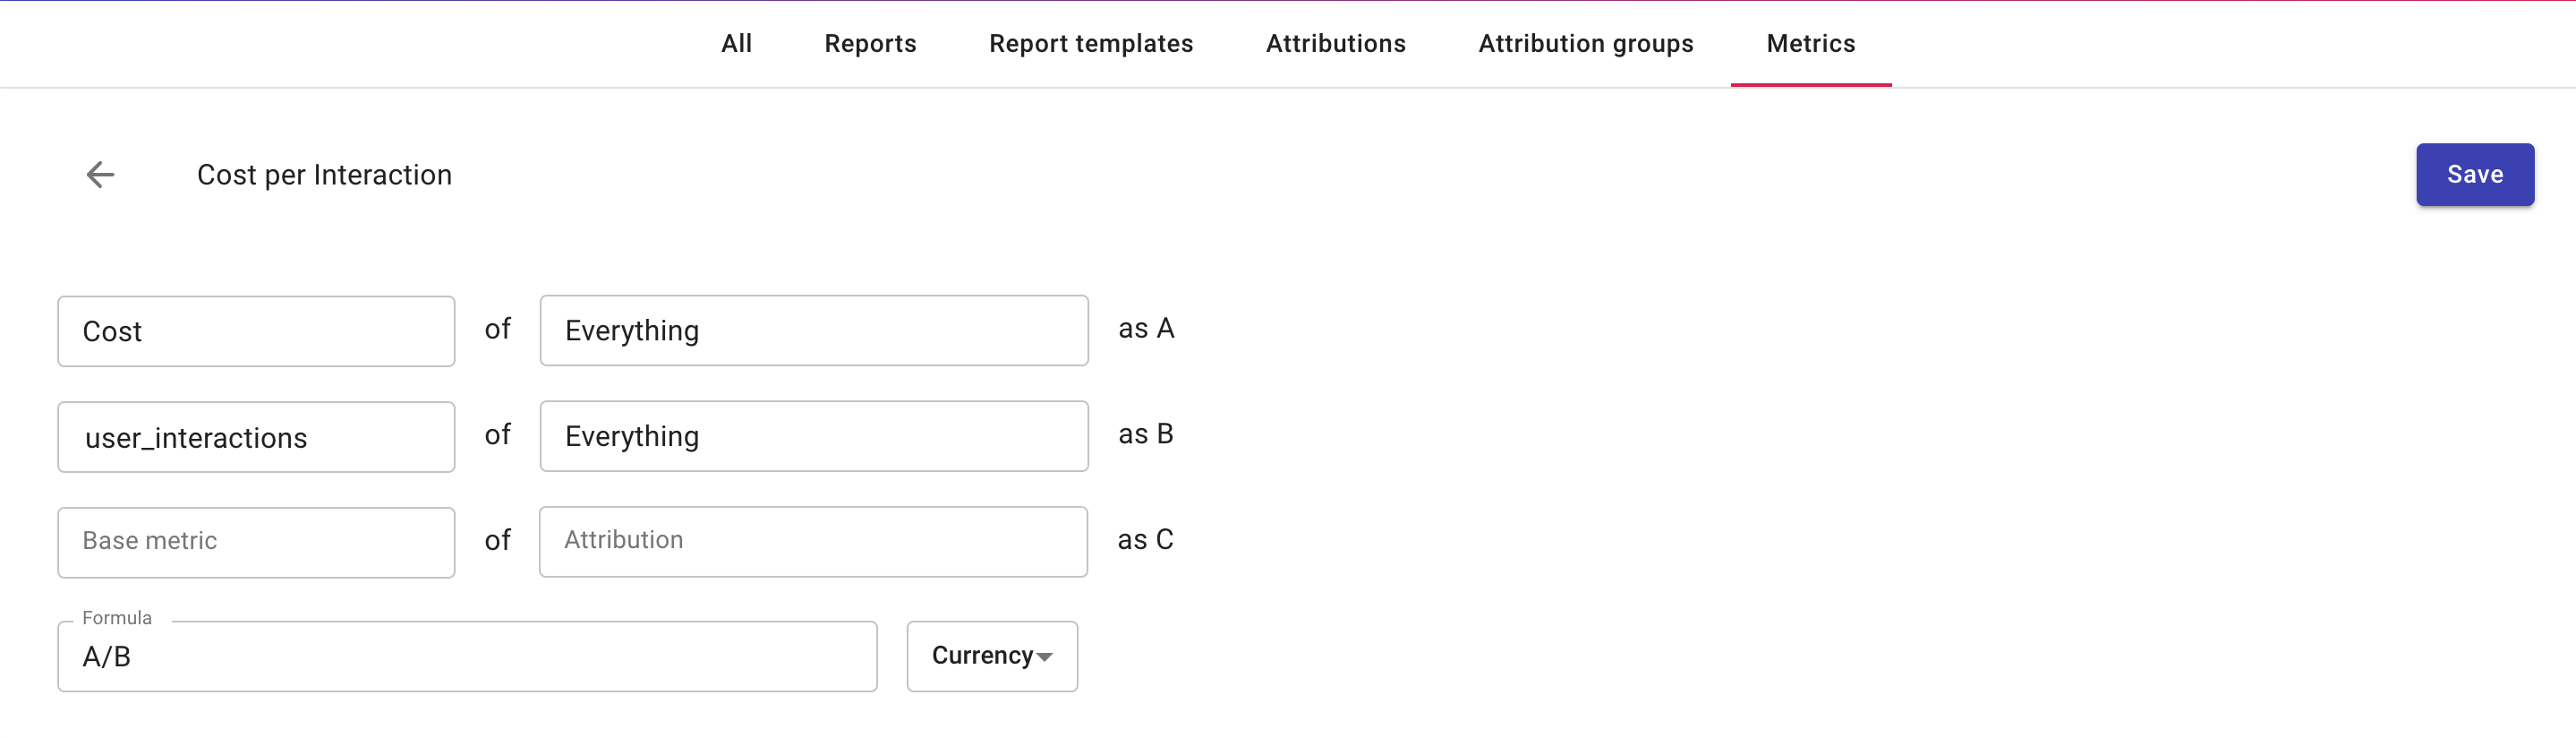
-
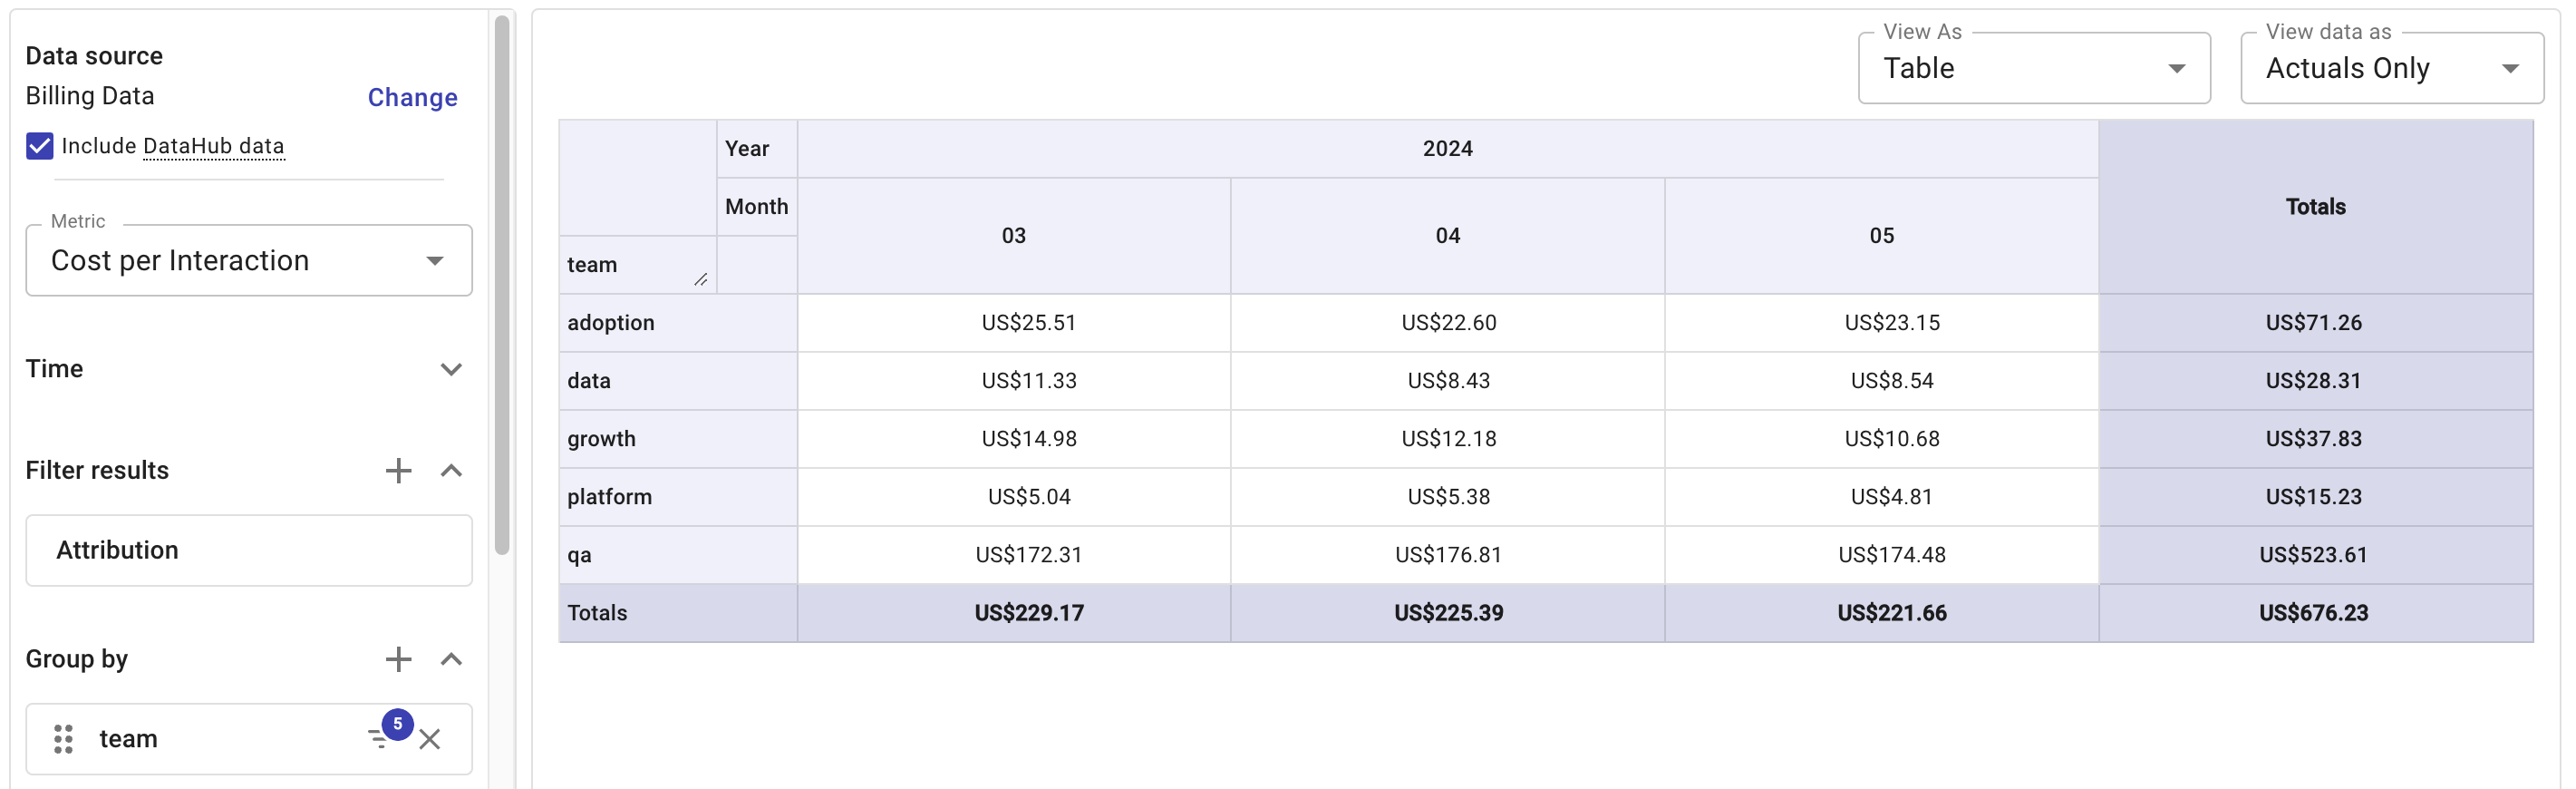
Create a new Cloud Analytics report:
-
Select Include DataHub data under Data source.
-
In the Metric drop-down, select
Cost per Interactionunder Custom metrics. -
In the Group by section, select
teamunder Labels and filter by team names.
-
-
Run the report.