GenAI Intelligence
For each AI model provider supported by DoiT, the GenAI Intelligence helps you identify and track your AI cost and usage in a single dashboard, and make decisions about how and when to optimize costs, monitor performance, and more.
Required permission
To access the GenAI Intelligence, your DoiT account needs the Cloud Analytics User permission.
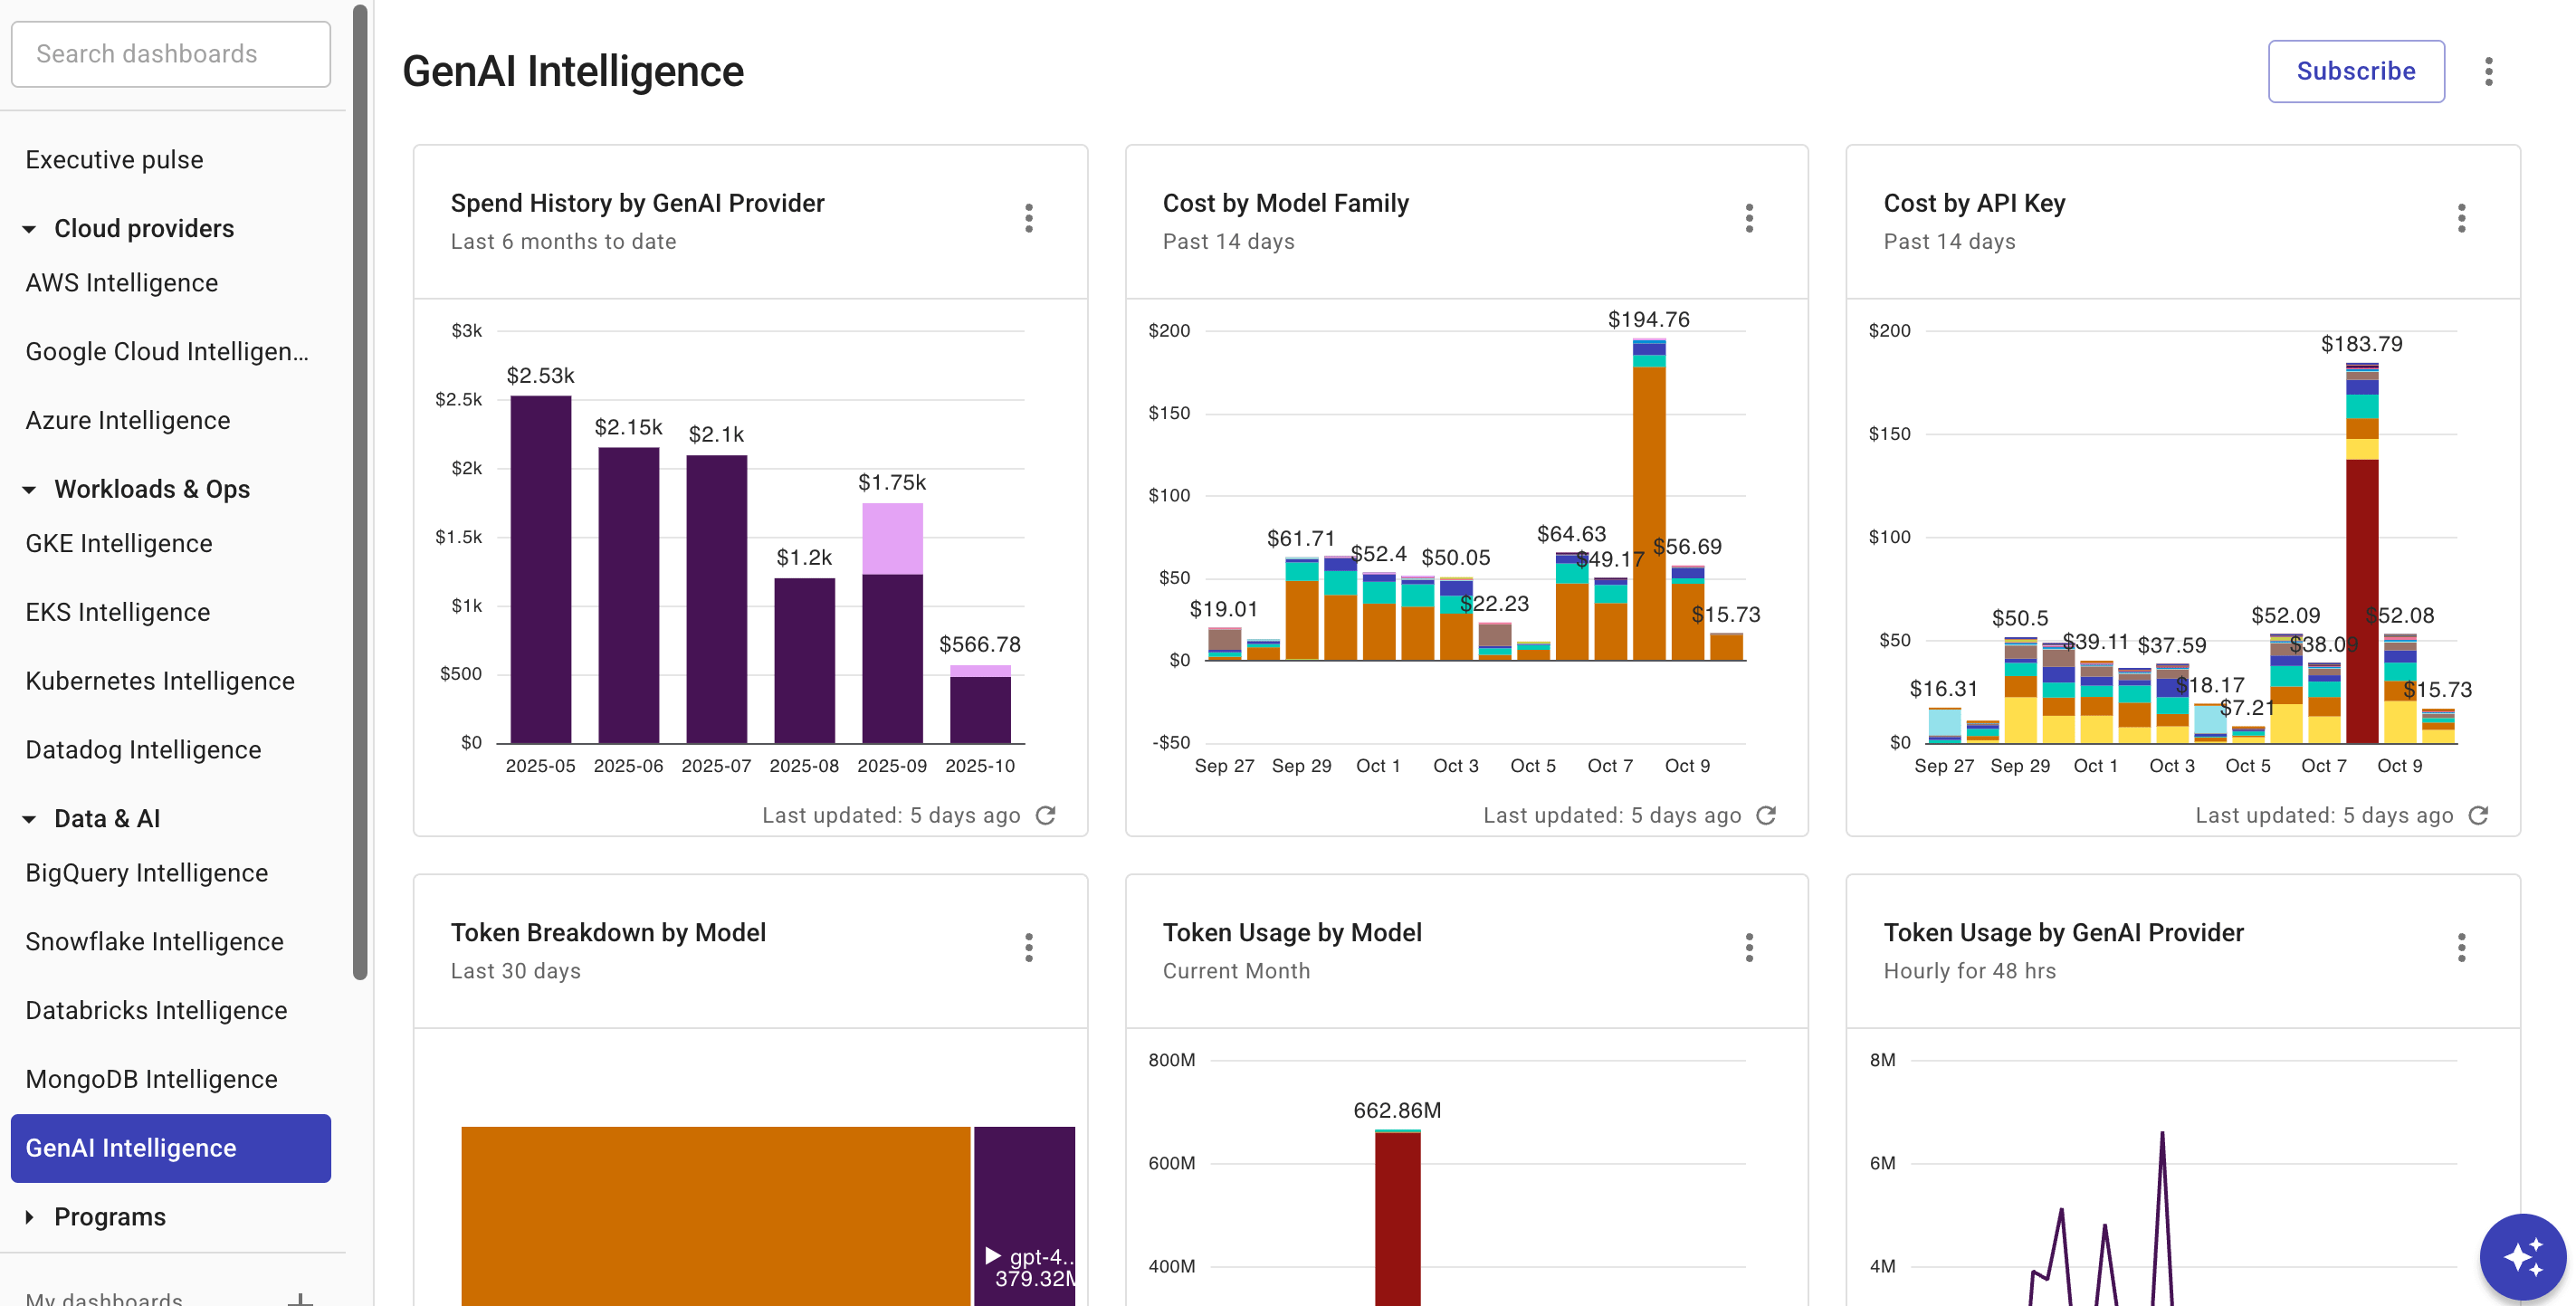
GenAI Intelligence dashboard
The GenAI Intelligence dashboard consists of some preset report widgets that highlight various aspects of your generative AI spend and usage. It's automatically populated when your generative AI data has been imported into the DoiT console.
To access the GenAI Intelligence dashboard, select Dashboards from the top navigation mega menu, and then select GenAI Intelligence.
Widgets on the dashboard are updated independently of each other. See Refresh report data for more information.
You can Open full report to check the report configuration, or customize the preset report to create your own one.
Spend history by GenAI provider
Shows your total monthly AI expenditure by provider. This is useful for managing costs, optimizing usage, and making informed decisions about your applications and projects.
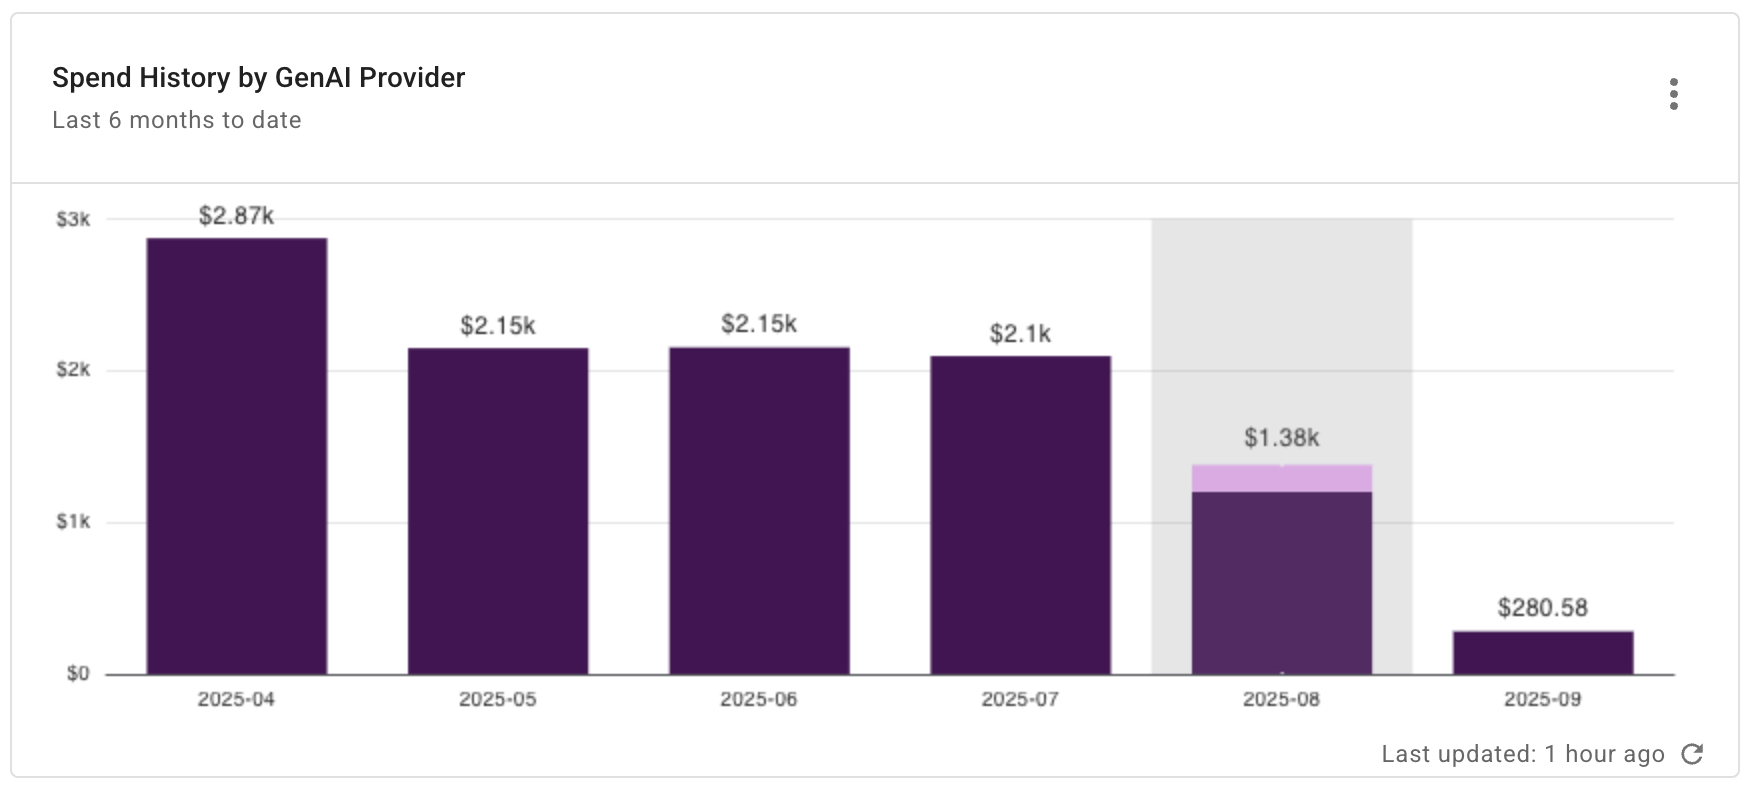
Report configuration:
- Metric: Cost
- Time Range: Last 6 months w. current
- Time Interval: Month
- Group by:
- Provider:
AnthropicOpenAIAmazon Web ServicesGoogle CloudMicrosoft AzureDatabricks
- Provider:
Cost by model family
Shows your total cost by AI model for the last 14 days. This allows you to spot any unexpected cost spikes or changes in spending patterns, helping you identify issues before they escalate. In addition, it provides immediate feedback on the financial impact of recent model usage or configuration changes.
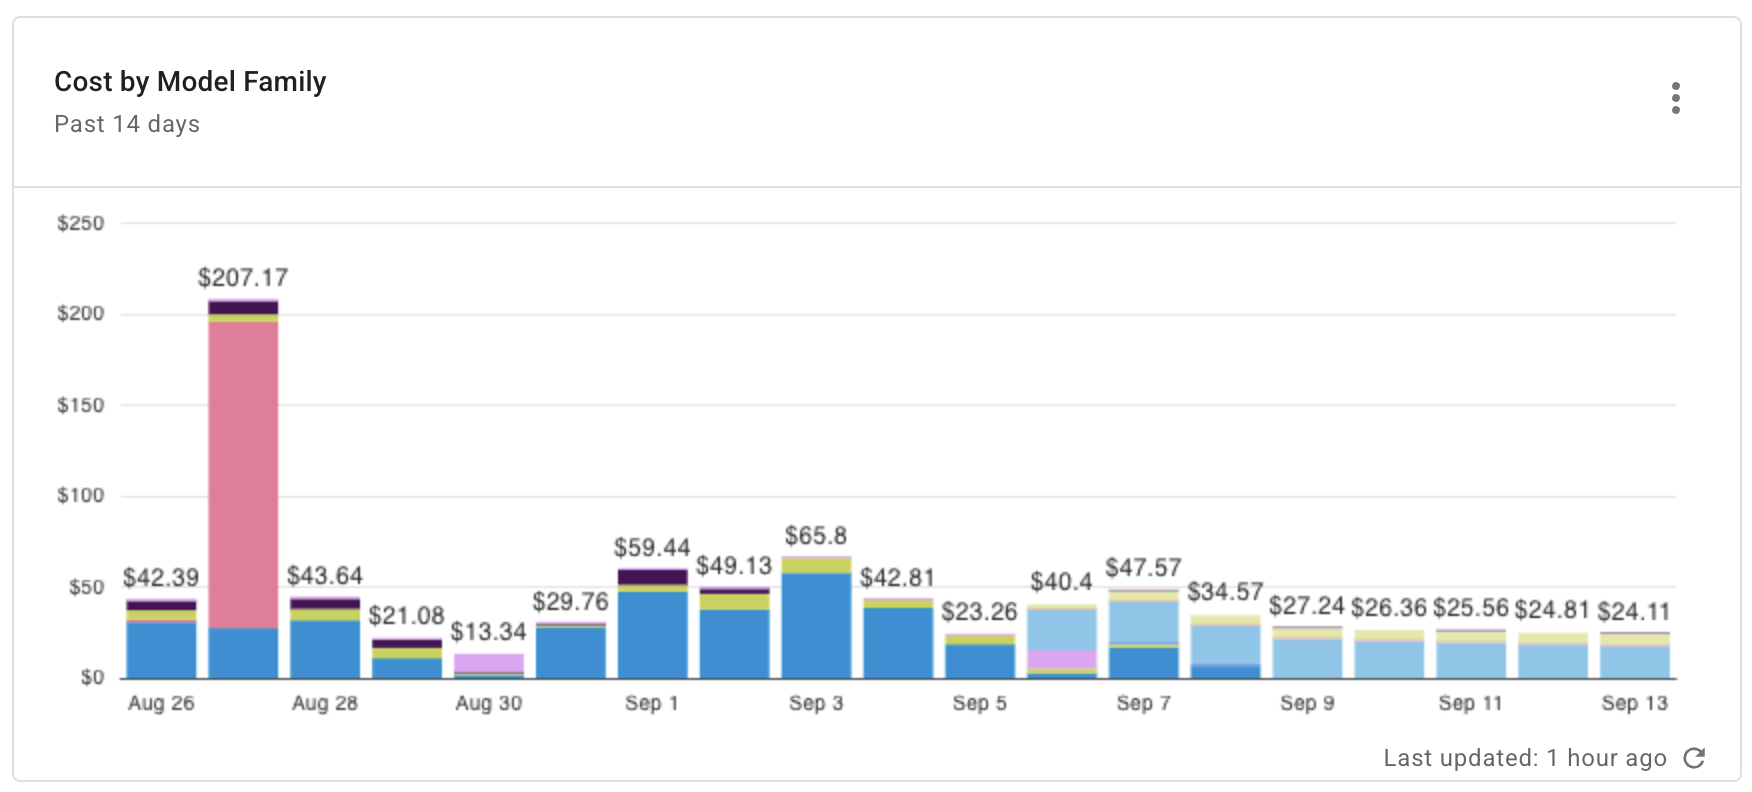
Report configuration:
- Metric: Cost
- Time Range: Last 14 days w. current
- Time Interval: days
- Group by:
- Model Family
Cost by API key
Shows your total cost by AI API key for the last 14 days. This highlights which APIs are driving your recent spend, helping you detect cost anomalies and make informed decisions about which APIs to optimize.
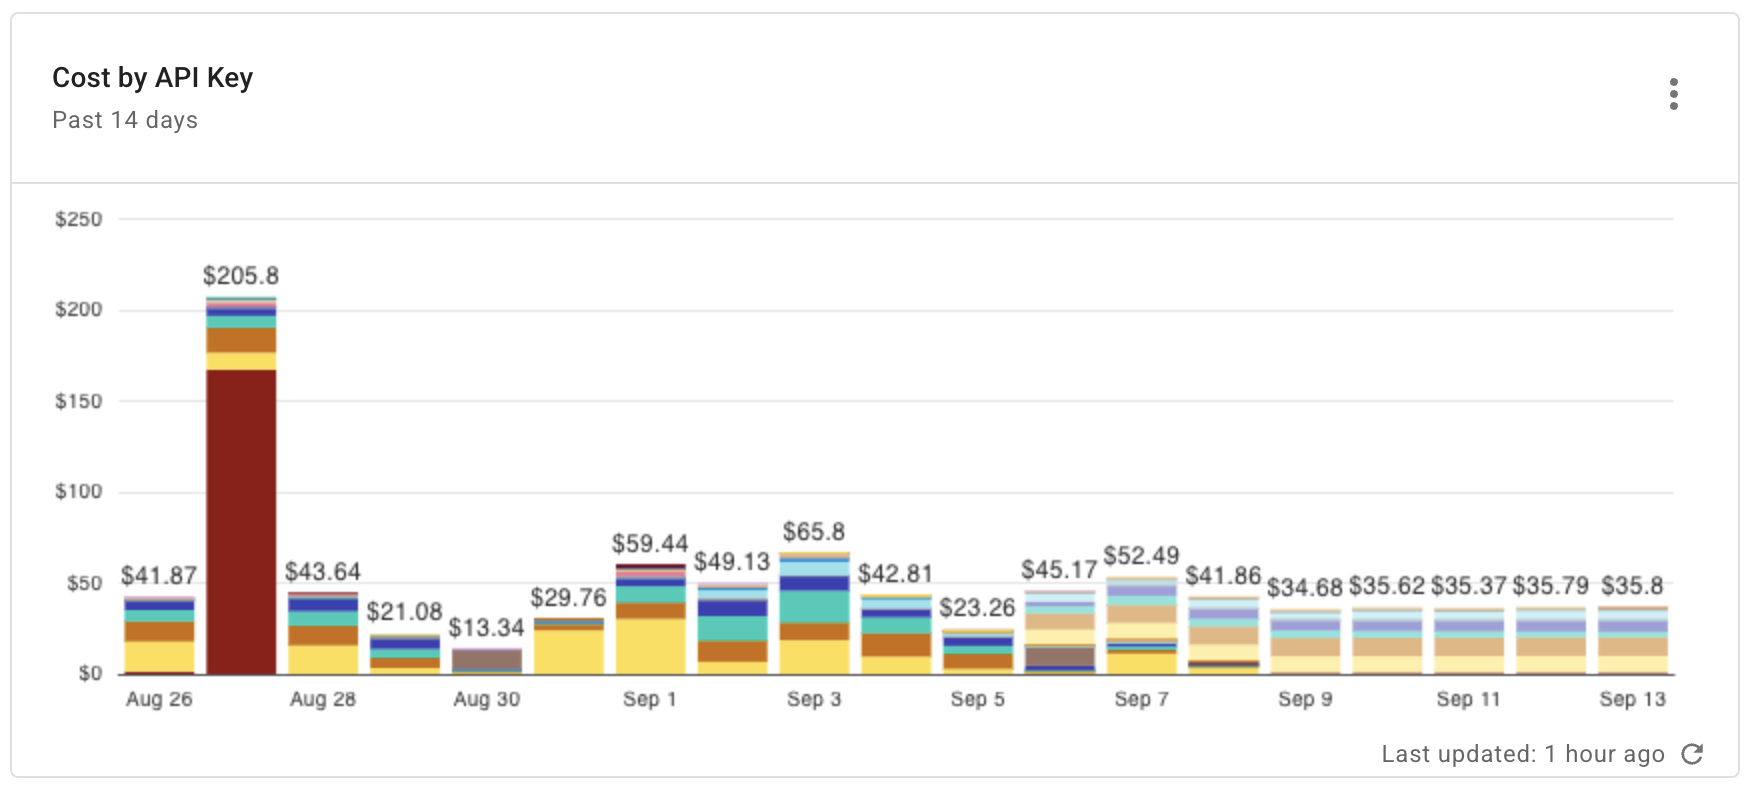
Report configuration:
- Metric: Cost
- Time Range: Last 14 days w. current
- Time Interval: Day
- Group by:
- Api Key Name
Token breakdown by model
Shows your total token usage by AI model for the last 30 days. Token usage is the primary driver of AI API costs, so this report allows you to identify trends and justify spending. It also helps you identify opportunities to optimize prompts and model outputs to reduce token count and reduce costs.
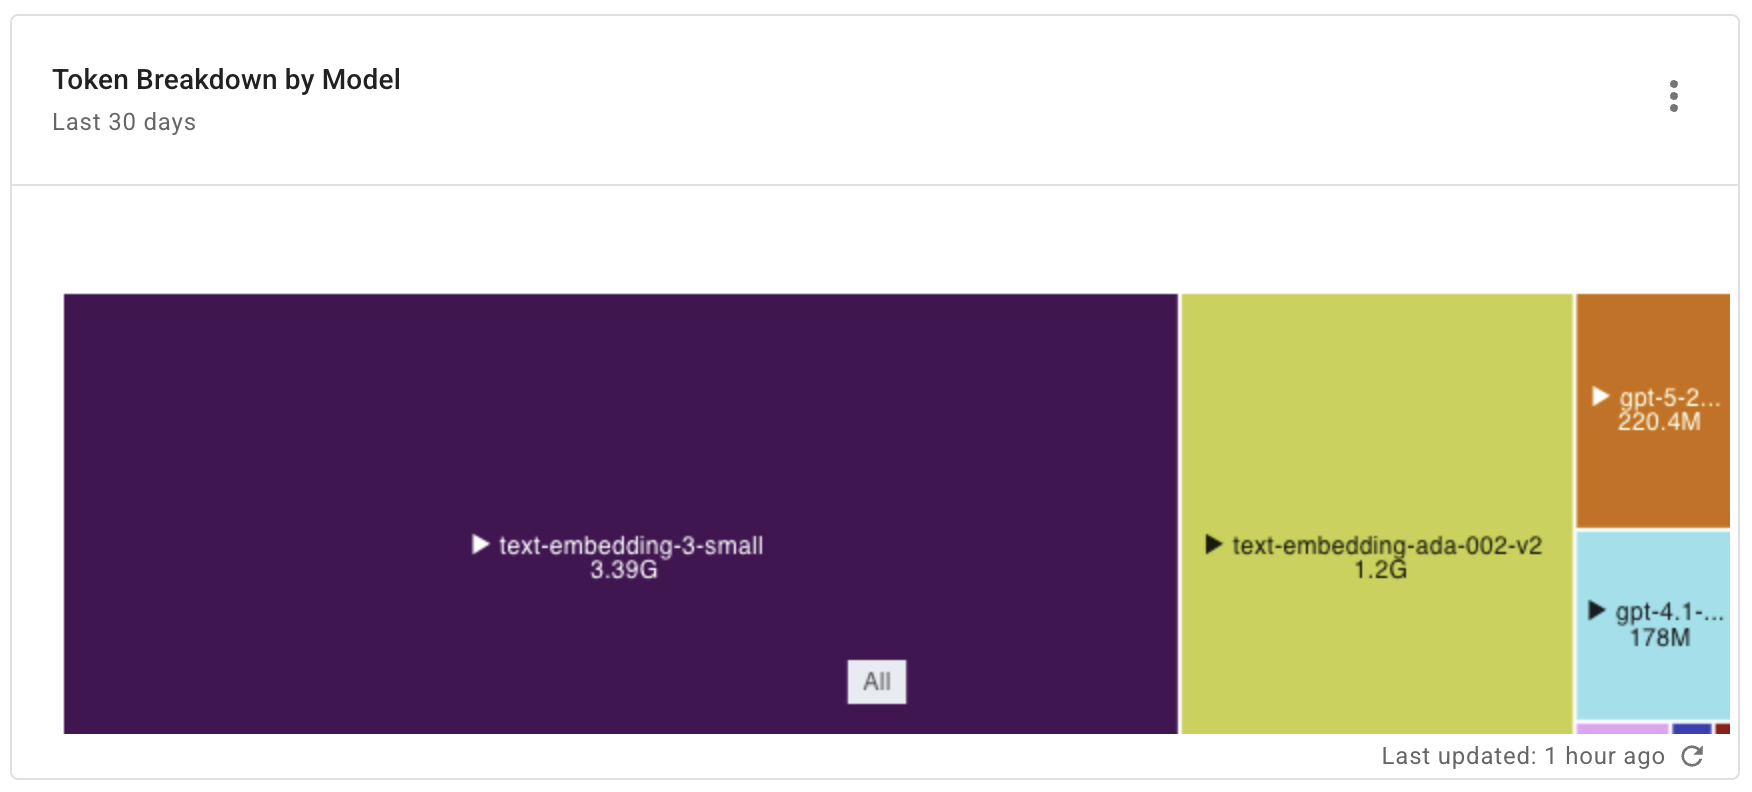
Report configuration:
- Metric: Usage
- Time Range: Last 30 days
- Time Interval: Day
- Group by:
- Model
- Provider:
AnthropicOpenAIAmazon Web ServicesGoogle CloudMicrosoft AzureDatabricks
- organization_name
- Project/Account ID
- Operation
Token usage by model
Shows your daily AI token usage by model. This allows you to see the models that are driving your current spending, helping you make decisions about using the most cost-effective model for each task. It also helps identify your consumption trends within the current billing cycle.
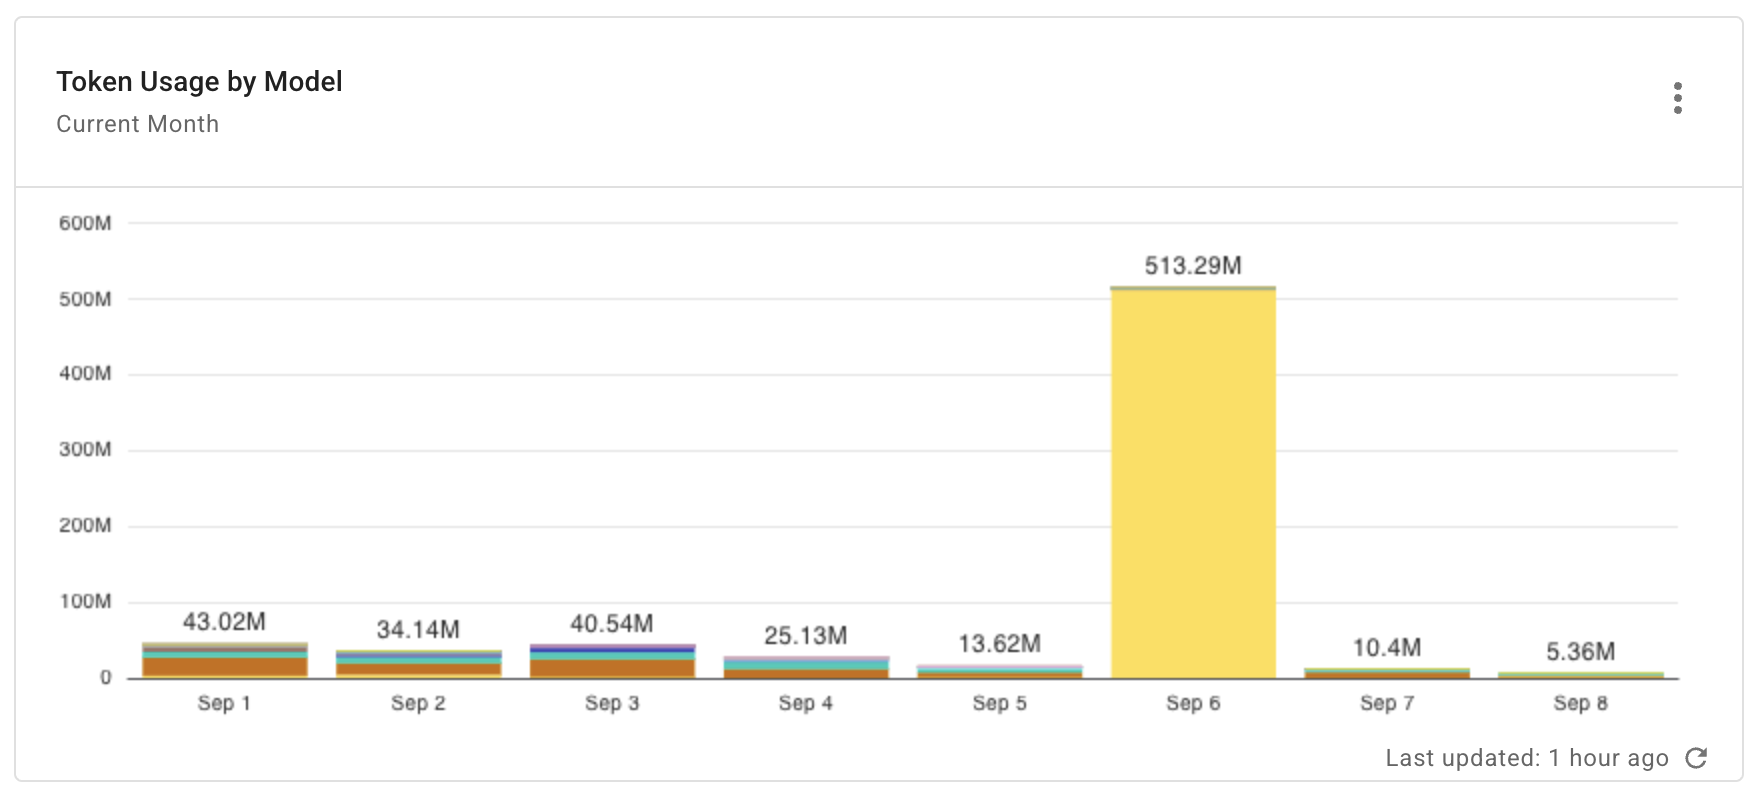
Report configuration:
- Metric: Usage
- Time Range: Current month
- Time Interval: Day
- Group by:
- Model
Token usage by GenAI provider
Shows your hourly AI token usage by provider for the last 2 days. This granular view allows you to spot spikes in consumption, identify the exact hour a problem occurred, and correlate usage with specific events or application changes. This provides the immediate context to investigate and resolve issues.
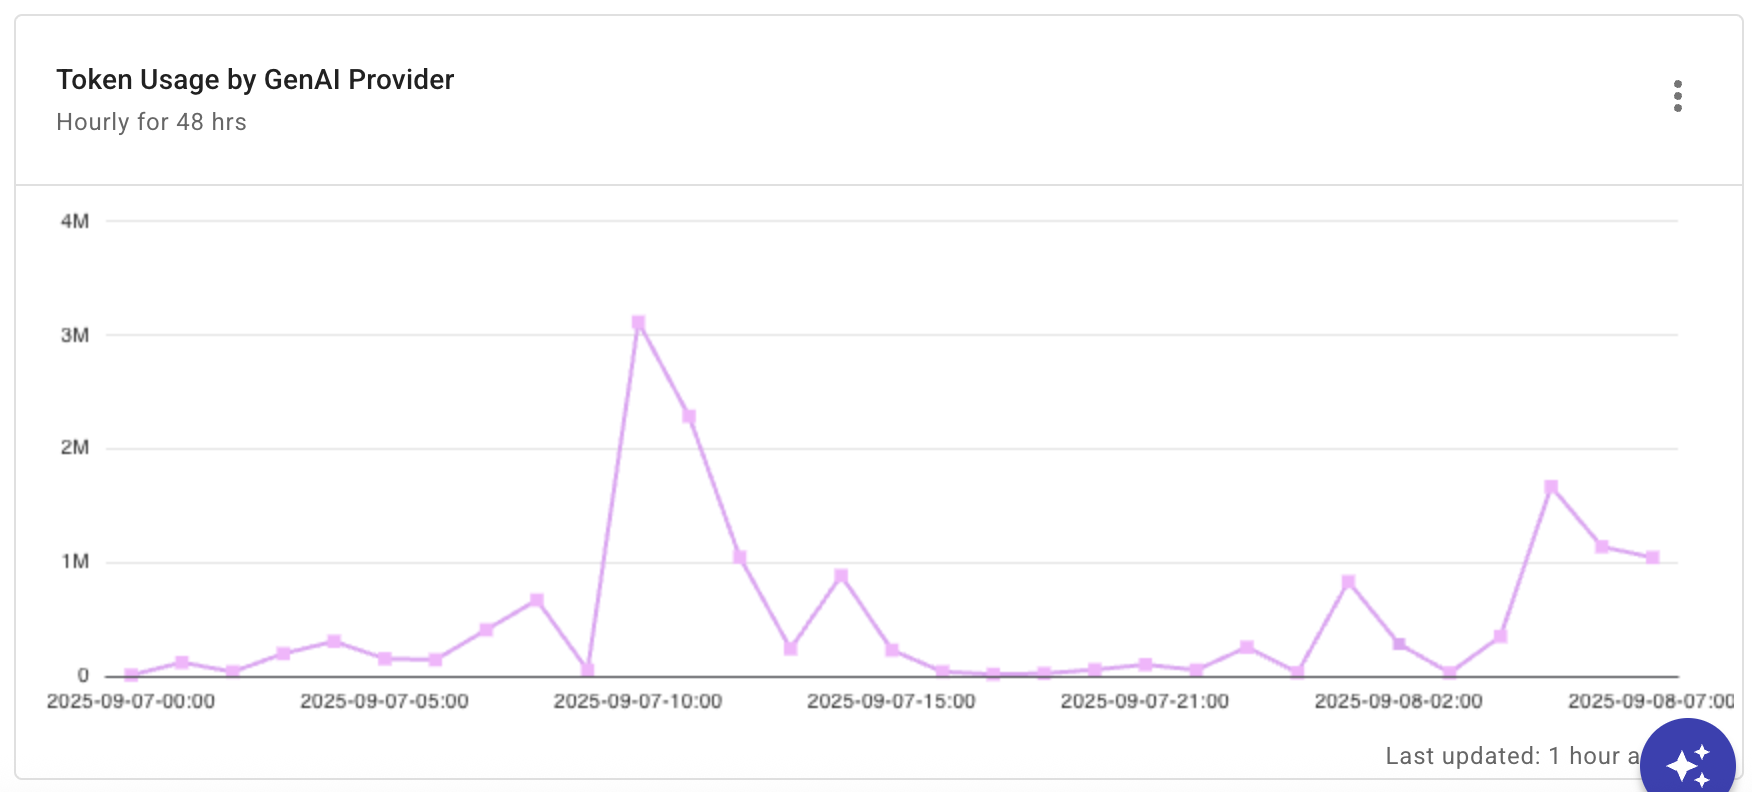
Report configuration:
- Metric: Usage
- Time Range: Last 2 days w. current
- Time Interval: Hour
- Group by:
- Provider:
AnthropicOpenAIAmazon Web ServicesGoogle CloudMicrosoft AzureDatabricks
- Provider: