Default mode
The Default mode is the standard commitment simulation view with selectors, summary table, and analysis charts.
Summary table
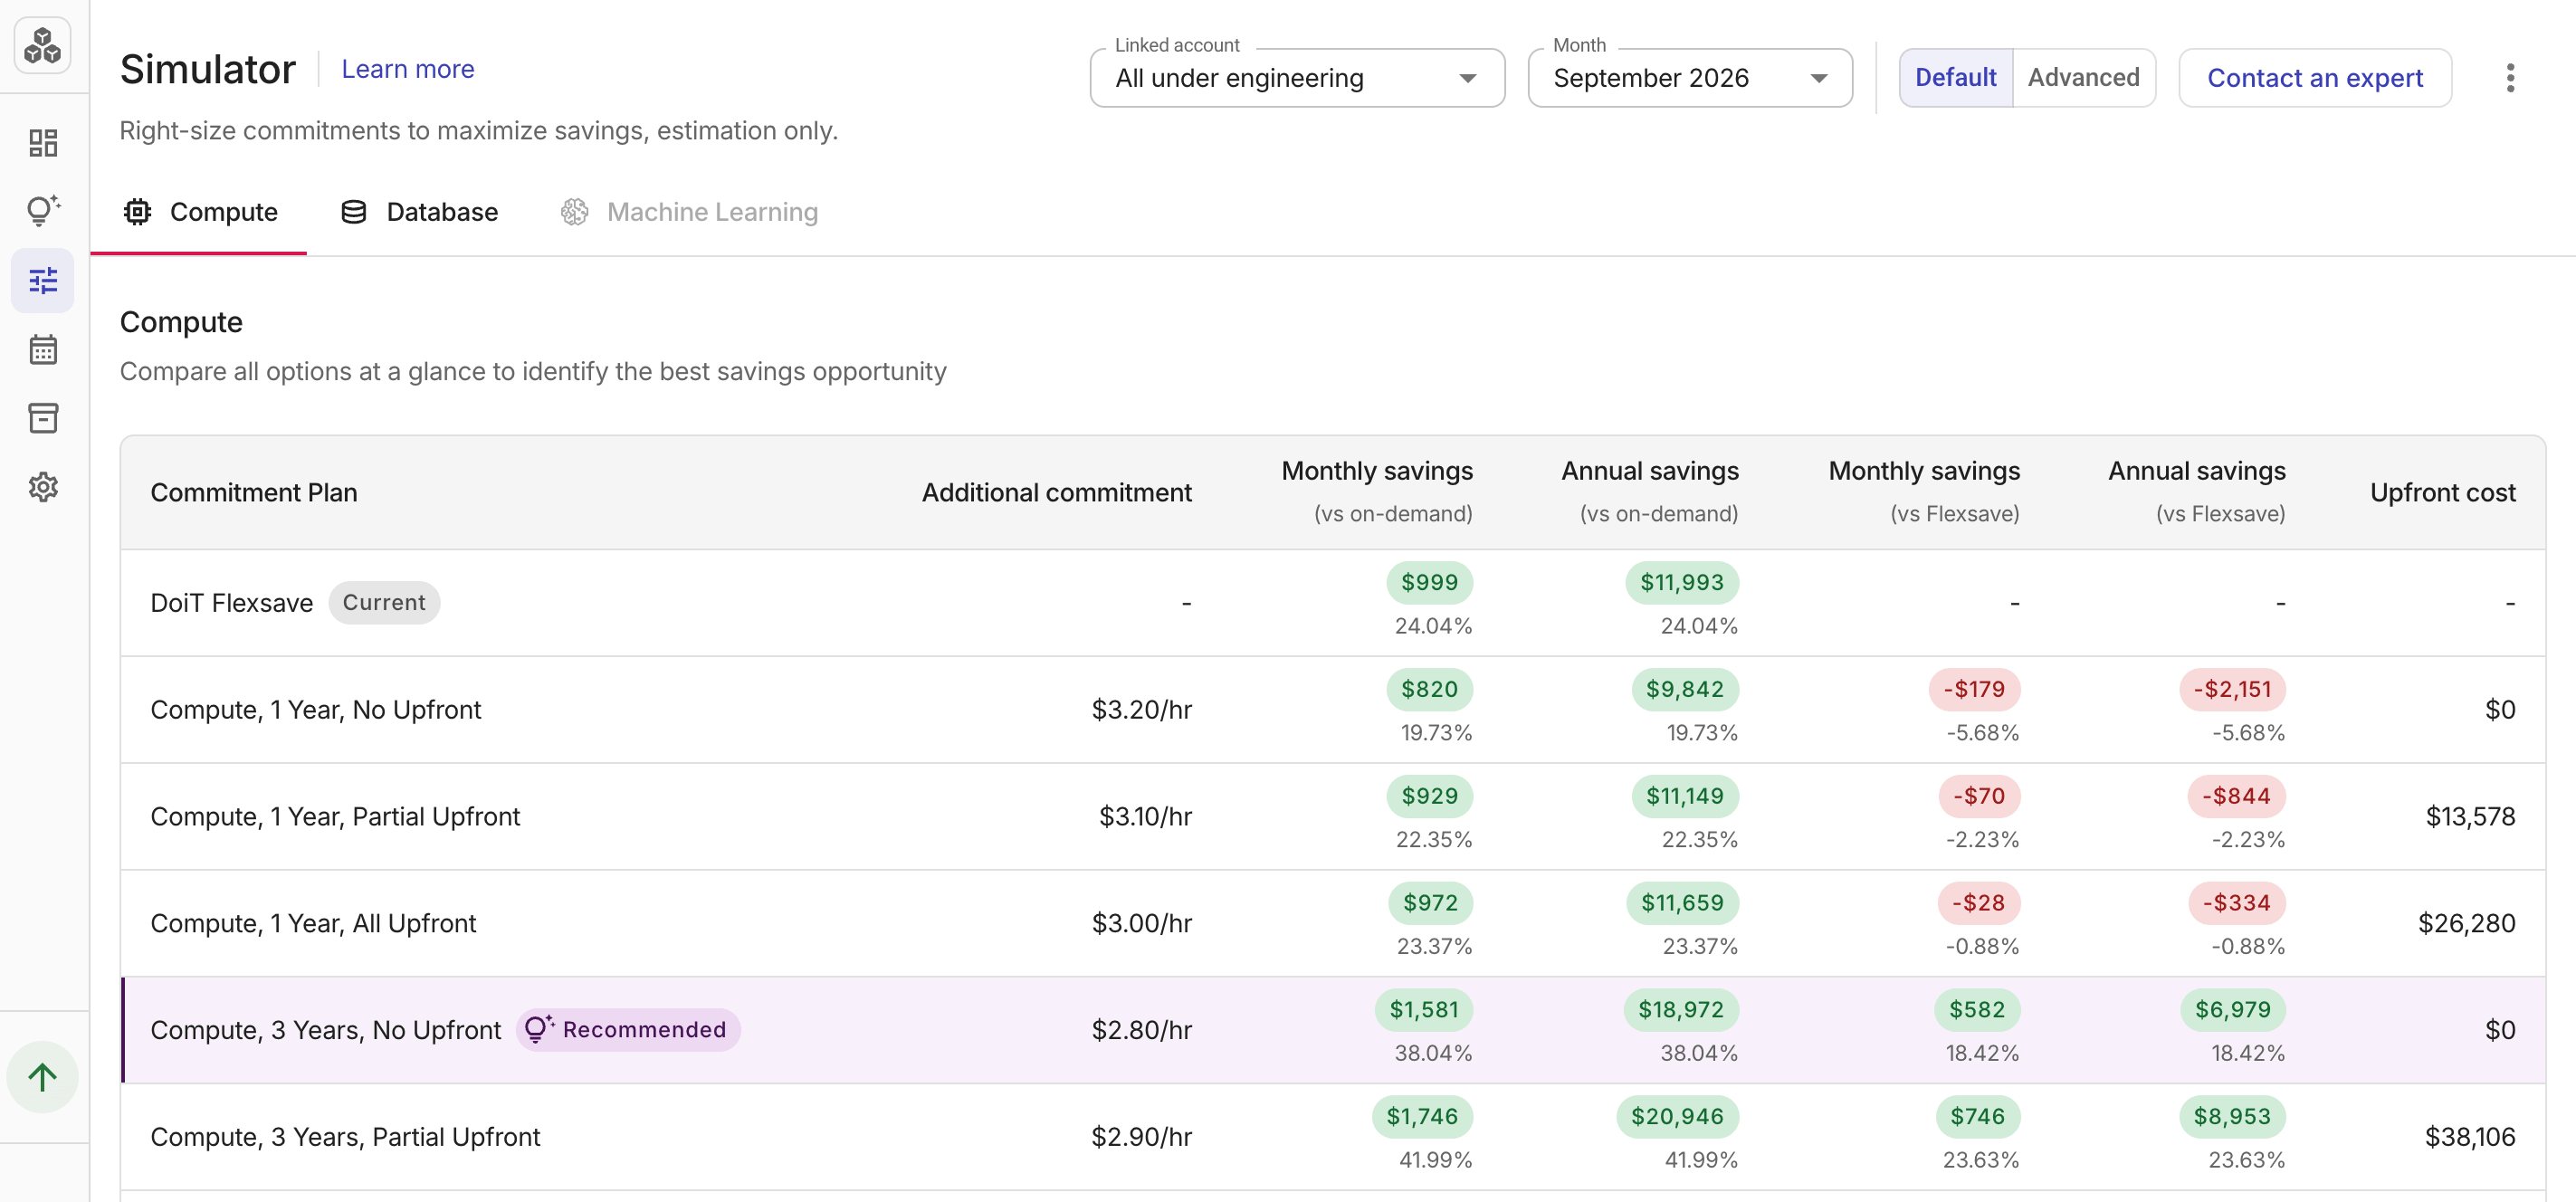
The summary table compares commitment options for the selected account, month, and commitment type.
-
Commitment Plan: Commitment Plan and term.
-
The commitment that would have been best for the selected month is marked as
Recommended. -
AWS Savings Plans include a payment option,
No Upfront,Partial Upfront, orAll Upfront.
-
-
Additional commitment: The $/hr commitment at the optimal point that would have produced the greatest savings, based on actual past usage.
-
Monthly savings (vs On-Demand): Estimated monthly savings compared with on-demand pricing.
-
Annual savings (vs On-Demand): Estimated annual savings compared with on-demand pricing.
-
Upfront cost (AWS only): One-time payment at purchase.
For AWS, when Flexsave for Compute is active, the comparison table also shows:
-
A DoiT Flexsave row with its savings versus on-demand.
-
Monthly savings (vs Flexsave): Estimated monthly savings compared with Flexsave.
-
Annual savings (vs Flexsave): Estimated annual savings compared with Flexsave.
Analysis
In the Default mode, below the summary table, you'll see an analysis chart and commitment table, one option at a time.
Analysis charts
The ideal commitment maximizes covered spend while keeping uncovered and wasted spend as low as possible. In practice, a small amount of uncovered spend is preferable to wasted spend.
On an analysis chart:
-
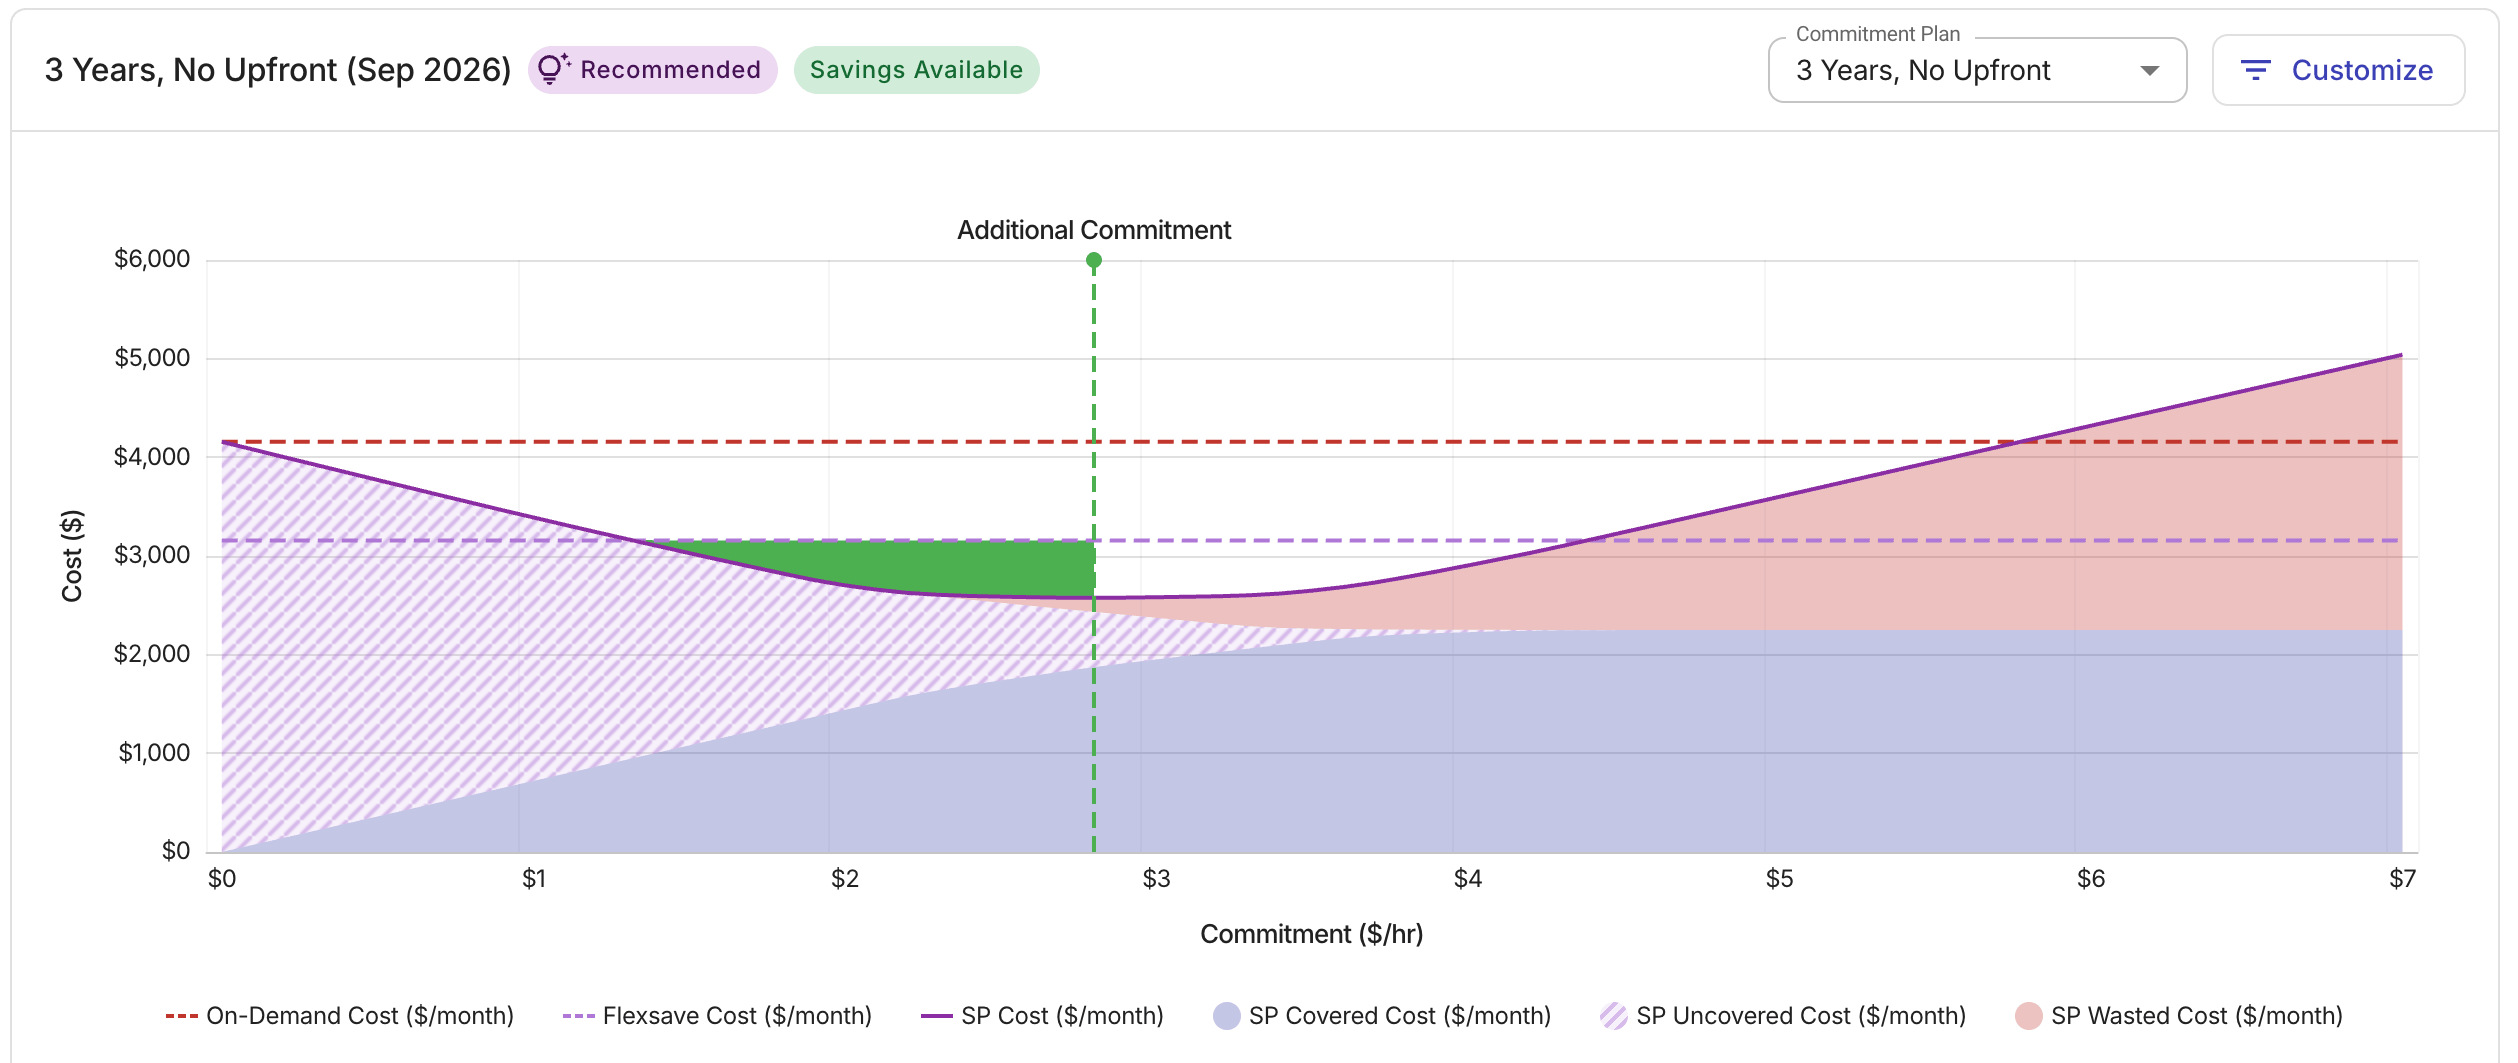
The X-axis shows the hourly commitment, the Y-axis shows the total monthly cost, and the Additional Commitment line marks the optimal commitment.
-
A green shaded area highlights where the commitment plan outperforms Flexsave (on AWS) or on-demand pricing (on Google Cloud).
Use the Commitment Plan dropdown to switch between commitments, or select Customize to show or hide individual chart series. The selected plan is stored in the URL as a plan query parameter. When the account, month, tab, or region changes, the plan selection resets to the default.
- AWS
- Google Cloud
For each term and payment option, the AWS chart answers: What would I have paid in the selected month if I had committed $X/hr on a Savings Plan?
-
On-Demand Cost: Baseline monthly cost at full on-demand rates (without Flexsave).
-
Flexsave Cost: Monthly cost under Flexsave (visible only if Flexsave is active).
-
SP Cost: Total monthly cost at a given hourly commitment (
SP Covered+SP Uncovered+SP Wasted). -
SP Covered Cost: Usage billed at discounted Savings Plan rates within the commitment budget.
-
SP Uncovered Cost: Usage beyond the commitment budget, billed at on-demand rates.
-
SP Wasted Cost: Commitment budget with no usage to cover.
-
Upfront Cost: One-time payment at purchase.
Follow the SP Cost line from left to right:
-
At $0/hr, it starts at the on-demand baseline.
-
As commitment increases, the line drops while discounted usage grows.
-
At the vertical dashed line, total cost is lowest.
-
Past that point, additional commitment is mostly wasted.
Hovering over any point on a chart reveals the cost breakdown at that hourly commitment.
For each term, the Google Cloud chart answers: What would I have paid in the selected month if I had committed $X/hr on a spend-based CUD?
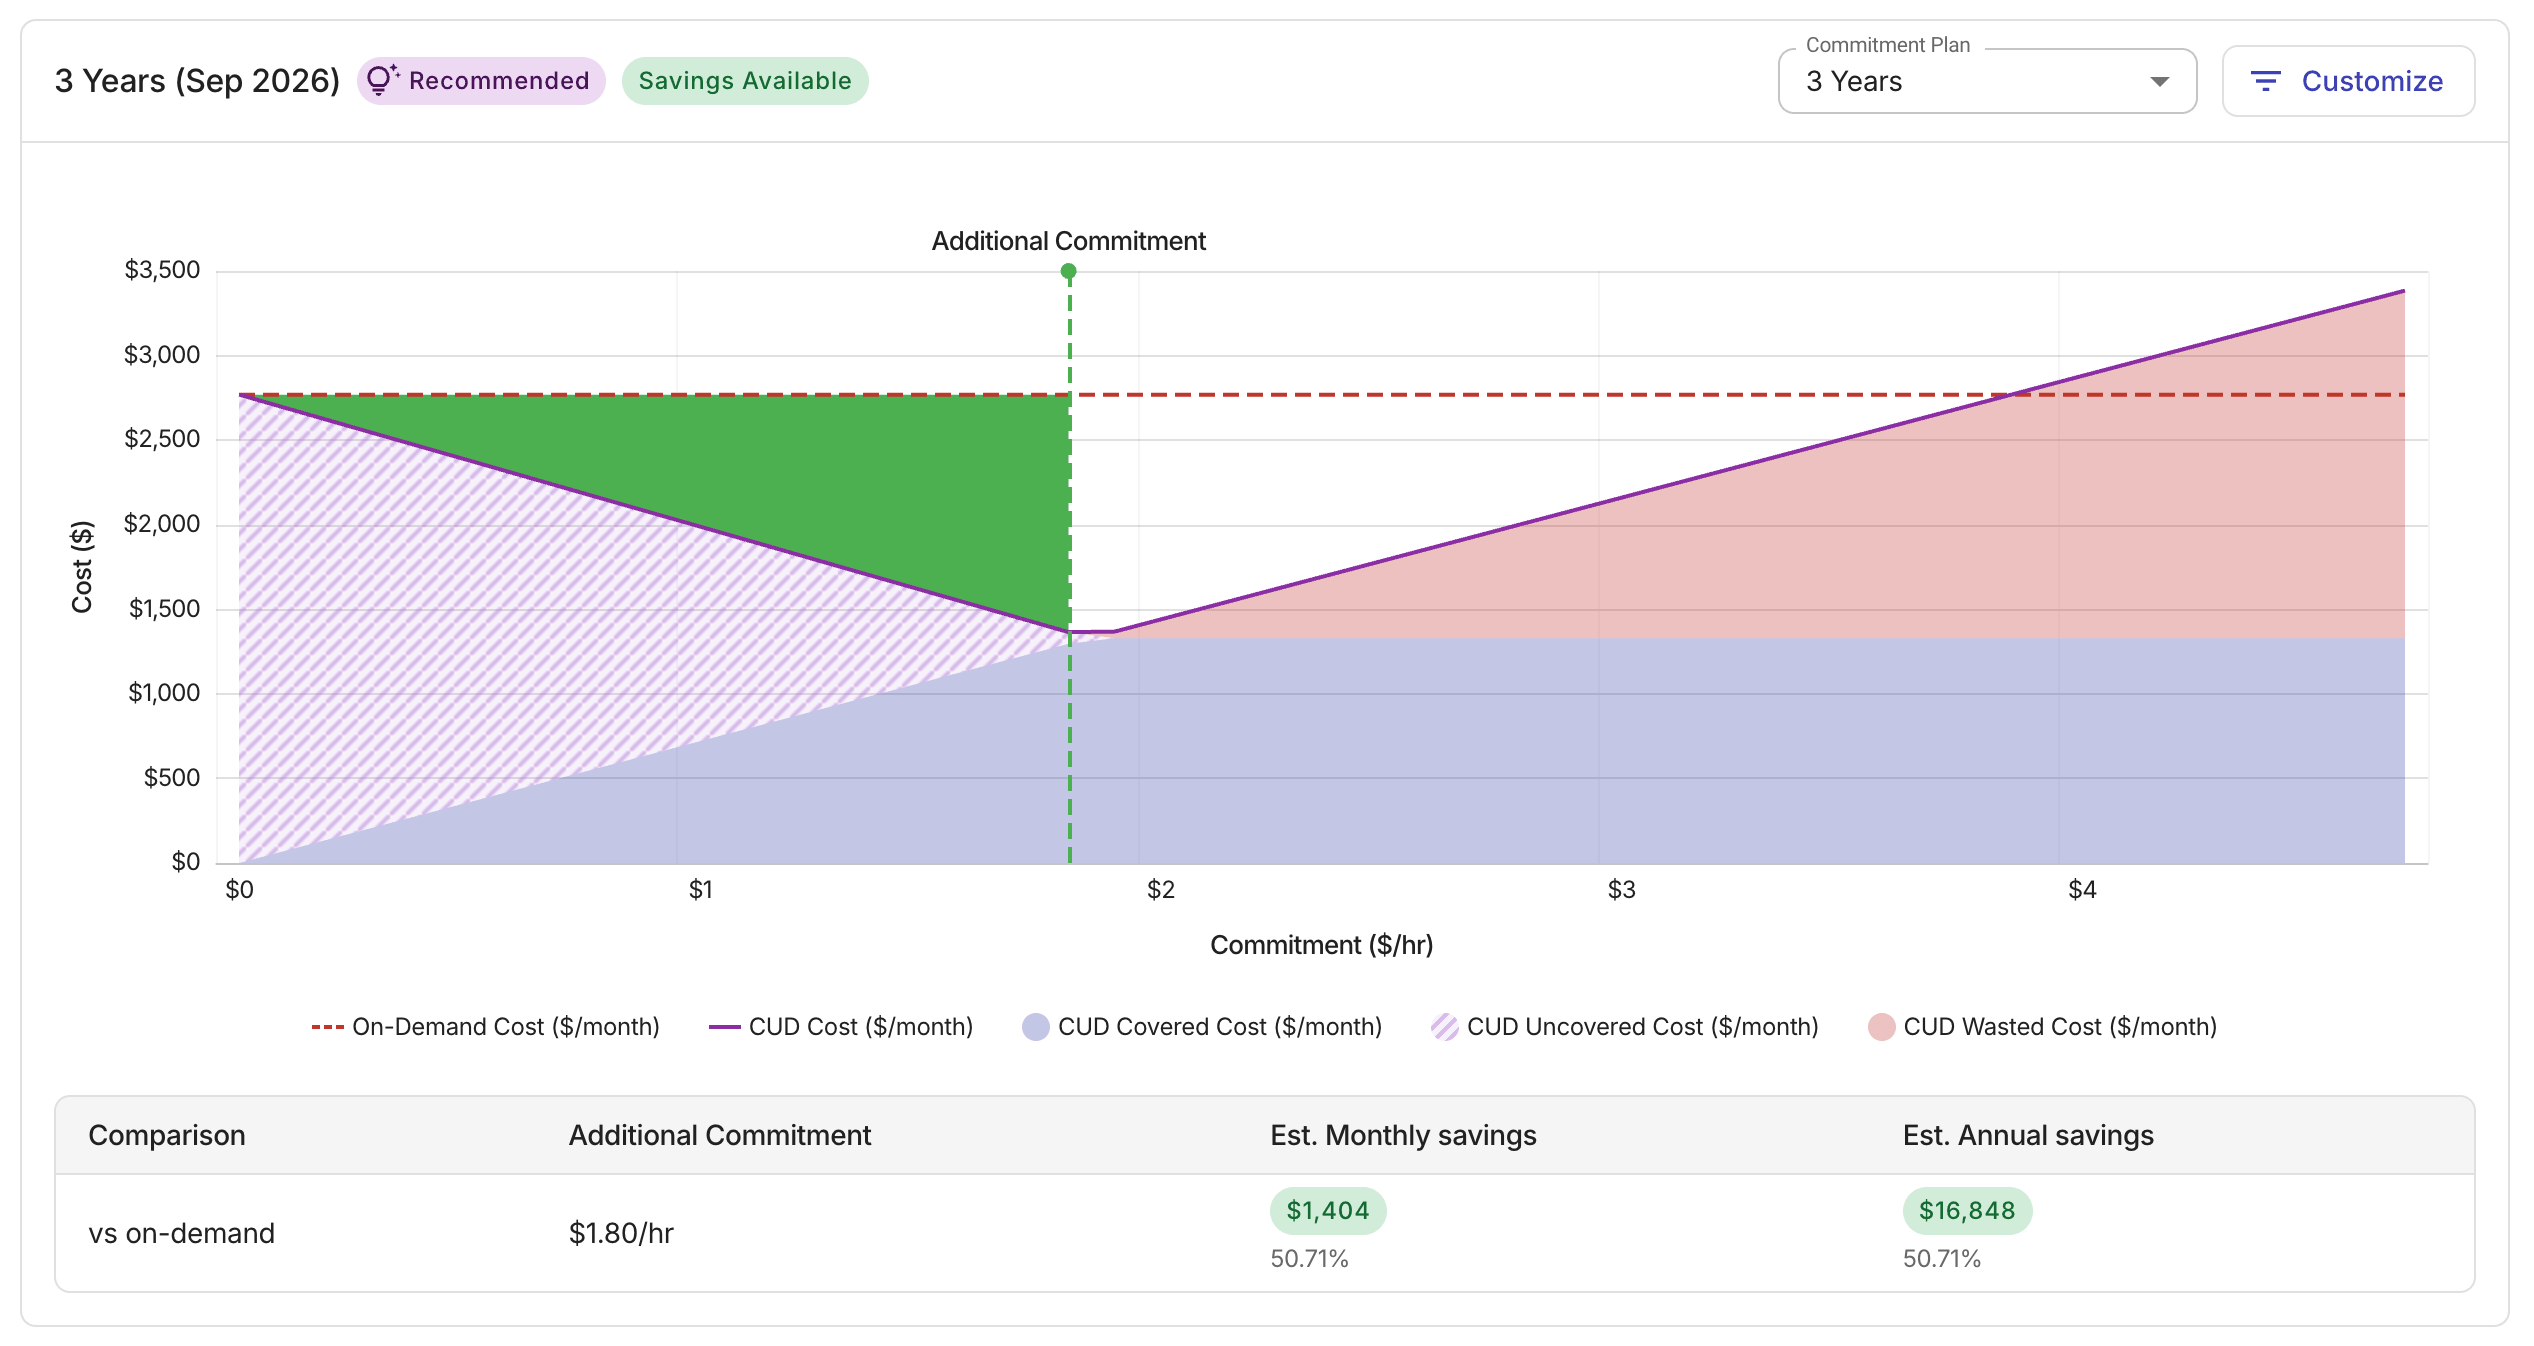
The optimal commitment shows what would have been best for the selected month. It is not a purchase recommendation.
Usage patterns can change from month to month, and commitments generally cannot be canceled. Committing slightly below the optimal captures most of the savings with less risk. See Optimal commitment for guidance.
Commitment table
Below the analysis chart, a summary table shows the selected commitment's figures:

-
Comparison: The baseline used for the savings calculation: vs On-Demand or vs Flexsave (AWS only, when Flexsave is active).
-
Additional Commitment: The optimal hourly commitment for the plan ($/hr).
-
Upfront cost: One-time payment at purchase (AWS only).
-
Est. Monthly savings: Estimated monthly savings at the optimal commitment, shown as a colored pill with the savings percentage.
-
Est. Annual savings: Estimated annual savings at the optimal commitment.