コンプライアンス ビュー
コンプライアンス ビューでは、アカウントが CIS や AWS Well-Architected などのコンプライアンス フレームワークにどのようにマッピングされているかを表示します。コンプライアンス率が最も低いフレームワークを優先的に対応するために使用します。
このビューは、Compliance カテゴリが選択されている場合にのみ利用できます。他のインサイト カテゴリにはフレームワーク ビューはありません。
コンプライアンス ビューに切り替える
インサイト ダッシュボードでサイドバーの Compliance を選択し、ビュー切り替えボタンで Compliance view を選択します。
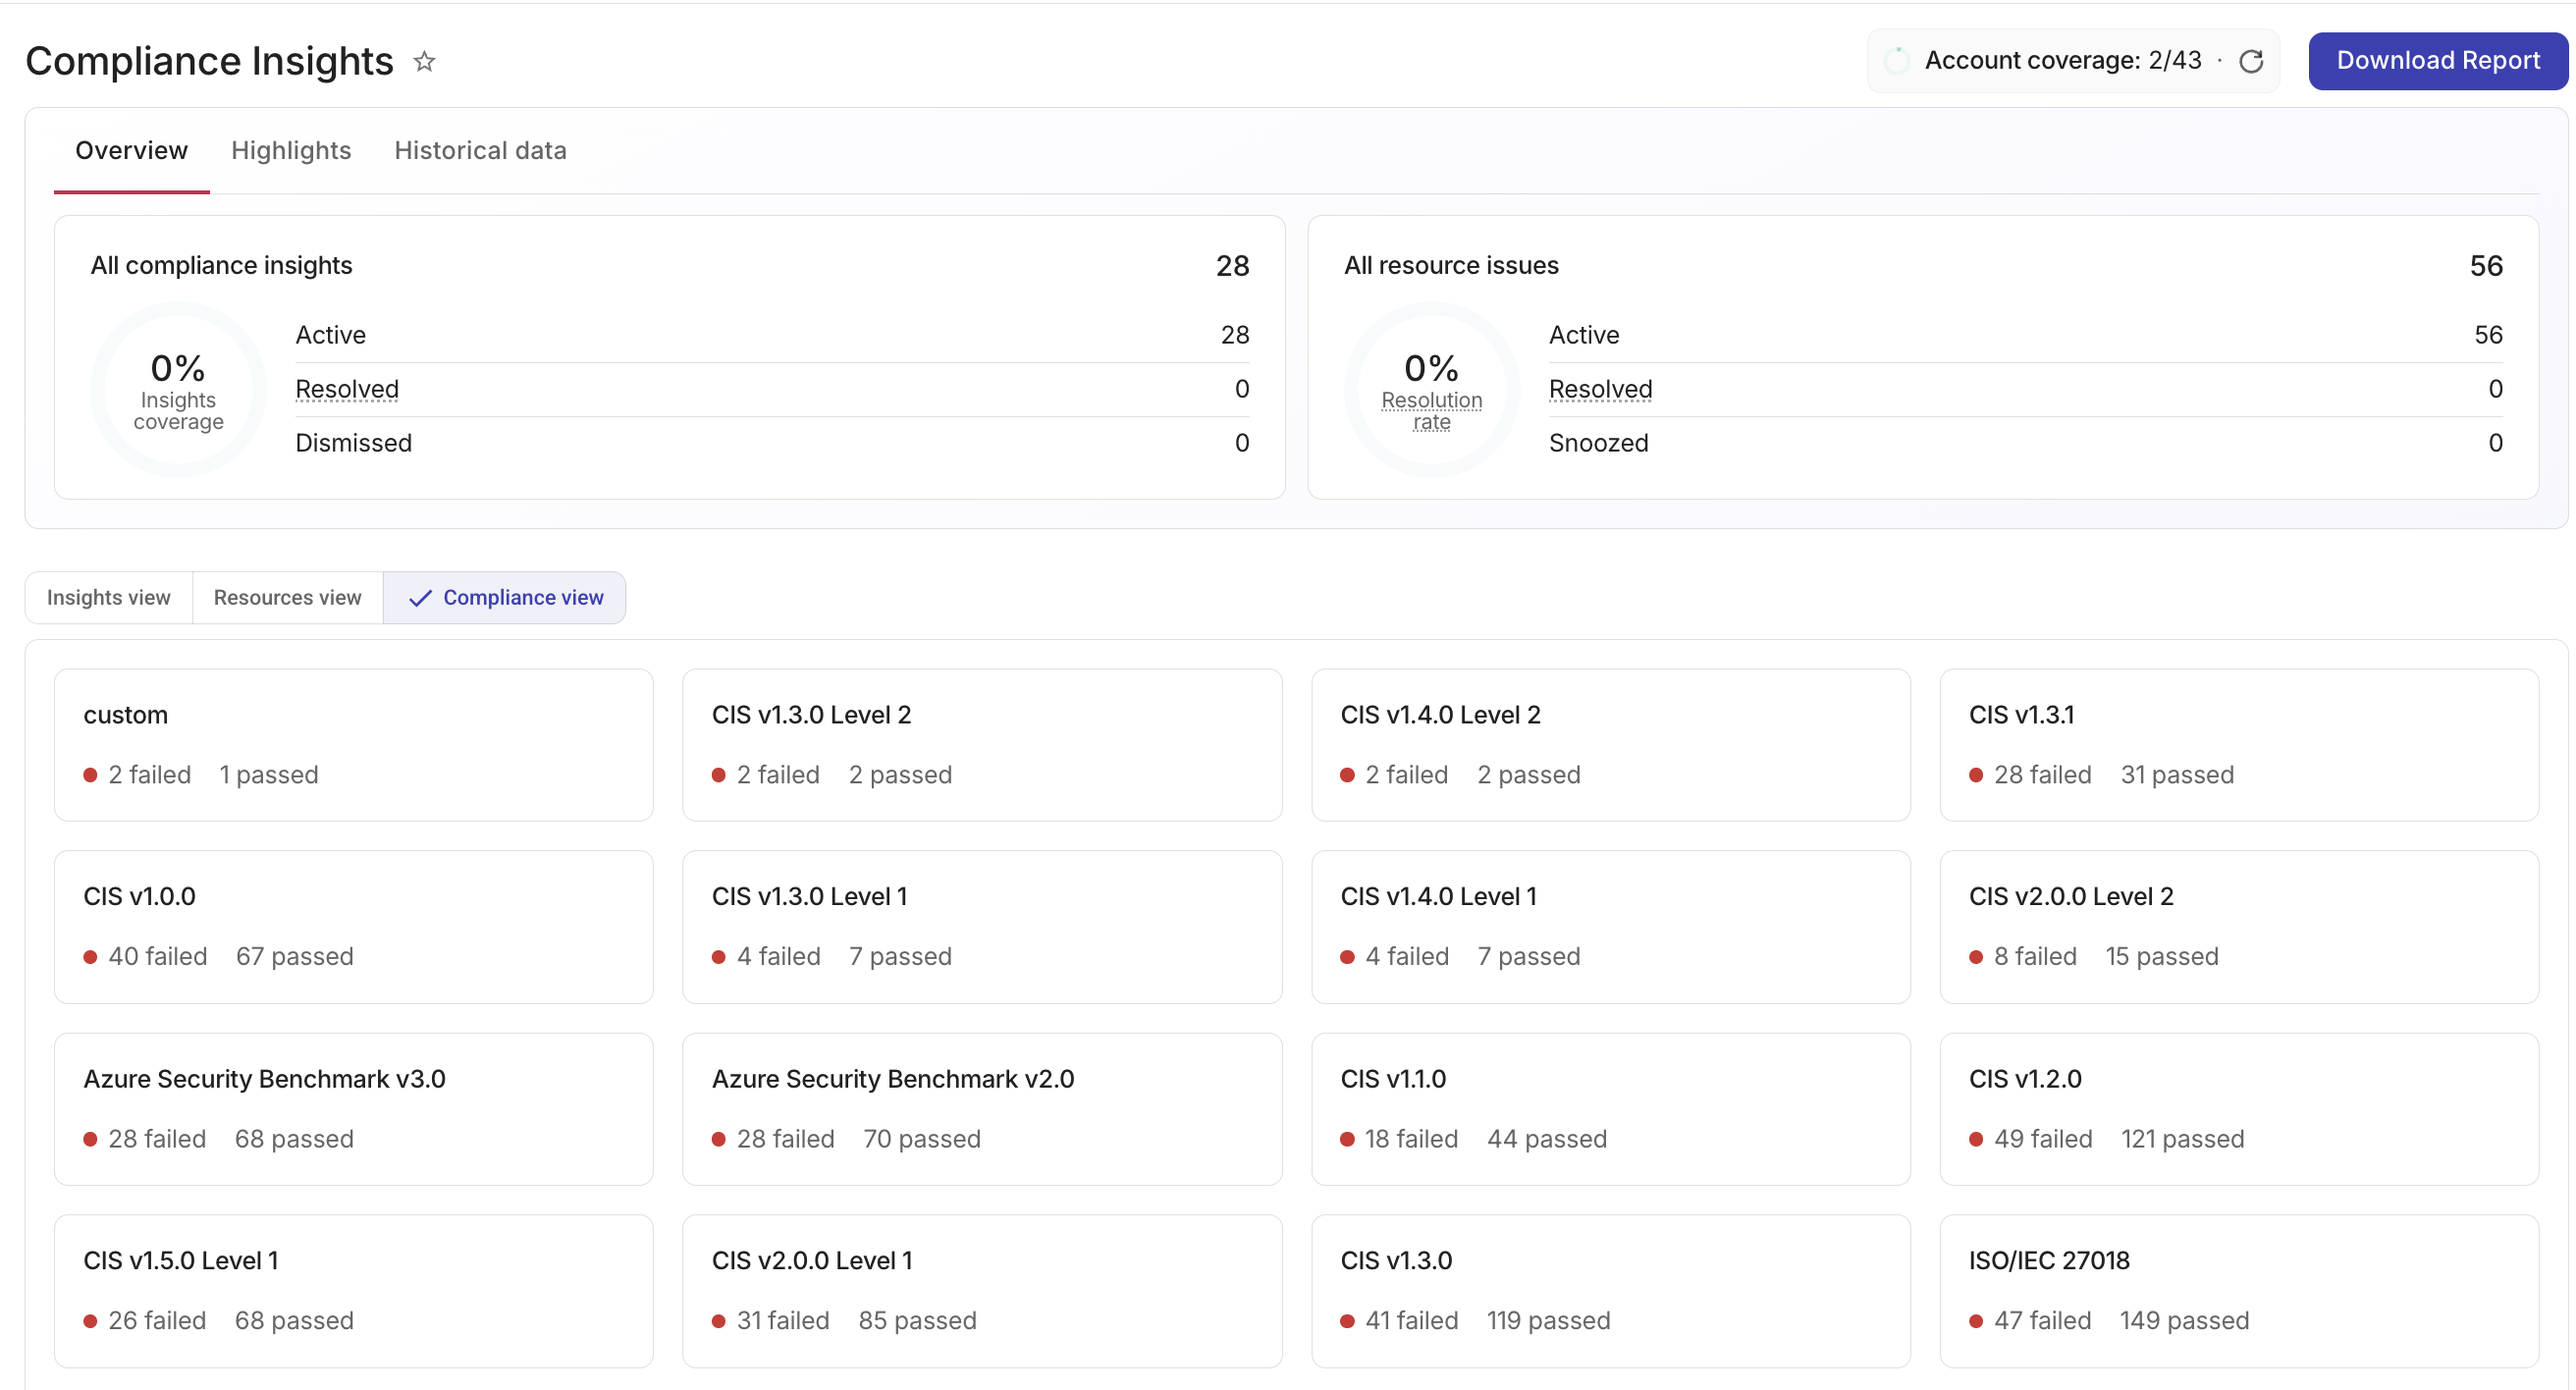
カードは Compliance rate の昇順で一覧表示されるため、最もコンプライアンスが低いフレームワークが最初に表示されます。カードをフィルターまたはソートすることはできません。ページネーションを使用してフレームワークを閲覧してください。結果は Insights scope で選択されているアカウントでフィルタリングされます。アカウントが選択されていない場合は、接続されているすべてのアカウントの結果が含まれます。
各カードには次の情報が含まれます。
-
Framework name: コンプライアンス フレームワークの名前。長い名前は省略されます。
-
Failed: そのフレームワークに対するアクティブ(非準拠)の結果数。
-
Passed: そのフレームワークに対する解決済み(準拠)の結果数。
-
Compliance rate: 準拠している結果のパーセンテージを、色分けされたプログレスバーで表示します。
- 緑: 80% 以上
- オレンジ: 50% 〜 79%
- 赤: 50% 未満
Compliance カテゴリを選択したままでも、Insights view や Resources view に切り替えることができます。
コンプライアンス レポートをダウンロードする
現在のコンプライアンス状況のスナップショットを PDF または CSV ファイルとしてダウンロードできます。Download Report ボタンは、ビュー種別(Insights view・Resources view・Compliance view)に関係なく、Compliance カテゴリが選択されているときは常に表示されます。
レポートをダウンロードするには、次の手順を実行してください。
-
Download Report を選択します。
-
Download Compliance Report でレポートのスコープを設定します。
-
Accounts: 含めるアカウントを 1 つ以上選択します。リストには、現在 Insights scope で選択されているアカウントがあらかじめ入力されます。すべてのアカウントを含める場合は、選択を空のままにします。
-
Severities: フィルター対象とする重要度レベル(Critical、High、Medium、Low)を 1 つ以上選択します。すべての重要度を含める場合は、選択を空のままにします。
-
-
Output type で PDF または CSV を選択します。
-
Download PDF または Download CSV を選択します。
ファイルはブラウザに直接ダウンロードされます。ダウンロードに失敗した場合はダイアログにエラーメッセージが表示され、もう一度試すことができます。
フレームワークの詳細
フレームワーク カードを選択してそのフレームワークの詳細を開くか、Insights view の Compliance frameworks 列でフレームワークのチップ、または +N more 内のフレームワーク名を選択します。
ページ上部のパンくずリストから、Insights ダッシュボードや Compliance カテゴリに戻ることができます。
概要
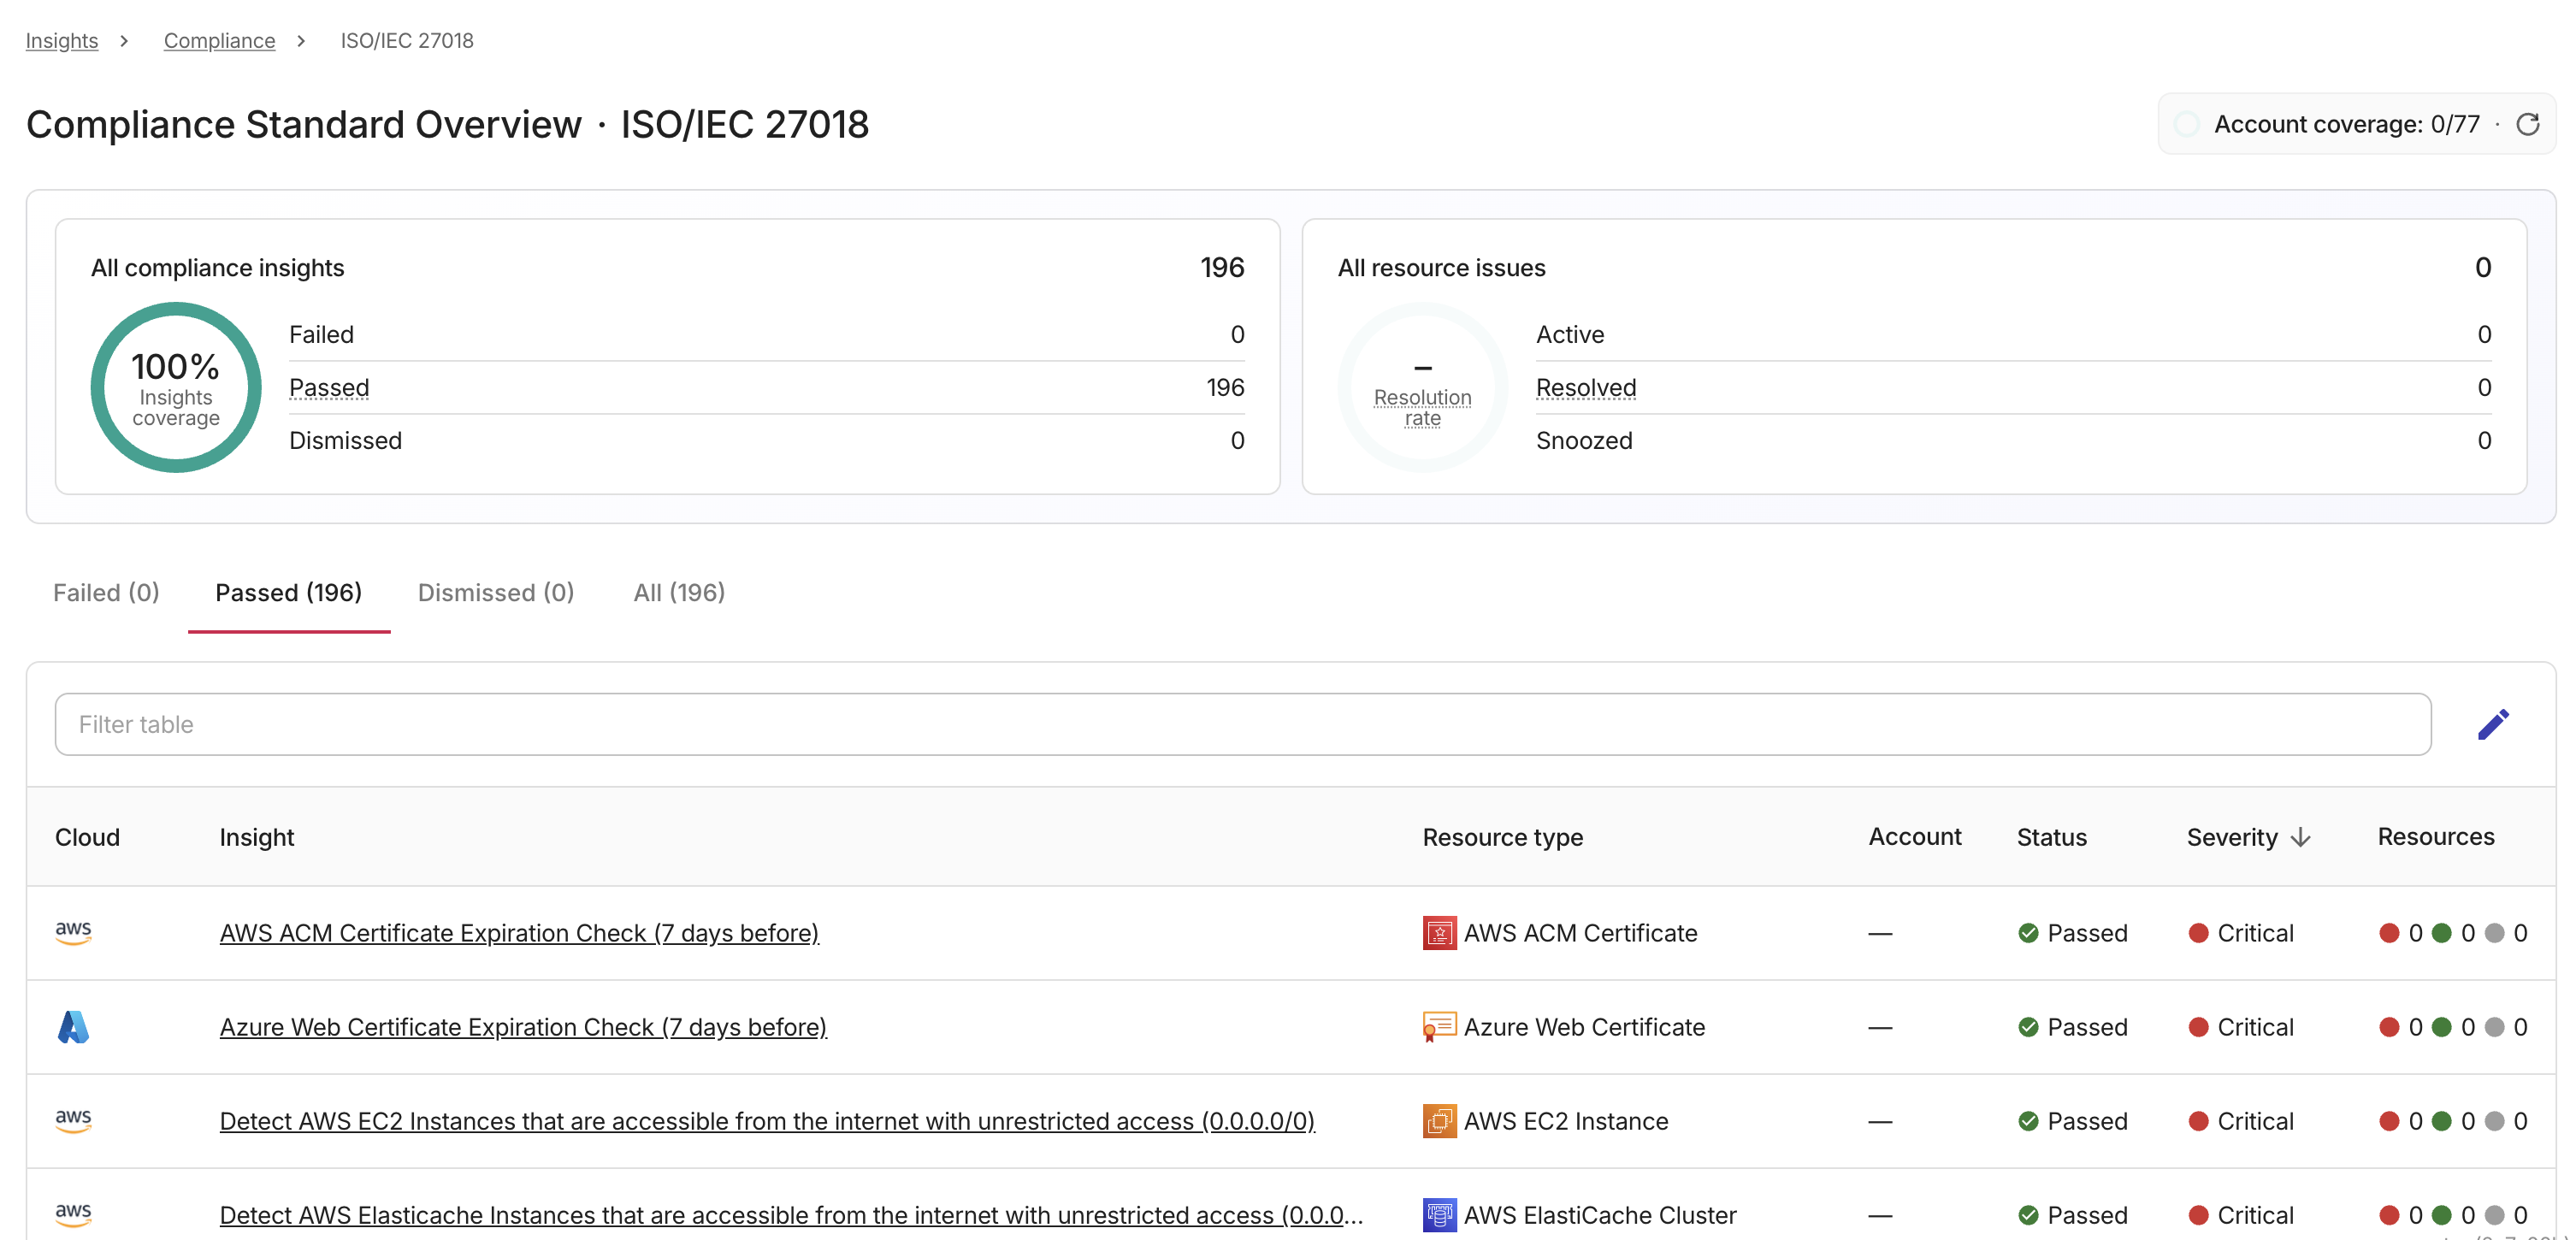
Overview タブには、選択したフレームワークをスコープとして、インサイト ダッシュボードの Overview と同じカバレッジ チャートが表示されます。
-
Insights coverage: フレームワークのインサイトのうち評価済みの割合を、ステータス別(Failed、Passed、Dismissed)に分解して表示します。
-
Resolution rate: このフレームワークのインサイトに対して解決されたリソースの問題の割合を、ステータス別に分解して表示します。
このページでは、標準の Active および Resolved ラベルは Failed および Passed として表示されます。Highlights および Historical data タブは利用できません。
フレームワークの結果
概要メトリクスの下には、選択したフレームワークにリンクされているすべてのインサイト(これまで一度もトリガーされていないインサイトを含む)がテーブルで一覧表示されます。
テーブル上部のタブを使用して、ステータス別にインサイトをフィルタリングできます。各タブのラベルには、一致するインサイト数が含まれます。
-
Failed: アクティブ(非準拠)の結果があるインサイト。デフォルトのタブです。
-
Passed: すべての結果が解決済み(準拠)であるインサイト。これまで一度もトリガーされていないインサイトも含まれます。
-
Dismissed: 破棄されたインサイト。
-
All: ステータスに関係なくすべてのインサイト。
タブを切り替えると、テーブルはページ 1 にリセットされます。
テーブルには次の列が表示されます。
-
Cloud: インサイトのクラウド プロバイダのアイコン。
-
Insight: インサイト名。名前を選択すると、インサイト詳細 ページが開きます。
-
Resource type: インサイトの影響を受けるクラウド リソースのタイプ。
-
Status: インサイトのコンプライアンス ステータス(Failed、Passed、Dismissed)。
-
Severity: インサイトの重要度レベル(Critical、High、Medium、Low)。
-
Resources: インサイトに対するアクティブ・解決済み・スヌーズ中のリソース数を色分けして表示するカウンタ。この列はソートできません。
テーブルは、ソート可能な任意の列ヘッダーを選択して並べ替えることができます。デフォルトでは、Severity 列を降順でソートします。フィルター バーの横にある編集アイコンを選択して、列の表示・非表示を切り替えてください。
フィルター バーを使用して、Cloud、Insight、Resource type、Severity で結果を絞り込むことができます。