AI Workload Management
AI Workload Management は、AI ワークロードコストの監視と最適化に役立つ LLM オブザーバビリティ ダッシュボードです。プロンプトキャッシュ、エラー率、リトライのオーバーヘッドに関する主要なメトリクスを可視化し、RAG パイプライン全体にわたる無駄な支出を削減するための実行可能な推奨事項を提供します。
ダッシュボードへのアクセス
AI Workload Management ダッシュボードへアクセスするには、次の手順を実行してください。
-
DoiT コンソール にサインインします。
-
上部ナビゲーションのメガメニューから Workload optimization ・ AI Workload Management を選択します。
-
右上の時間範囲トグルを使用して表示する期間を指定します(過去 24 時間・7 日間・30日間)。
KPI サマリー
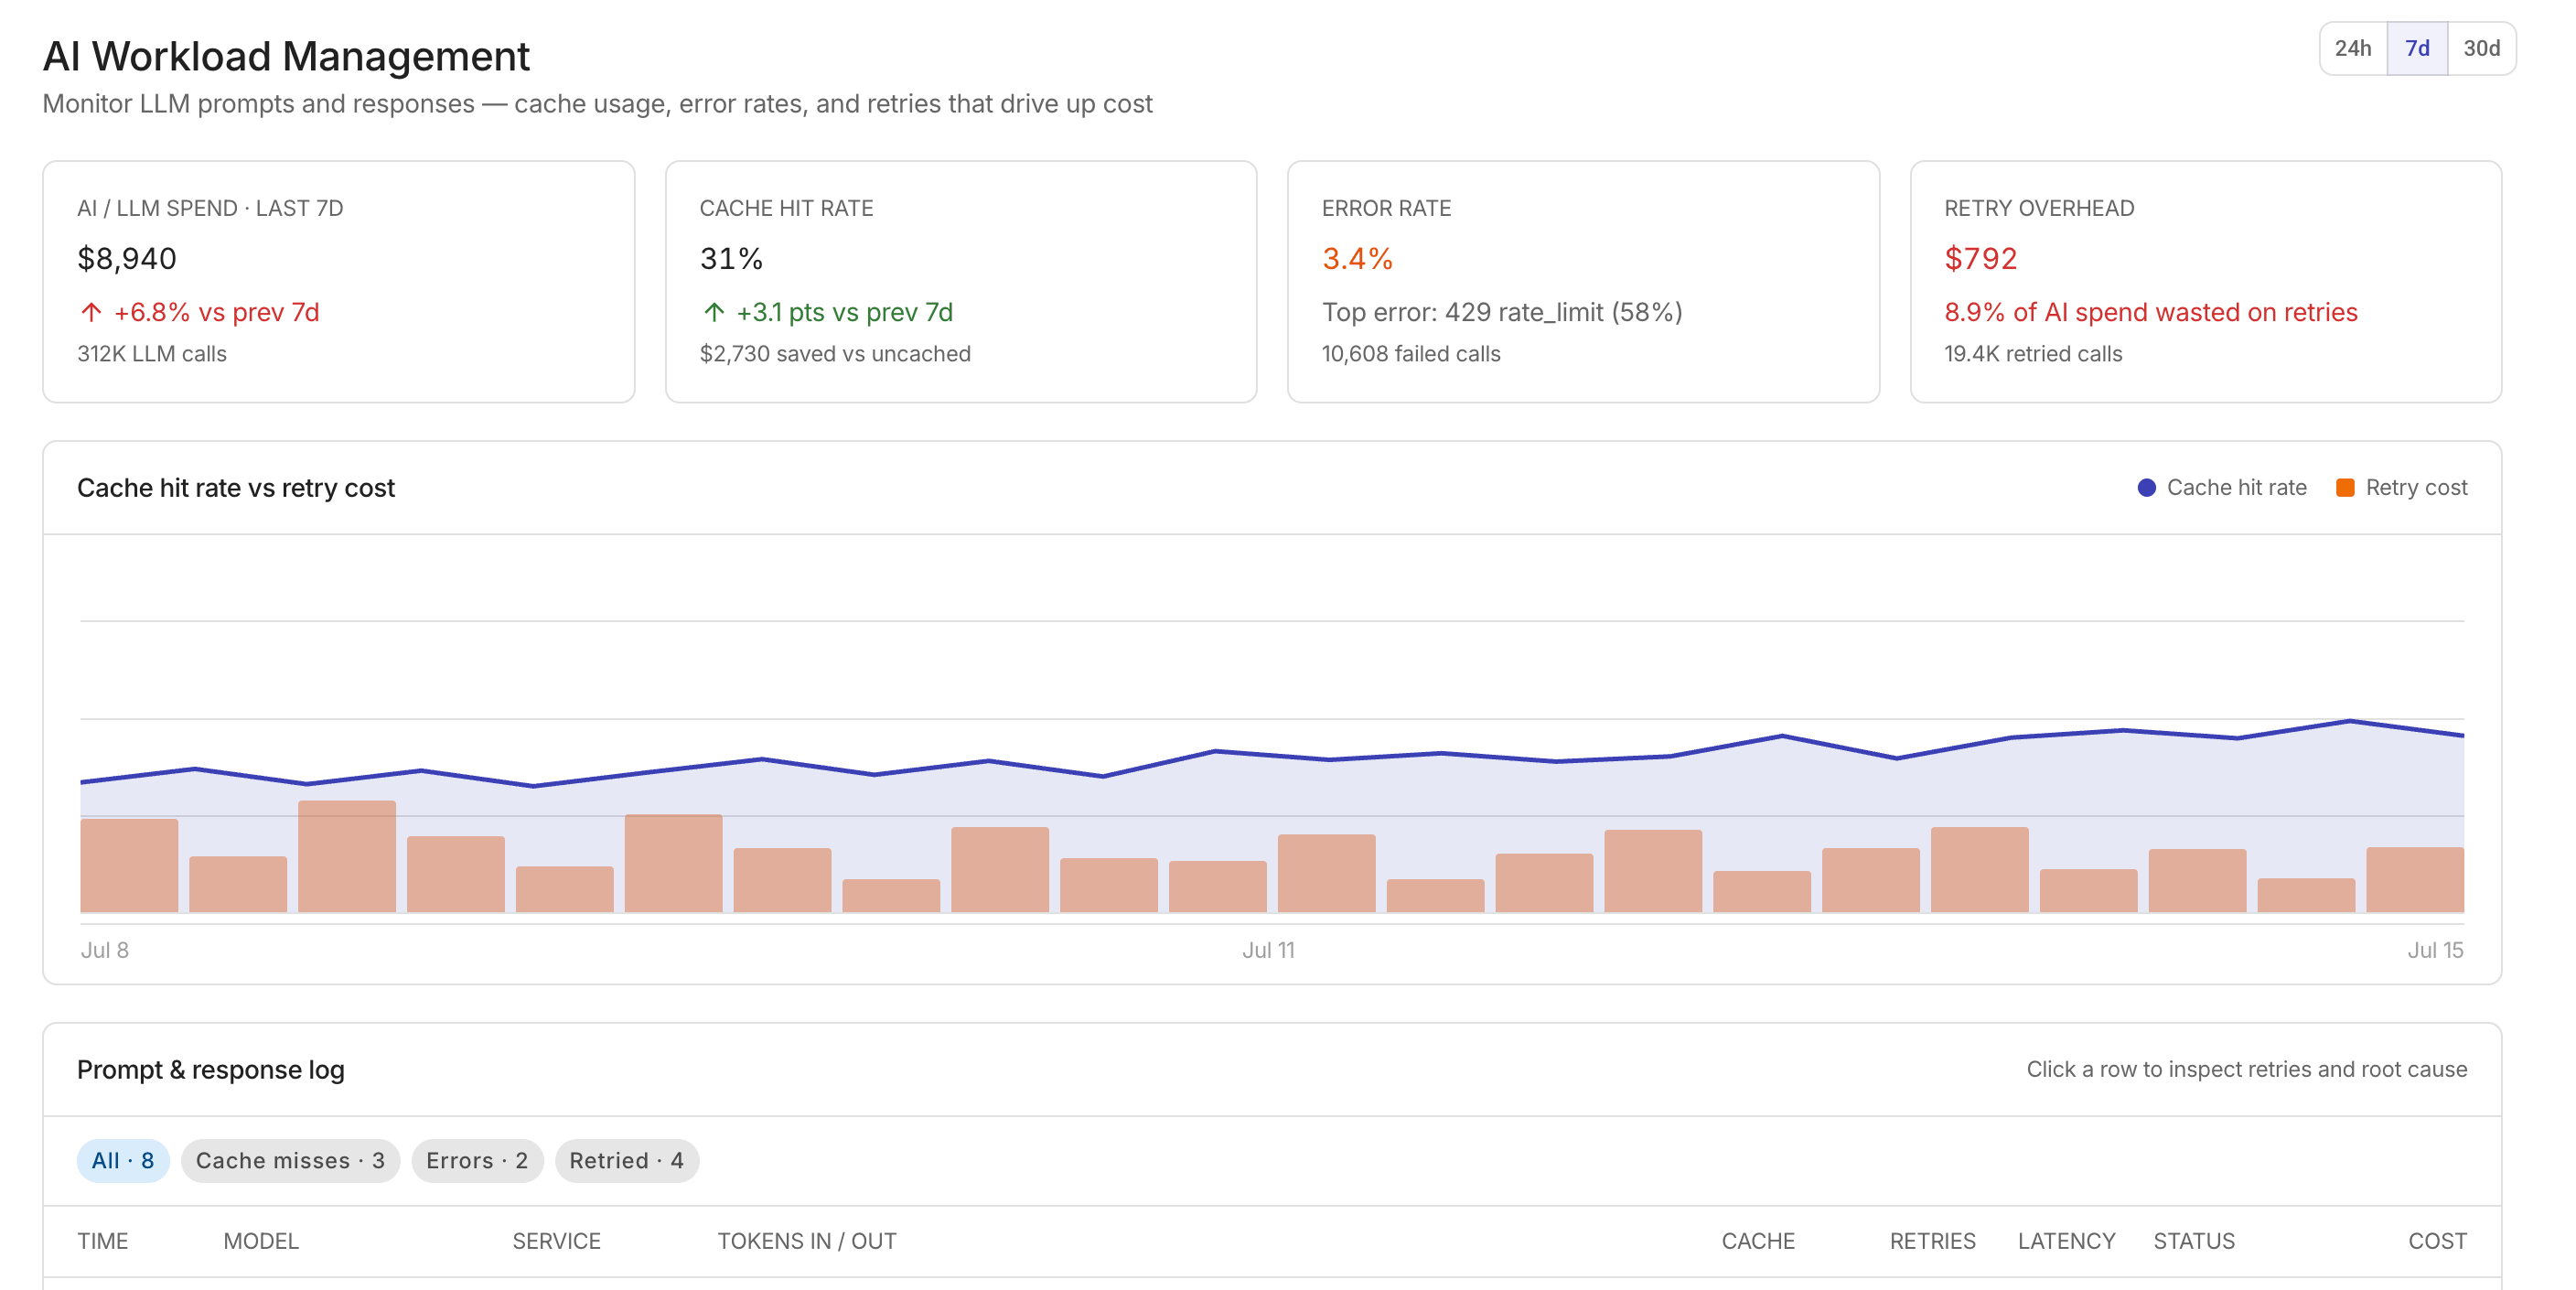
ページ上部にある 4 つの KPI サマリーカードは、AI ワークロードの健全性を一目で把握できるビューを提供します。
-
AI/LLM spend:選択した時間範囲における LLM コールの総支出と、期間比較のトレンド指標および総コール数。
-
Cache hit rate:キャッシュから提供された LLM コールのパーセンテージと、非キャッシュ時と比較した推定コスト削減額。
-
Error rate:エラーとなった LLM コールのパーセンテージ、最も多いエラータイプ、失敗したコールの総数。
-
Retry overhead:リトライされた LLM コールのコストを、絶対値と総 AI 支出に占める割合の両方で表示し、リトライされたコール数も示します。
キャッシュヒット率とリトライコスト
Cache hit rate vs retry cost チャートは、選択した時間範囲におけるキャッシュヒット率とリトライコストを並べてプロットします。これにより、リトライコストの増加と相関するキャッシュパフォーマンスの低下期間を特定できます。
プロンプトとレスポンスのログ
Prompt and response log には、タイムスタンプ、モデル、サービス、トークン数、キャッシュステータス、リトライ回数、レイテンシ、ステータス、コストなどの詳細とともに、個々の LLM コールが一覧表示されます。ログ上部のフィルターチップを使用して表示を絞り込んでください。
-
All:すべてのログエントリを表示。
-
Cache misses:プロンプトがキャッシュから提供されなかったコールのみを表示。
-
Errors:エラーステータスを返したコールのみを表示。
-
Retried:1 回以上リトライが行われたコールのみを表示。
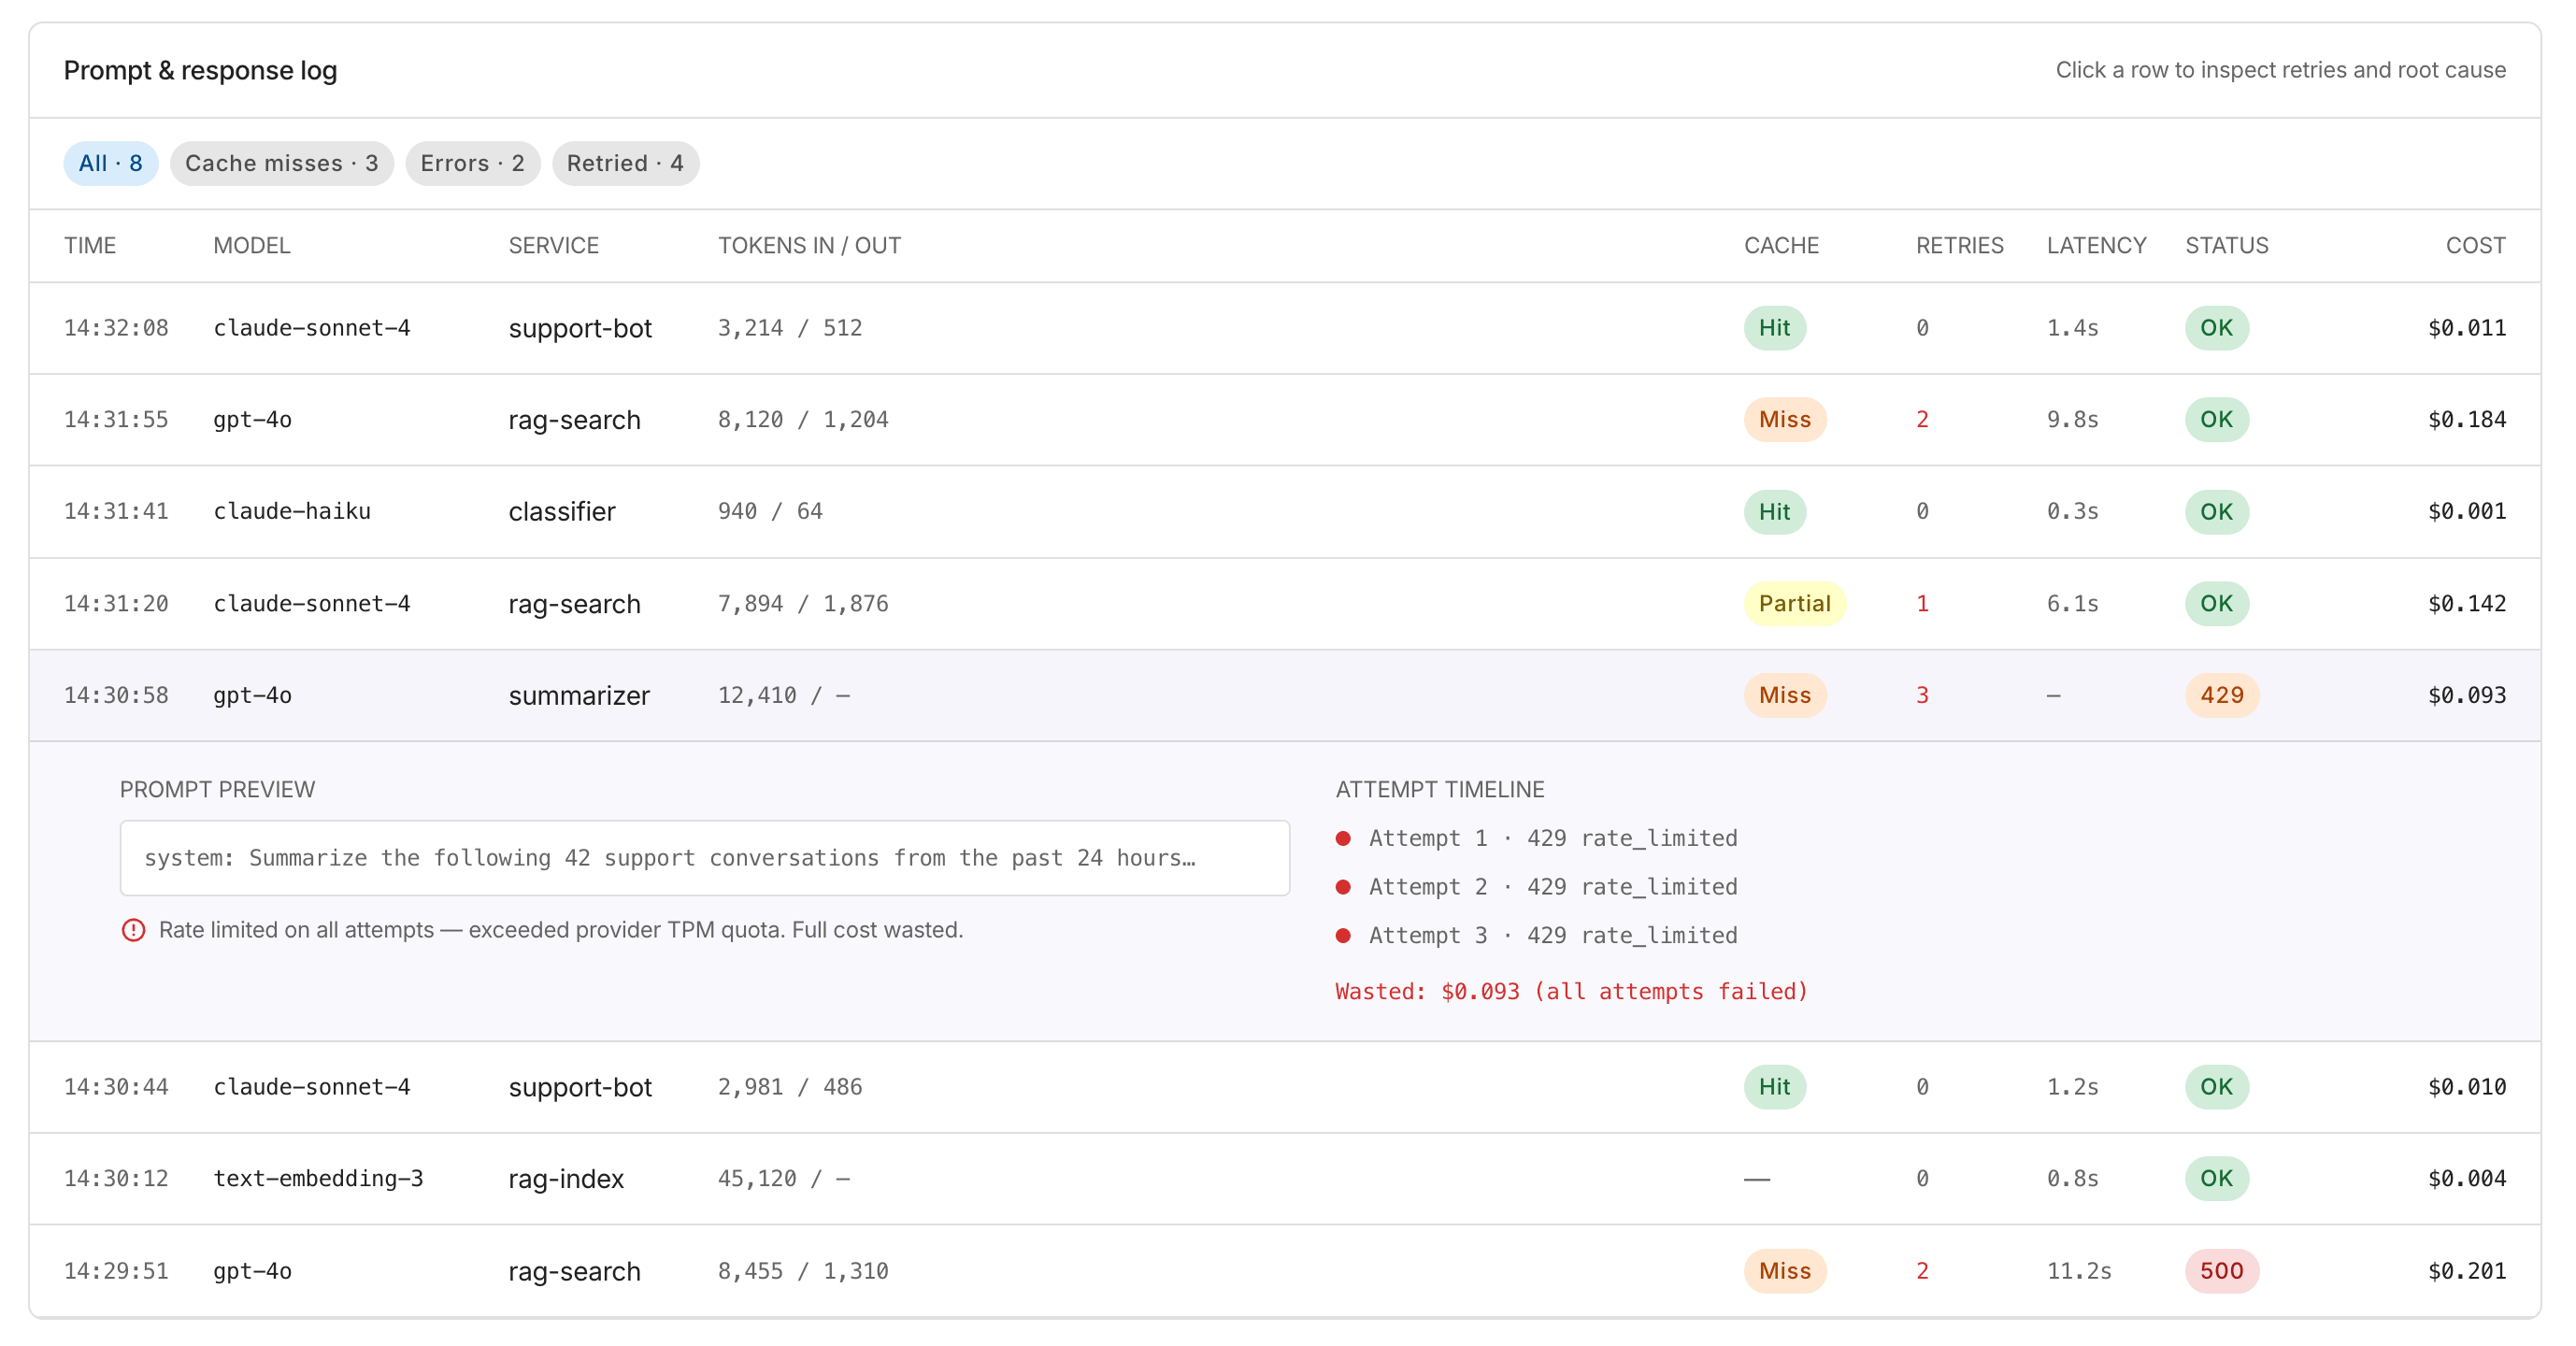
ログエントリを選択すると展開され、追加の詳細が表示されます。
-
Prompt preview:モデルに送信されたプロンプトテキストのプレビュー。
-
Attempt timeline:各試行のステップごとのタイムライン。リトライが発生した場合は、無駄になったコストの内訳が表示され、失敗した試行にどれだけの支出が消費されたかを示します。
RAG パイプラインの最適化
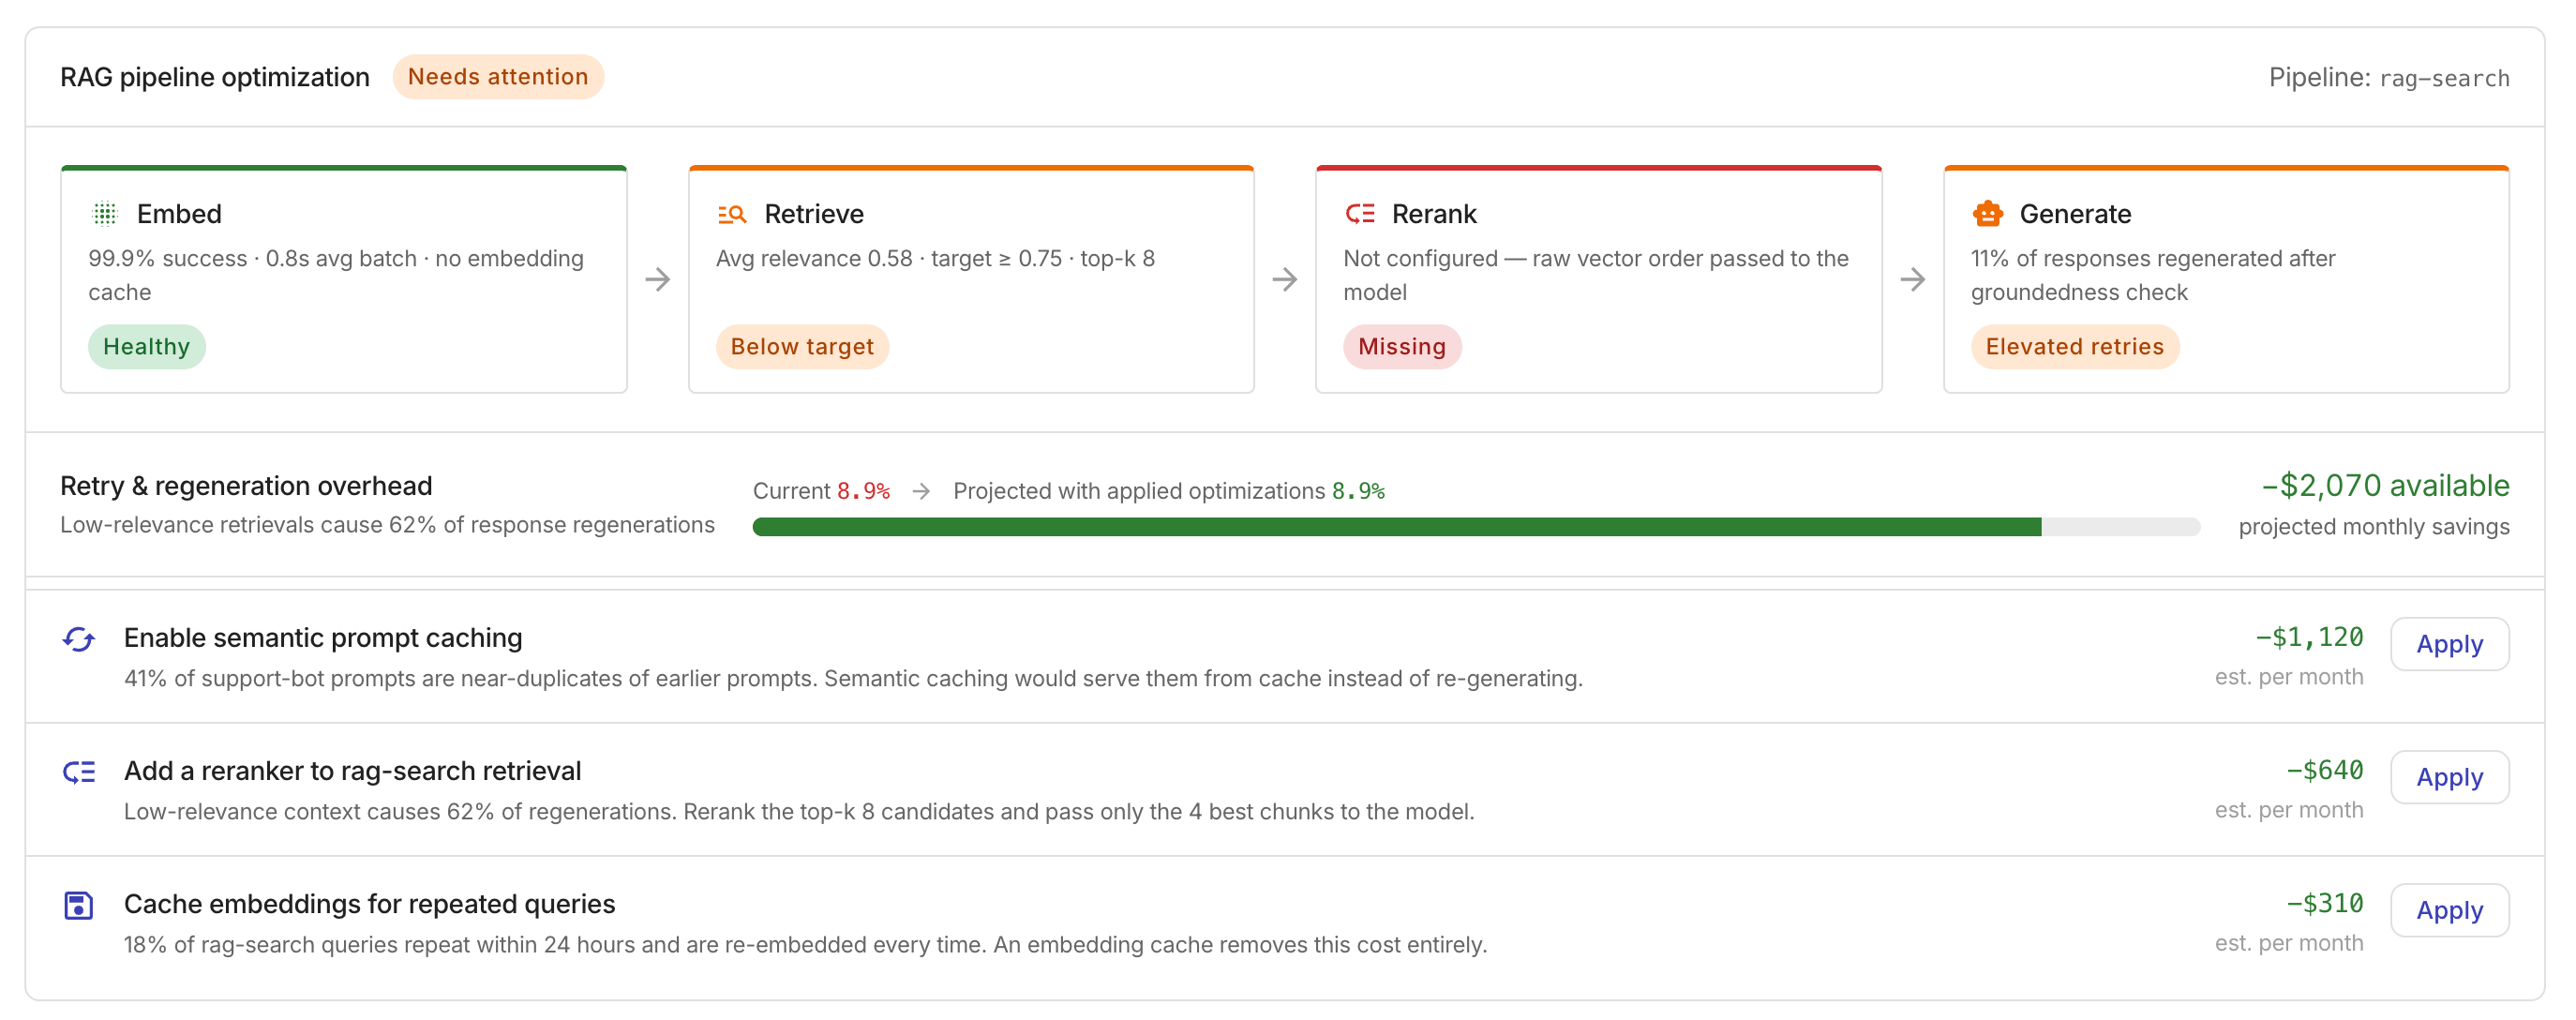
RAG pipeline optimization セクションでは、RAG(Retrieval-Augmented Generation)パイプラインを 4 つのステージで分析し、オーバーヘッドを削減するための推奨事項を提示します。
パイプライン ステージ
各ステージには、ヘルスインジケーターと主要なメトリクスが表示されます。
-
Embed:入力テキストをベクトル埋め込みに変換します。
-
Retrieve:ベクトルストアから関連するドキュメントを取得します。
-
Rerank:生成前に、取得したドキュメントを関連度に基づいて再スコアリングします。
-
Generate:コンテキストを付与した最終プロンプトを LLM に送信し、レスポンスを生成します。
リトライと再生成のオーバーヘッド
Retry & regeneration overhead には、現在のリトライおよび再生成のオーバーヘッドがパーセンテージで表示されます。
推奨事項を適用すると、推定される削減量と想定月次コスト削減額を示す予測オーバーヘッドバーが表示されます。
推奨事項
実行可能な推奨事項が、推定月次コスト削減額とともに一覧表示されます。推奨事項の Apply を選択して、予測オーバーヘッド計算に含めてください。