Cloud Diagrams でコストのアノマリーを表示する
Cloud Diagrams でコストのアノマリーを表示できます。システム内のさまざまな領域を探し回る代わりに、コストのアノマリーを一箇所で即座にコンテキスト付きで確認できます。これは、予期しないコストスパイクのトラブルシューティングや、チーム内での明確なコミュニケーションに役立ちます。
必要な権限
Cloud Diagrams を使用するには、DoiT アカウントに Cloud Diagram User 権限が必要です。
アカウントまたはプロジェクトのコストのアノマリーを表示する
アカウントまたはプロジェクトのコストのアノマリーを表示するには:
-
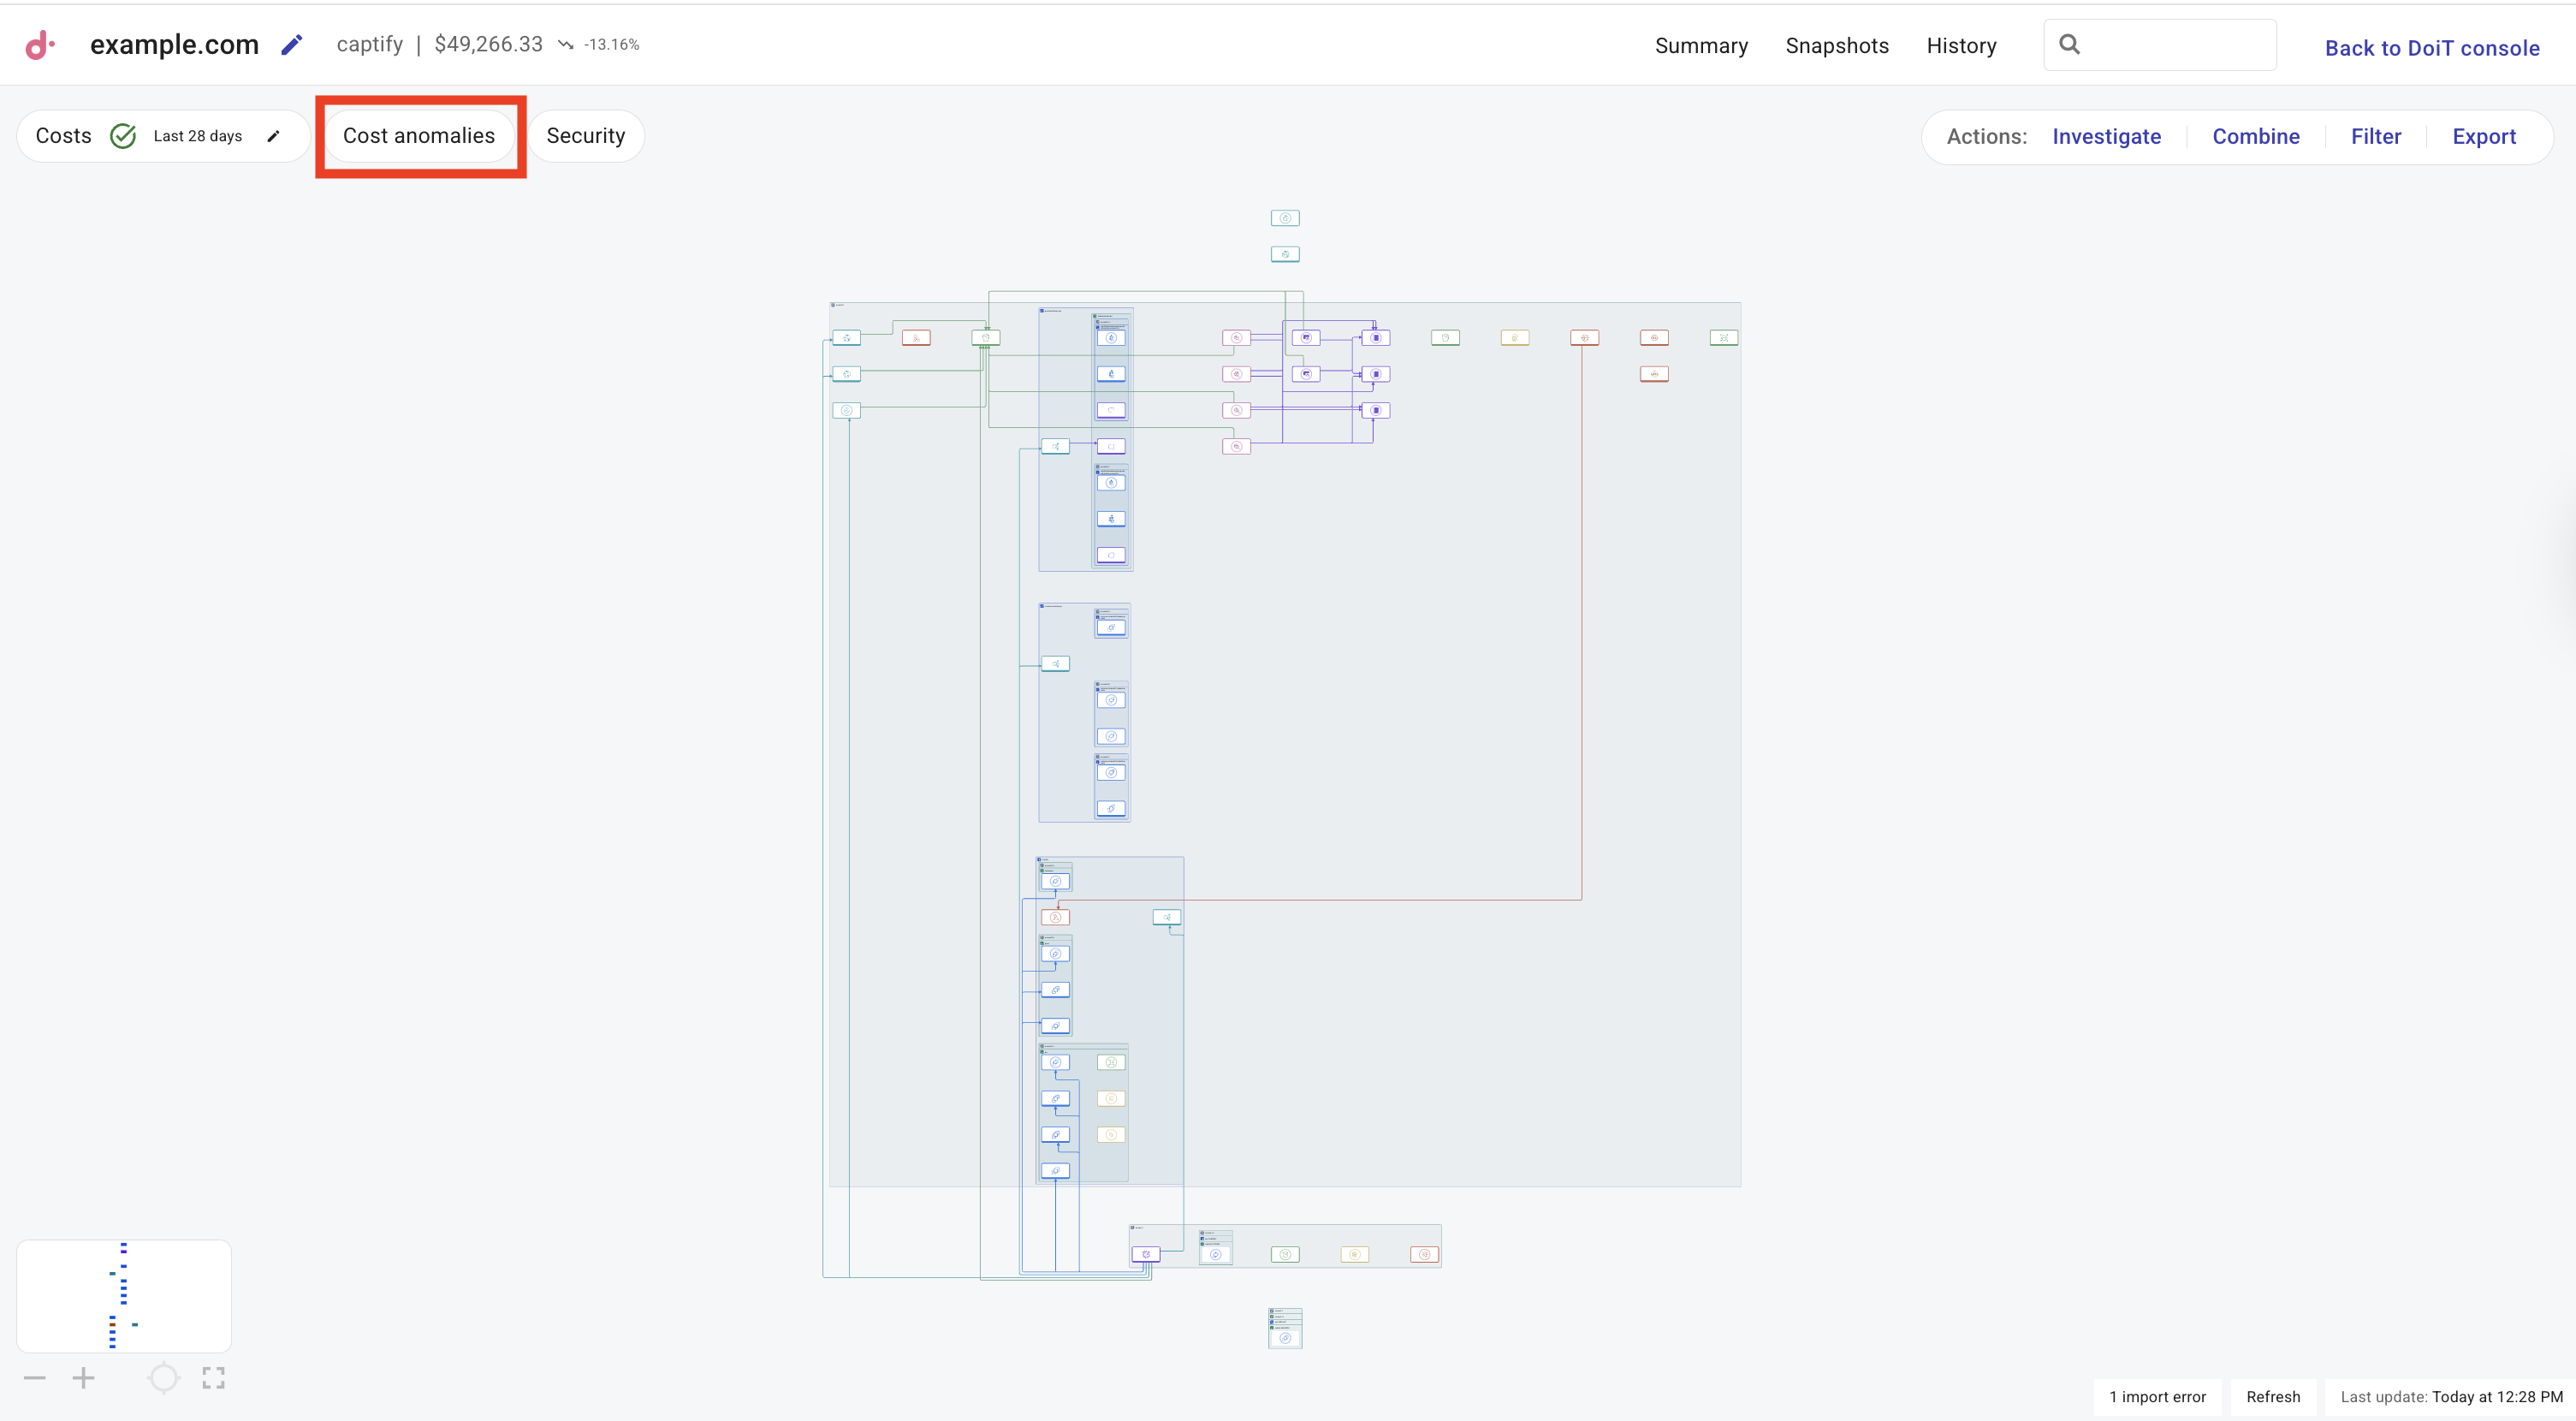
ダッシュボード から、コストを表示したいダイアグラムを選択してください。
-
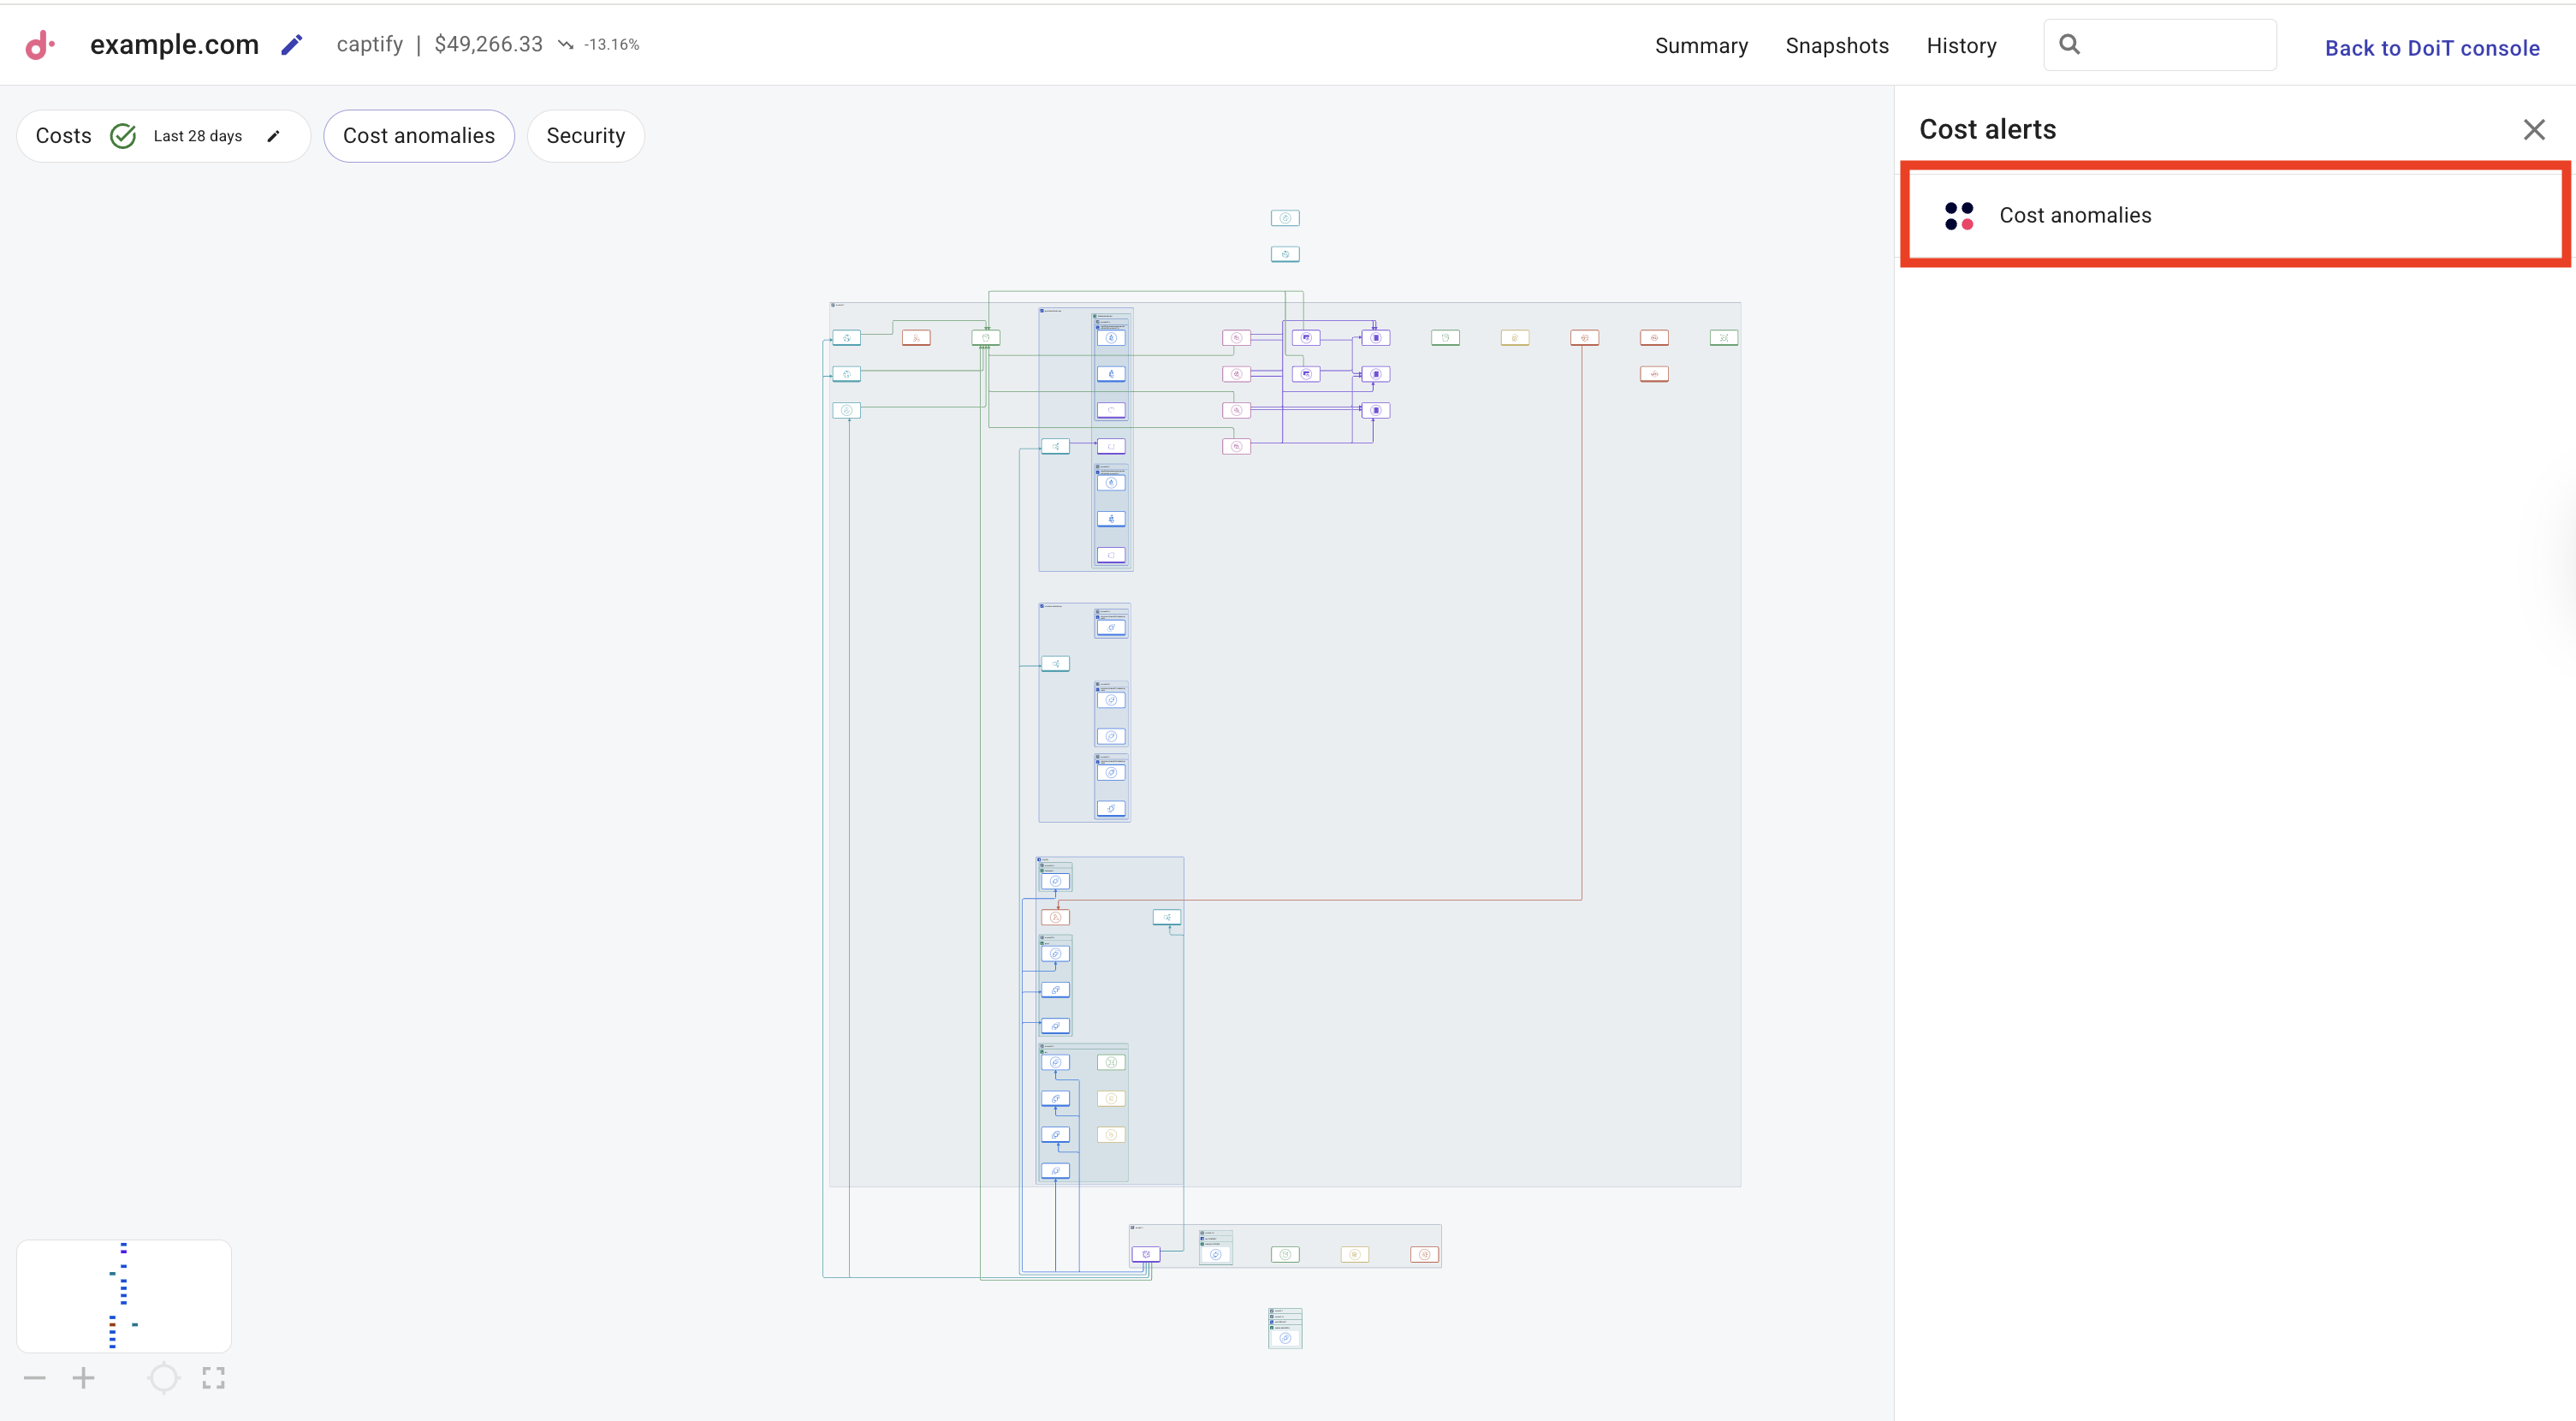
Cost anomalies を選択してください。
サイドパネルが表示されます。
-
Cost alerts タブから Cost anomalies を選択してください。
-
最新・重要度・コストの大きいアノマリーの順にリストを並べ替えます。
-
アクティブ・非アクティブのアノマリーでリストを絞り込みます。
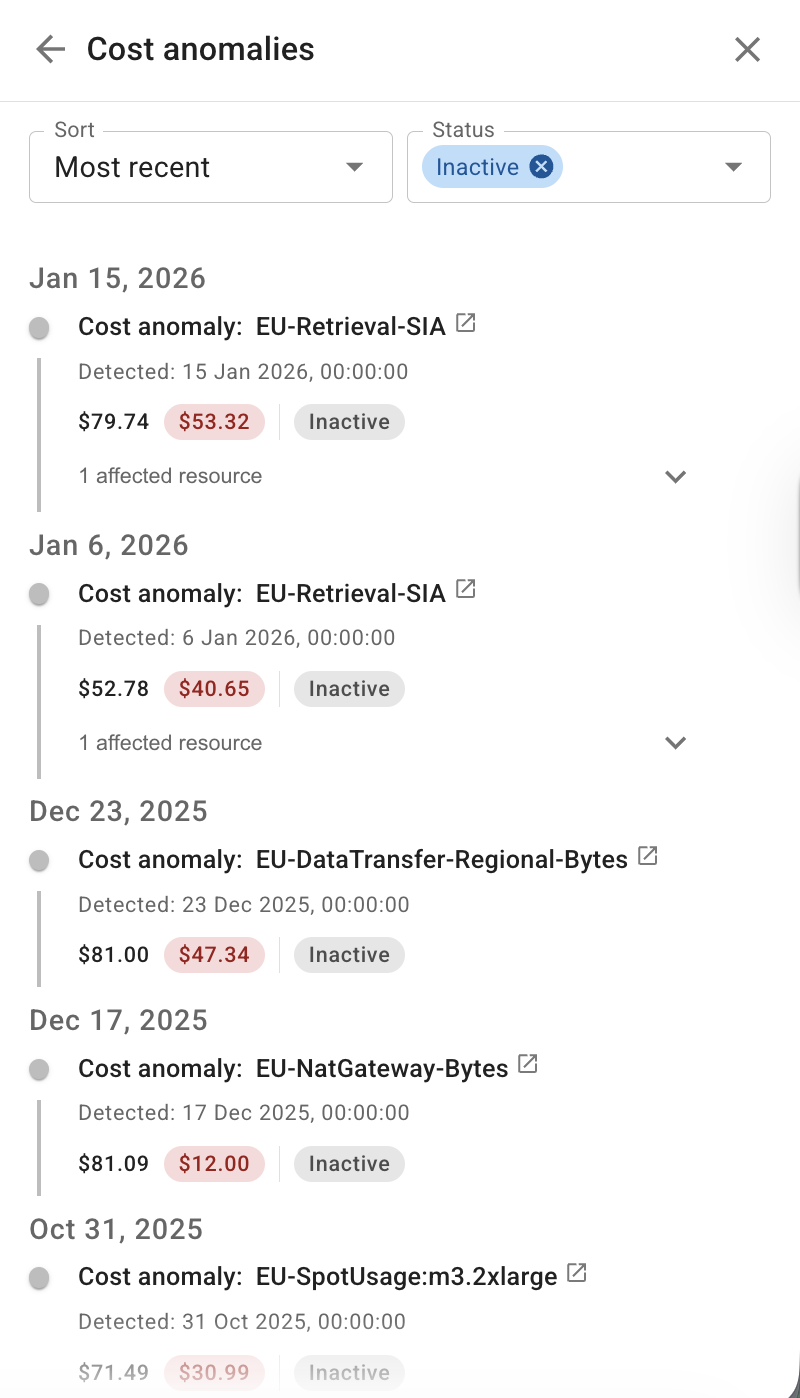
各アノマリーについて、現在のステータス、確認状態、影響を受けたリソースを確認できます。
- アノマリーにホバーして概要を表示します。
- 影響を受けたリソースを選択して、そのコンポーネントにダイアグラムをフォーカスし、ドリルダウンしてさらに調査します。
- アノマリーのタイトルを選択して、DoiT コンソールでアノマリーの詳細を表示するを実行します。
-
コンポーネントのコストのアノマリー�を表示する
特定のコンポーネントに対するコストのアノマリーを表示できます。
-
ダッシュボード から、表示したい cost anomalies を含むダイアグラムを選択してください。
-
コンポーネントを選択し、Anomalies を選択して、選択した要素のコストのアノマリー一覧を表示してください。
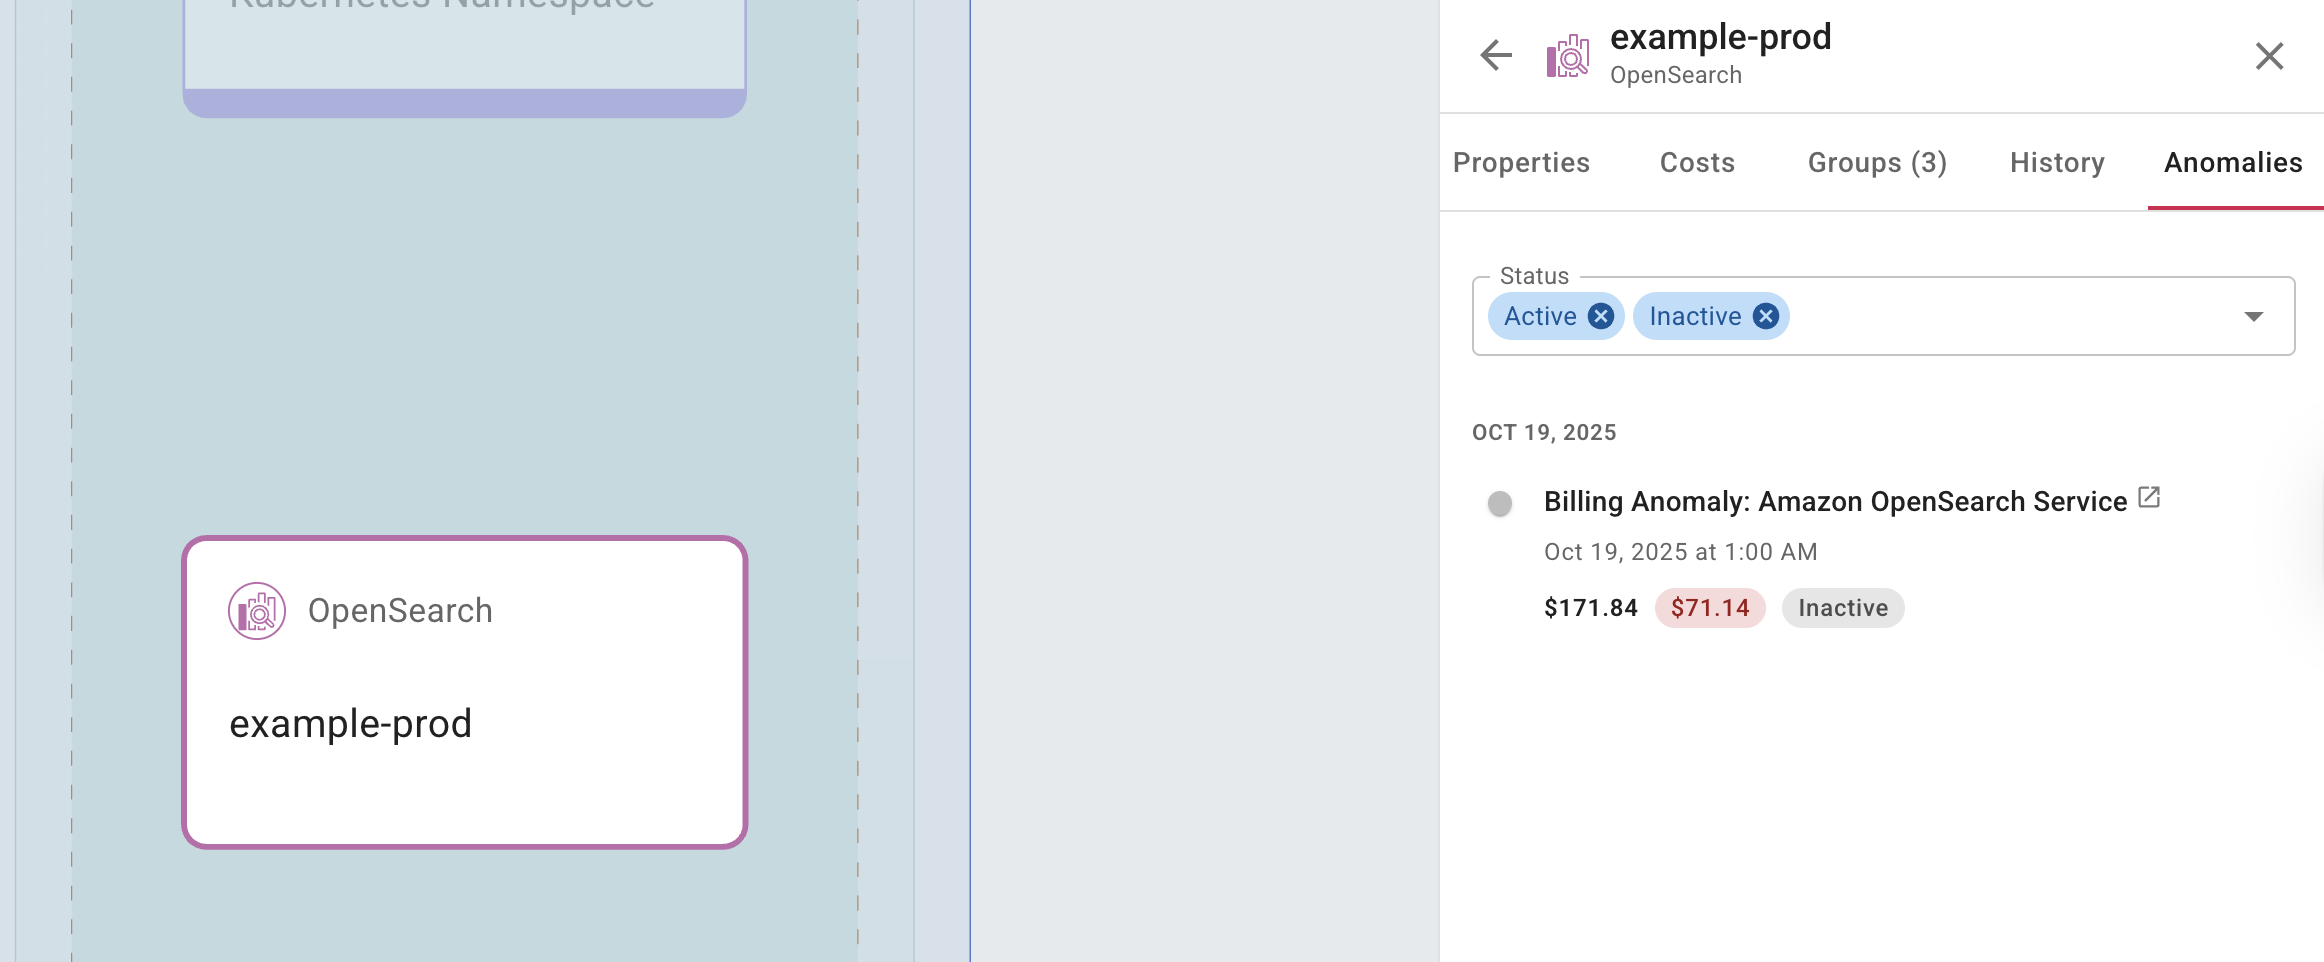
各アノマリーについて、現在のステータスと確認状態を確認できます。
- アノマリーにホバーして概要を表示します。
- アノマリーのタイトルを選択して、DoiT コンソールでアノマリーの詳細を表示するを実行します。