Work with Cloud Diagrams
This page explains how to view and manage Cloud Diagrams in the DoiT console, including filtering, combining elements, and comparing snapshots.
Read the content below or check out the ▶️ interactive demo for a visual walkthrough.
Required permissions
To use Cloud Diagrams, your DoiT account must have the Cloud Diagram User permission.
Cloud Diagrams dashboard
The Cloud Diagrams dashboard displays all the diagrams you have created. From the dashboard, you can create Cloud Diagrams and filter your diagrams.
In addition, you can:
- View a Cloud Diagram. Cloud Diagrams creates one diagram for every AWS account or Google Cloud project, allowing you to visualize and analyze your resources and understand the relationships between them.
- View network layer. The network layer enables you to see how your network components are connected and configured within your cloud environment, irrespective of your accounts or projects.
To access the dashboard, sign in to the DoiT console, select Analyze from the top navigation bar, and then select Cloud Diagrams.
View network layer
To view the network layer, from the Cloud Diagrams dashboard, select the View network layer button.

The network layer gives you a global view of your cloud networking infrastructure across all imported accounts and projects. It helps you understand the network flows between subnets in different VPCs, regions, accounts, and projects.
The network layer enables you to:
-
Map complex CloudWAN, TransitVPC, VPN networks between different accounts, projects, and hybrid cloud setups.
-
Get inventory of NAT and internet gateways.
-
Troubleshoot routing issues and verify that routing tables are set up correctly.
The network layer references the Open Systems Interconnection (OSI) model. It shows resources starting from subnet and above. No individual service instances are shown only the network components, for example, subnet, availability zone, VPC, and region.
-
Each account or project is shown as a vertical column.
-
Links are shown for private connections and VPNs only. The network layer does not track connections over the public internet if they are not described on the infrastructure level, for example, an EC2 instance connecting to an ELB in another account.
The network layer does not display security controls like security groups, ACLs, network firewall rules, although, you can see security groups in a diagram.
View a diagram
To view a cloud diagram, from the dashboard, select the card of the diagram you want to view.

Cloud Diagrams provides a complete view of your cloud infrastructure at glance, giving you valuable insights into the current state of your deployment, helping you understand your cloud footprint. You can zoom into specific services, view their properties, and understand any current issues.
When you view a cloud diagram, you can see:
- Nodes: Service instances like S3 buckets, cloud storage buckets, load balancers, Lambda functions, and so on. The nodes are displayed from left to right.
- Links: Links between nodes and groups.
- Groups: Regions, security groups, subnets, or VPCs.
Cloud Diagrams automatically updates every 4 hours. You can also manually refresh the data at any time by selecting Refresh.
Working with Cloud Diagrams
When viewing a diagram or the network layer, you can:
View summary
You can view a summary of all the nodes and groups, or network elements, providing a condensed and easily digestible view of your cloud infrastructure.
-
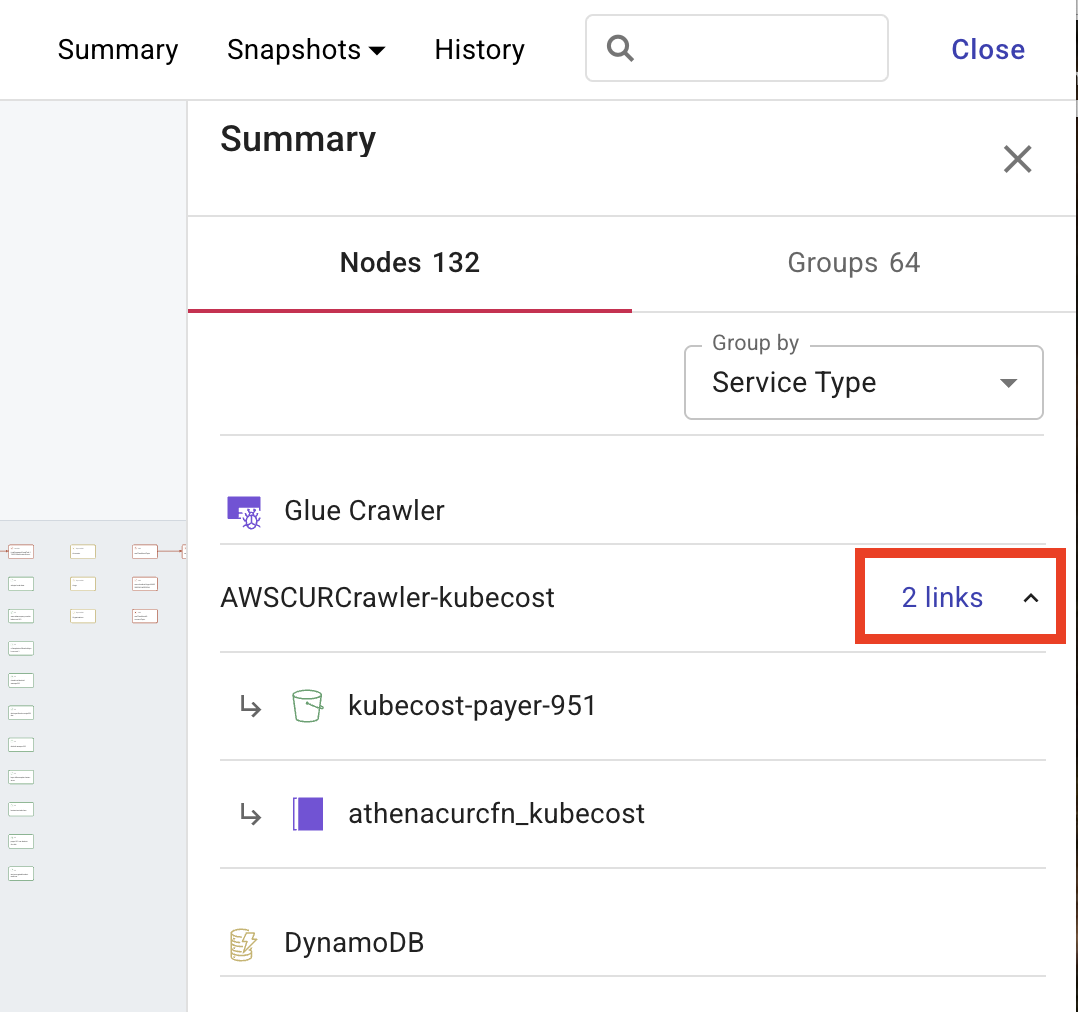
Select Summary to display a summary of all nodes, groups, and links in a diagram.
-
If a node has outbound links, expand the node to see the links.
-
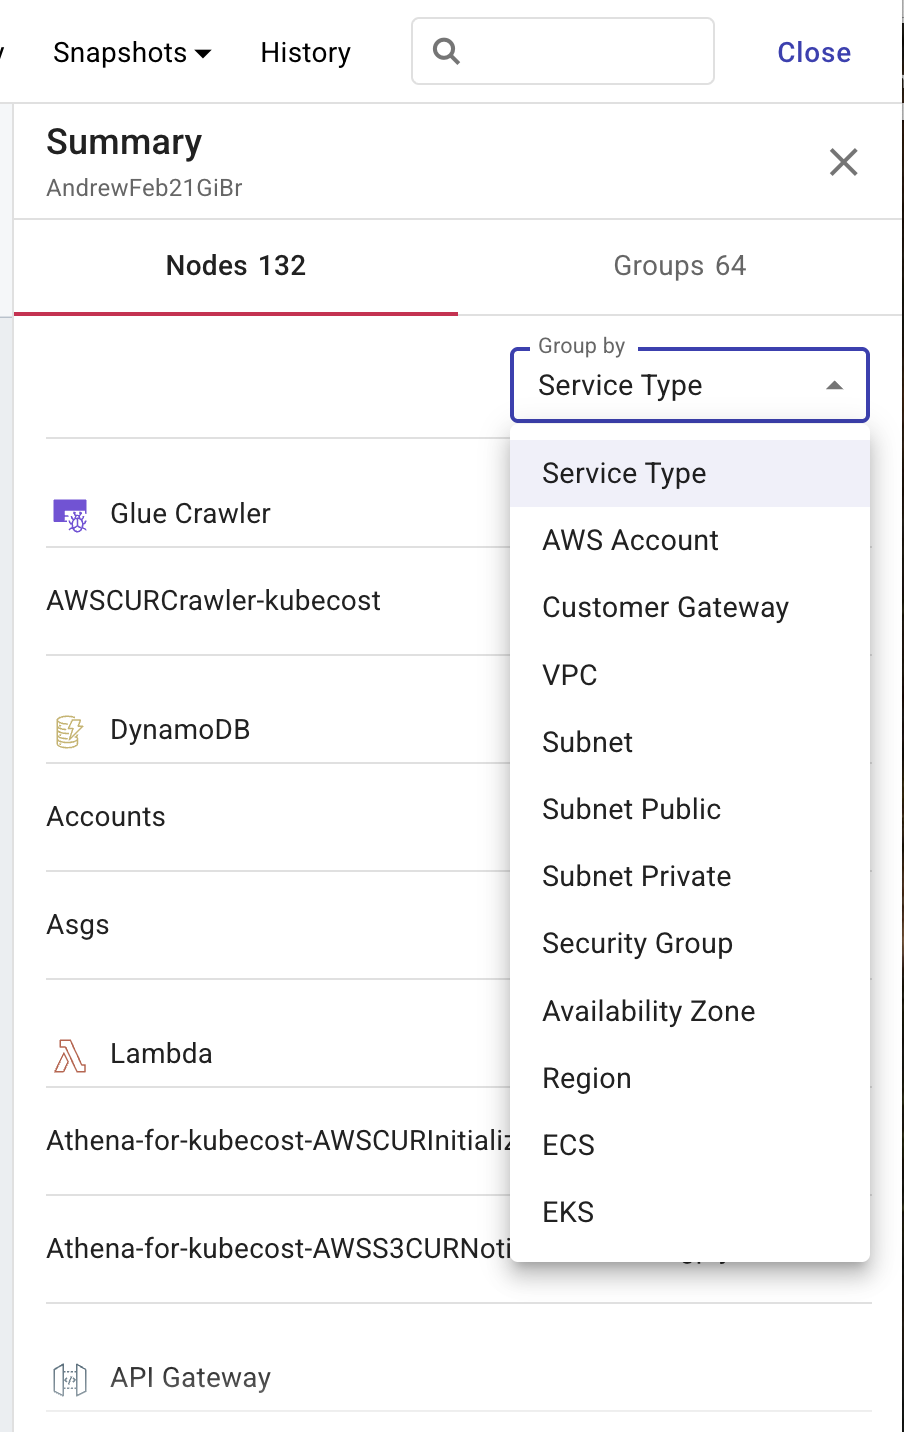
You can group the nodes by various dimensions including Service Type, AWS account, Pod, Customer gateway, VPC, Subnet, Subnet public, Subnet private, Security group, Availability zone, Region, ECS, and EKS. Some dimensions apply across both AWS and Google Cloud environments, while others are specific to a single cloud provider (for example, AWS or Google Cloud).
-
Select Groups to see a summary of your groups.
-
-
Select an element to view its properties.
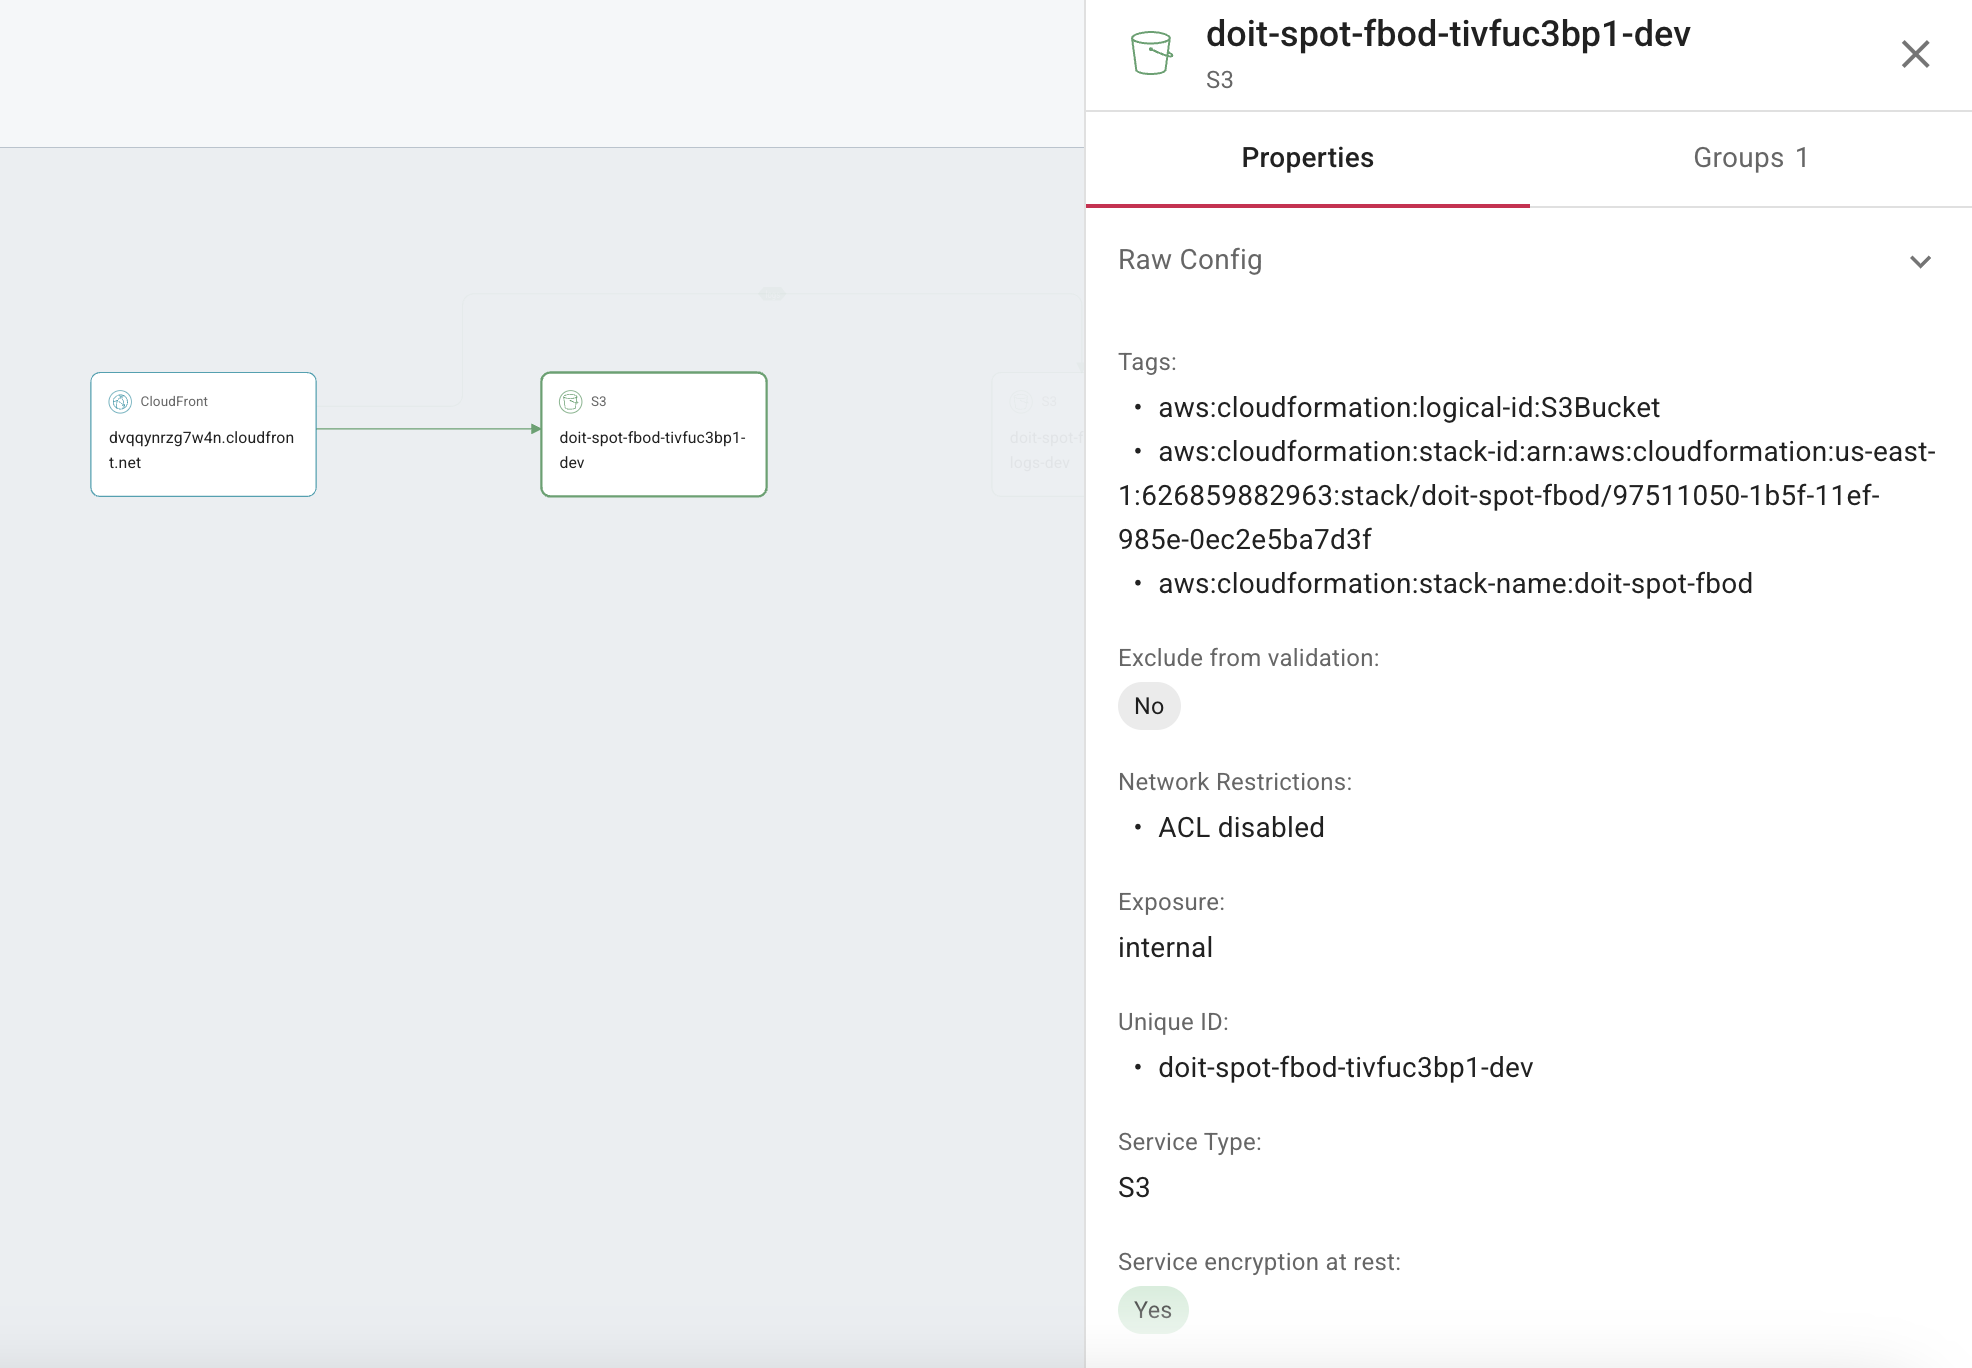
Select Groups to see which groups a node belongs to.

Compare snapshots
Snapshots represent a point-in-time copy of your diagram. Snapshots are automatically created when a change is detected, independently of the 4 hour diagram updates. By comparing snapshots, you can monitor the changing states of your cloud infrastructure. This allows for detailed analysis of trends, visualization of element and relationship changes, and identification of cost variations.
-
Expand Snapshots and select Compare.
-
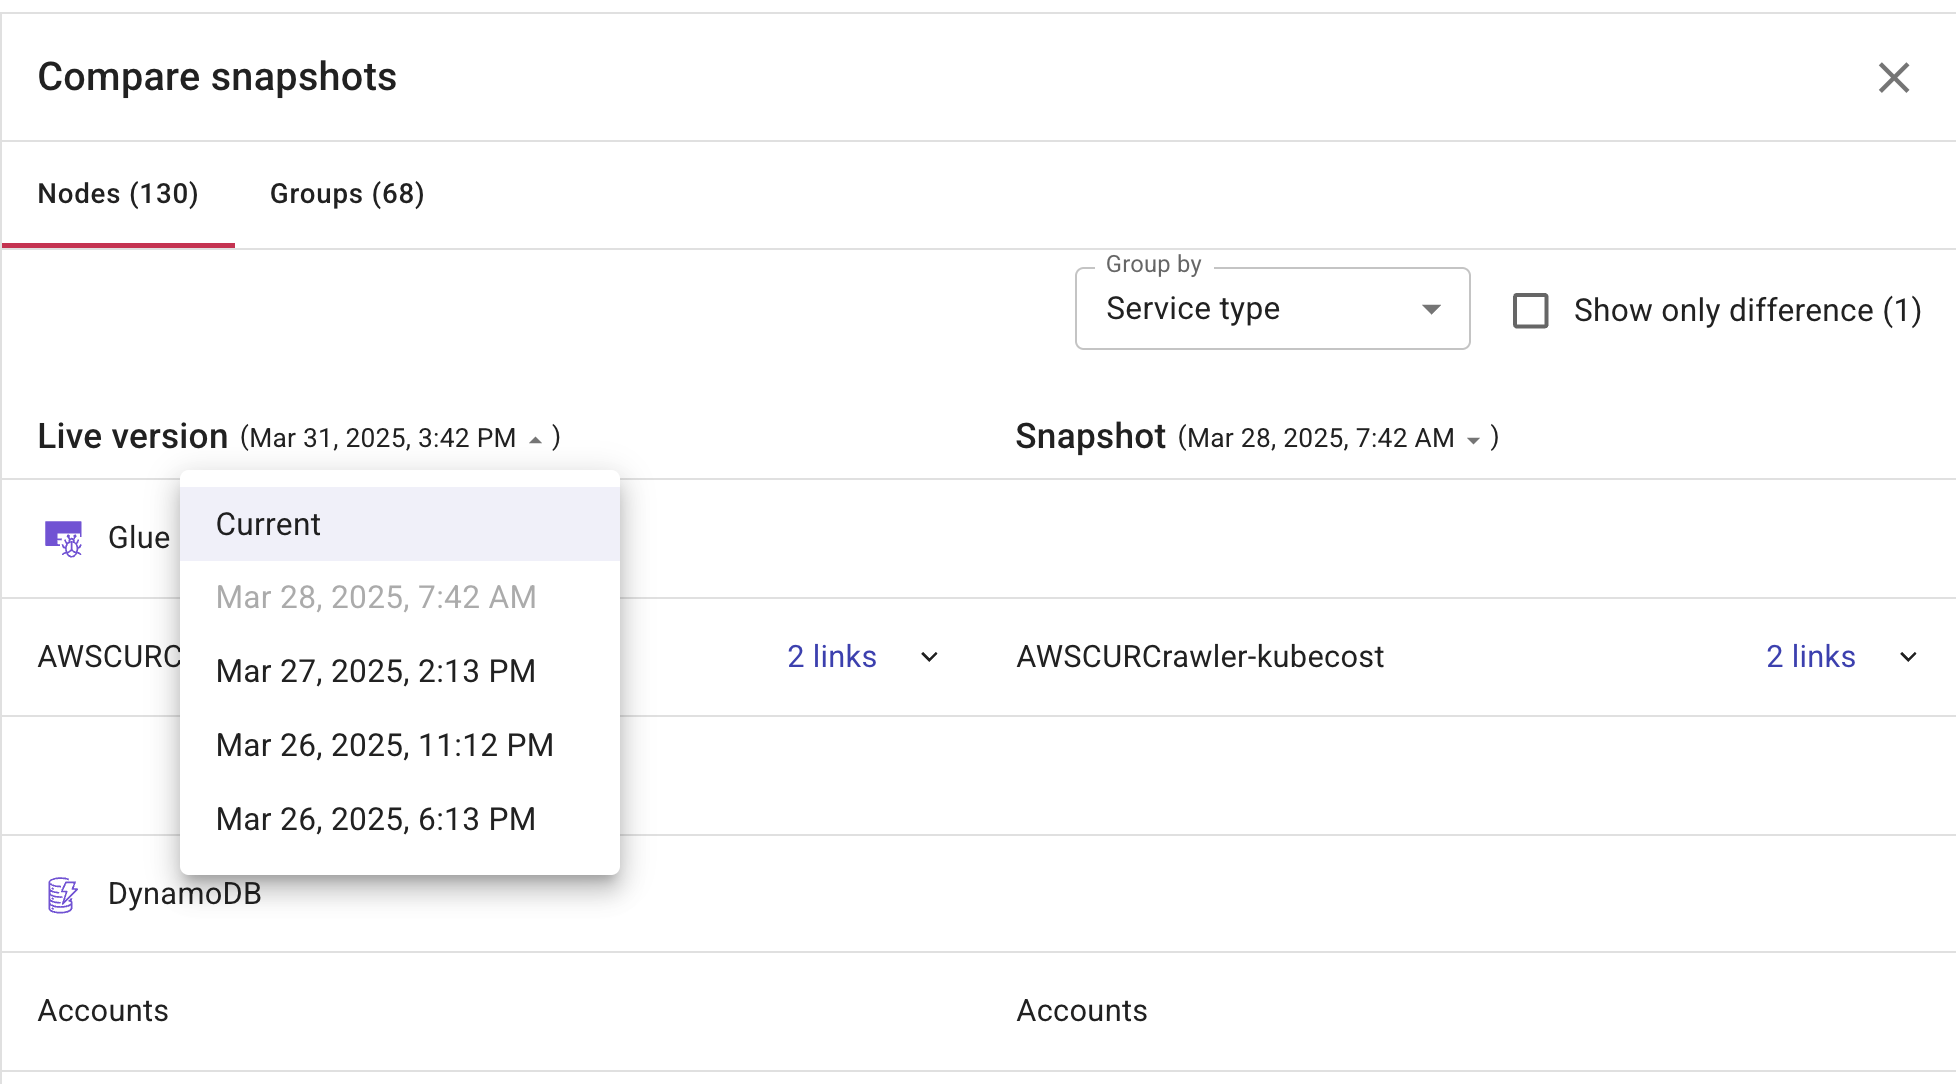
Select Nodes or Groups, depending on your requirements. By default, the left hand pane displays the current snapshot and the right hand pane displays the previous snapshot.
-
When comparing snapshots, change either the current snapshot, previous snapshot, or both, to create the comparison you need.
-
From the Live version and/or Snapshot list, select the date of the snapshot you want to compare.
-
(Optional) Select Show only difference to only see the changes between the two snapshots.
-
-
You can group node snapshots by various dimensions such as Service Type, AWS Account, Pod, Customer Gateway, VPC, Subnet, Subnet Public, Subnet Private, Security Group, Availability Zone, Region, ECS, and EKS. Some dimensions apply across both AWS and Google Cloud environments, while others are specific to a single cloud provider (for example, AWS or Google Cloud).
-
Select X to return to your diagram.
View history
Cloud diagrams records every action performed in the imported account or project related to the elements in a diagram or the elements on the network layer. This is useful for audits, compliance, and understanding your cloud environment.
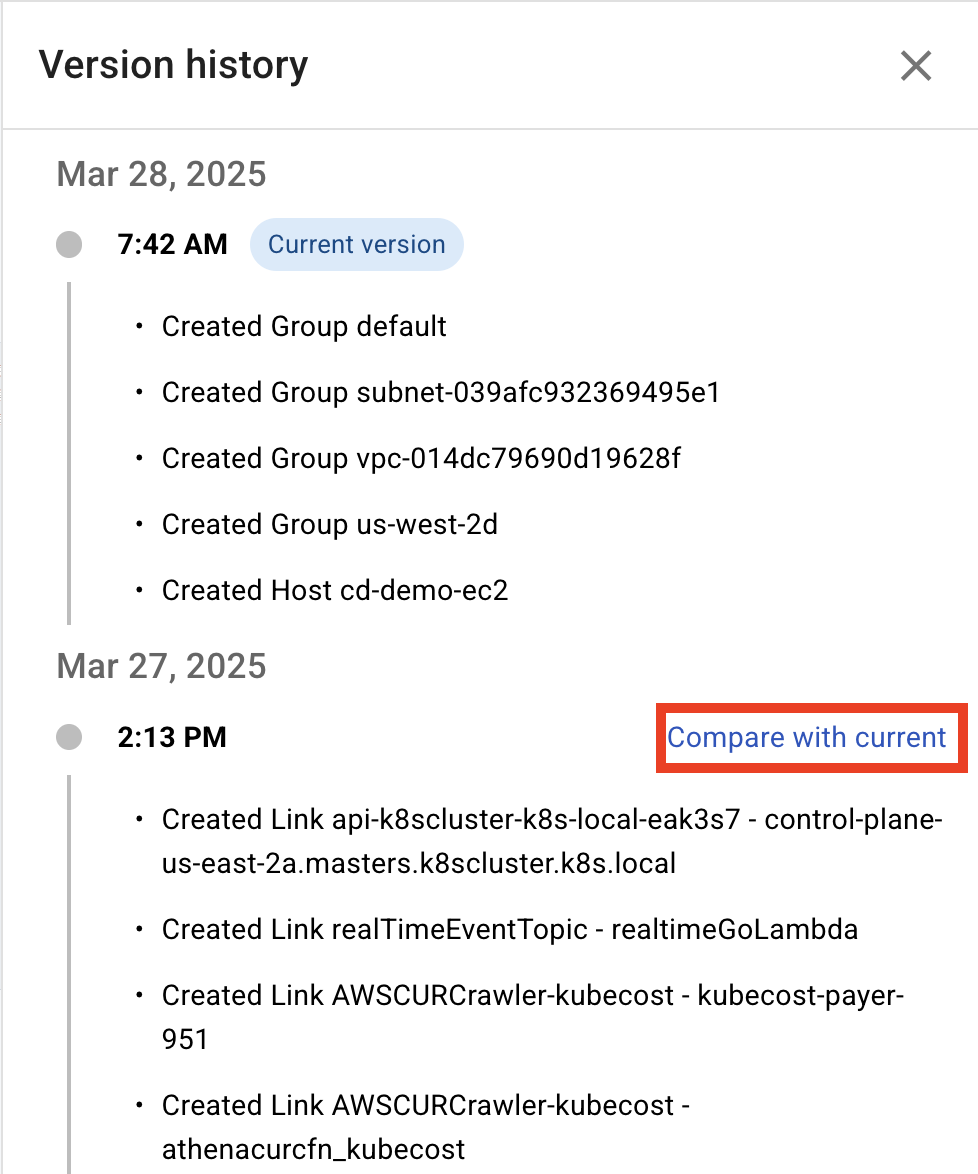
Select History to see a version history of your diagram. In Version History, you can see how your diagram has changed.
Select Compare with current to compare a previous snapshot with the current state.
Combine elements
You can reduce complexity and declutter diagrams by combining elements. Combining elements enables you to focus on the overall architecture and relationships between groups of resources. For example, combine multiple S3 buckets or Cloud Storage buckets, or group several EC2 instances or Compute Engine VMs into a single element.
-
You can only combine elements that are in the same subnet.
-
Combining elements is not available on the network layer.
-
Sign in to the DoiT console, select Analyze from the top navigation bar, and then select Cloud Diagrams.
-
From the dashboard, select the diagram you want to view.
-
From Actions, select Combine.
-
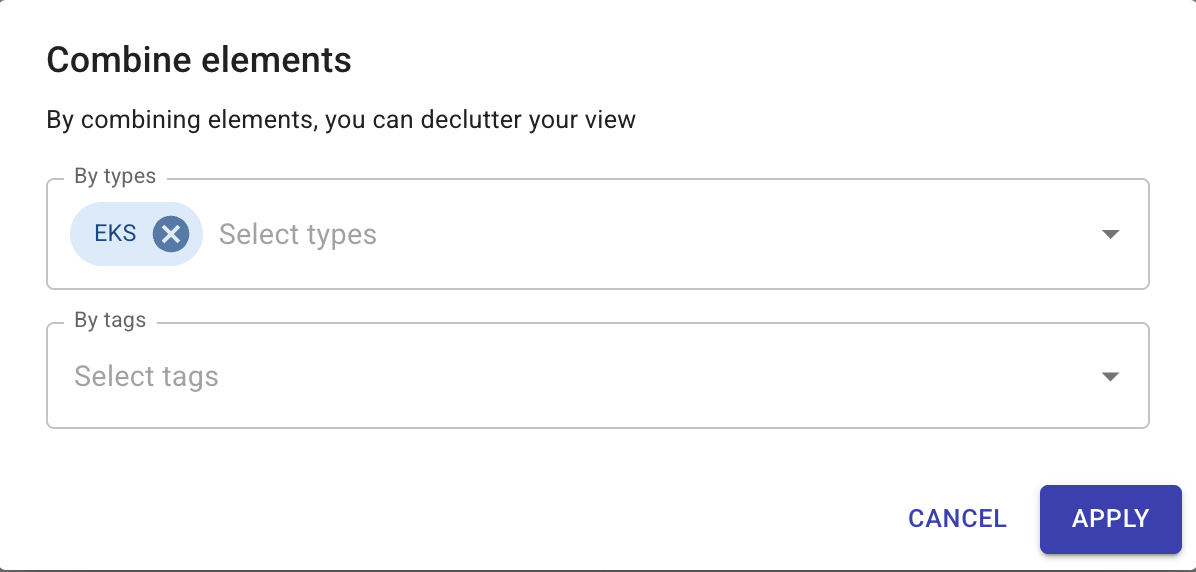
Elements can be combined using types and tags.
-
From By Types list, select the types you want to combine.
-
(Optional) From By Tags list, select the tags you want to combine.
You can separate combined elements using the arrows.
-
-
Select Apply.
Filter elements
You can filter elements on the diagram to focus and isolate specific resources, enabling faster analysis.
-
From Actions, select Filter.
-
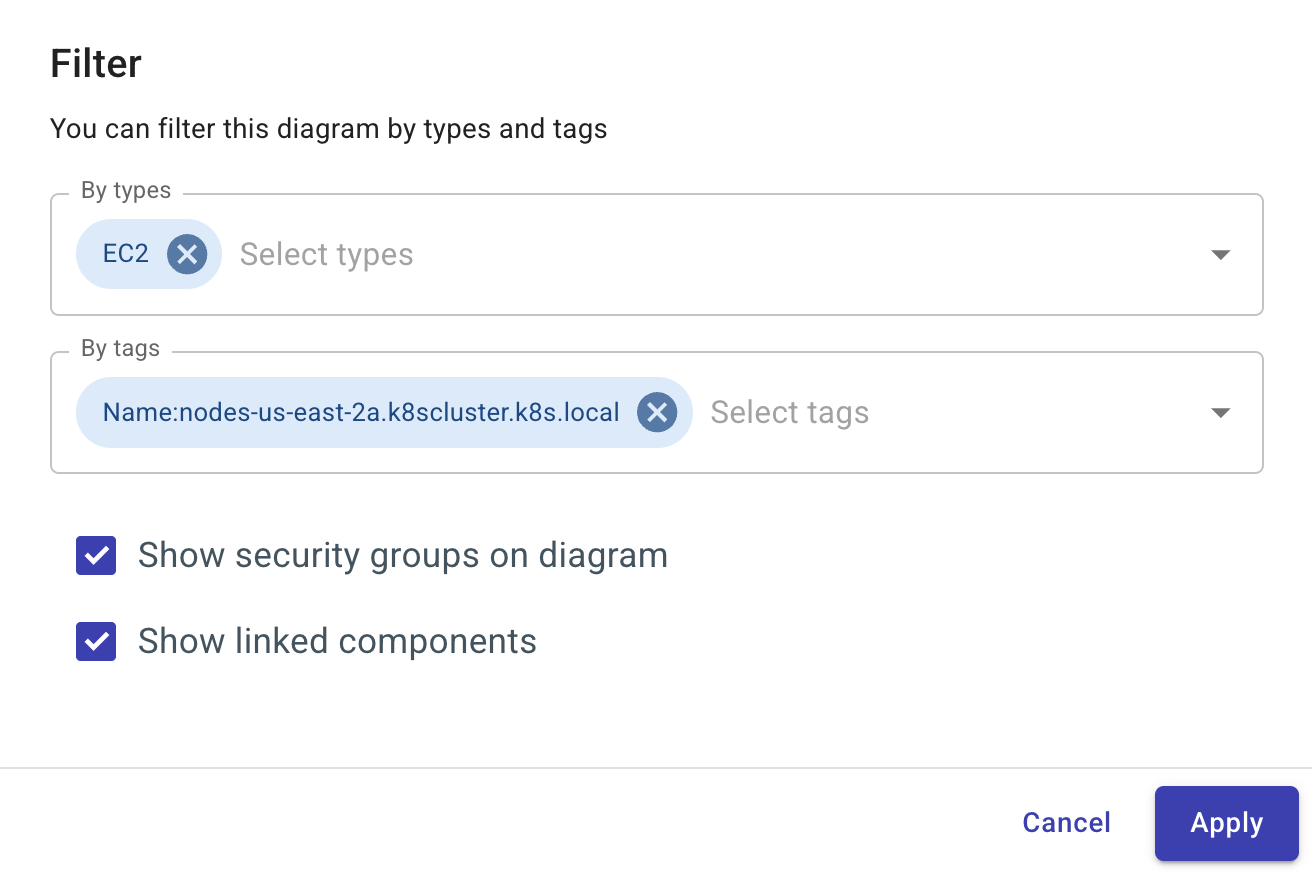
Elements can be filtered using both types and tags, or types and tags individually, as required.
-
From By Types list, select the types you want to combine.
-
From By Tags list, select the tags you want to combine.
-
-
(Optional) Select Show security groups on diagram to understand which elements are protected and how.
-
(Optional) Select Show linked components to show the components that are linked to the elements you are filtering.
-
Select Apply.
Export elements
You can export a diagram or network layer as an image, enabling you to share your Cloud Diagrams, for example, via email or embedding them in presentations and reports. This enhances communication, making it easier to share knowledge across teams.
-
From Actions, select Export.
-
You can export the diagram as either a PNG or JPEG.
-
(Optional) Select Show linked components to show all the relationships and dependencies between the different elements within your cloud environment.
-
Select Export. The file is sent to your email address.
▶️ Interactive demo
Try out our interactive demos for a hands-on walk-through experience.
If the demo doesn't display properly, try expanding your browser window or opening the demo in a new tab.