Integration sync history
Sync history lets you see recent data ingestion runs for an integration connection in the DoiT console. Use it to confirm that data is flowing on schedule, identify failed syncs, and diagnose errors without opening an expert inquiry.
Sync history is available for third-party platform integrations such as Cloudflare, Cursor, GitHub, OpenRouter, and Twilio. It isn't available for cloud platforms (Amazon Web Services, Google Cloud, Microsoft Azure, and Oracle Cloud) or for integrations with their own management page, such as Snowflake, Databricks, Datadog, and OpenAI.
View sync history
-
Sign in to the DoiT console, select Data ingestion and integrations from the top navigation mega menu, and then select Integrations.
-
For the integration whose connections you want to inspect, select Manage.
-
Locate the connection row on the detail page. Each connection row displays:
-
Last Synced: The time of the last successful sync. If no successful sync has been recorded, this column shows Never.
-
Last Attempt: The time of the most recent sync attempt, whether it succeeded or failed. When the last attempt failed, a warning icon appears next to the timestamp.
-
-
Select the kebab menu (⋮) on the connection row and choose View sync history.
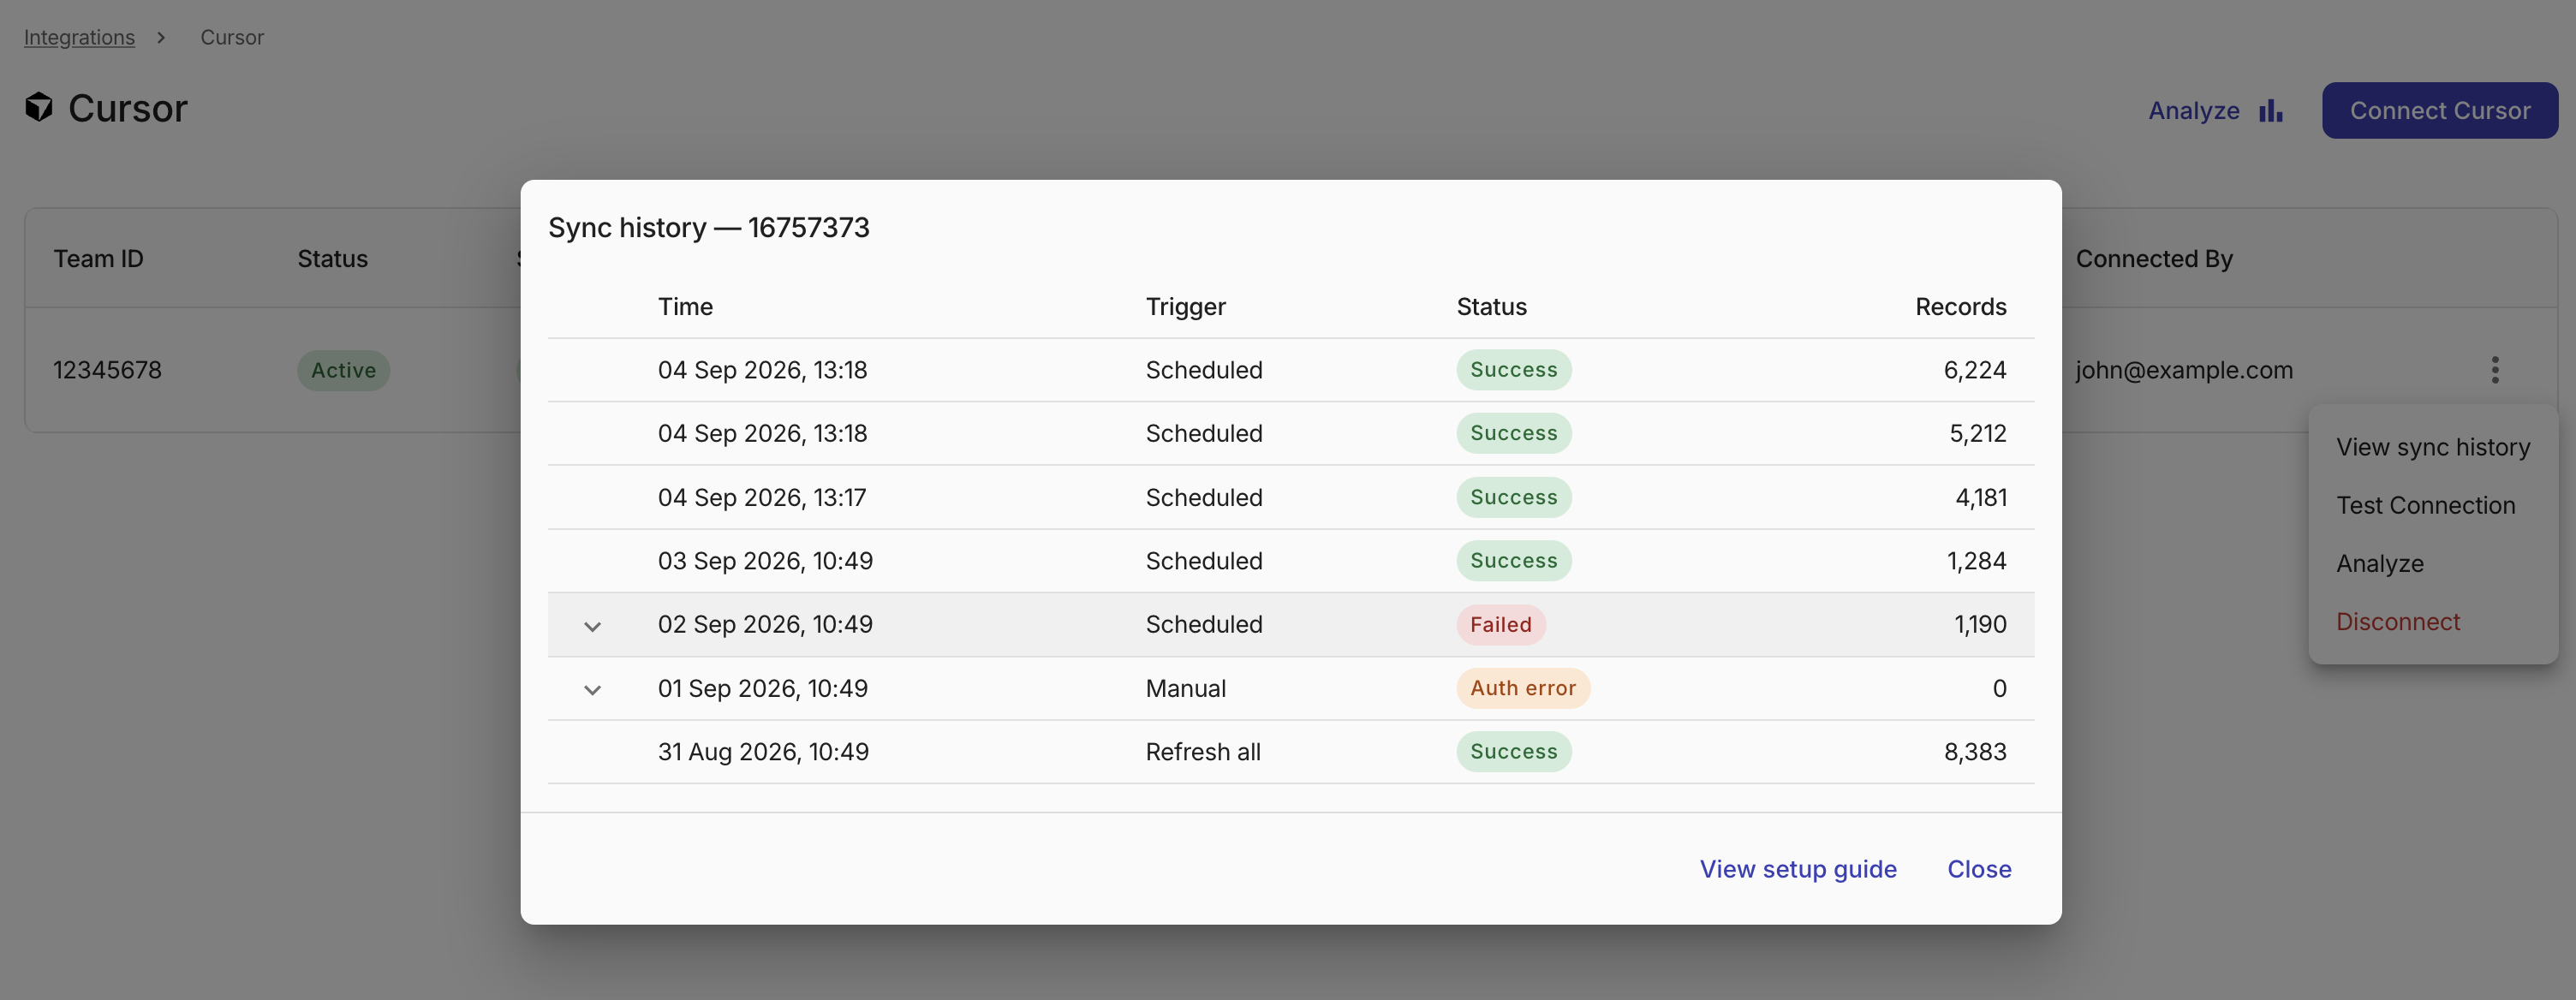
The Sync history dialog opens, displaying up to 30 of the most recent ingestion runs for that connection, sorted from newest to oldest. Each row in the table represents a single ingestion run with the following fields:
Field Description Time Date and time of the most recent update to the run. A run appears as soon as its first endpoint finishes, so the time, status, and record count of an in-progress run can still change. Trigger What initiated the run: Scheduled (automatic cadence), Refresh all (the initial import after connecting, or a refresh started from the console), or Manual (a run started by DoiT outside the console). Status Outcome of the run. See Run statuses. Records Total number of records ingested across all endpoints in the run.
Run statuses
The Status column shows the overall outcome of the run:
-
Success: All endpoints reported so far completed without errors.
-
Failed: One or more endpoints encountered an error during ingestion.
-
Auth error: One or more endpoints failed because of an authentication or authorization issue (HTTP 401 or 403), such as expired or revoked credentials, or an API token missing a required permission. If a run has both authentication and other errors, it shows Auth error.
The No data status on the connection row reflects data content rather than a run failure. It means the latest run succeeded but returned no billing data, for example, if the account isn't covered by the provider's billing API. In Sync history, these runs still display as Success.
Diagnose a failed run
When a run has a Failed or Auth error status, you can expand the row to see per-endpoint details:
-
In the Sync history dialog, select the expand arrow on the failed row.
-
Review each endpoint listed in the expanded section. For every endpoint, you can see:
-
The endpoint name (for example, billable_usage or subscriptions).
-
The endpoint-level status.
-
The number of records ingested by that endpoint.
-
If the endpoint failed, an error message describing the cause is displayed. See Error categories for the possible messages.
To view the raw error returned by the provider, select Show technical details below the error message.
-
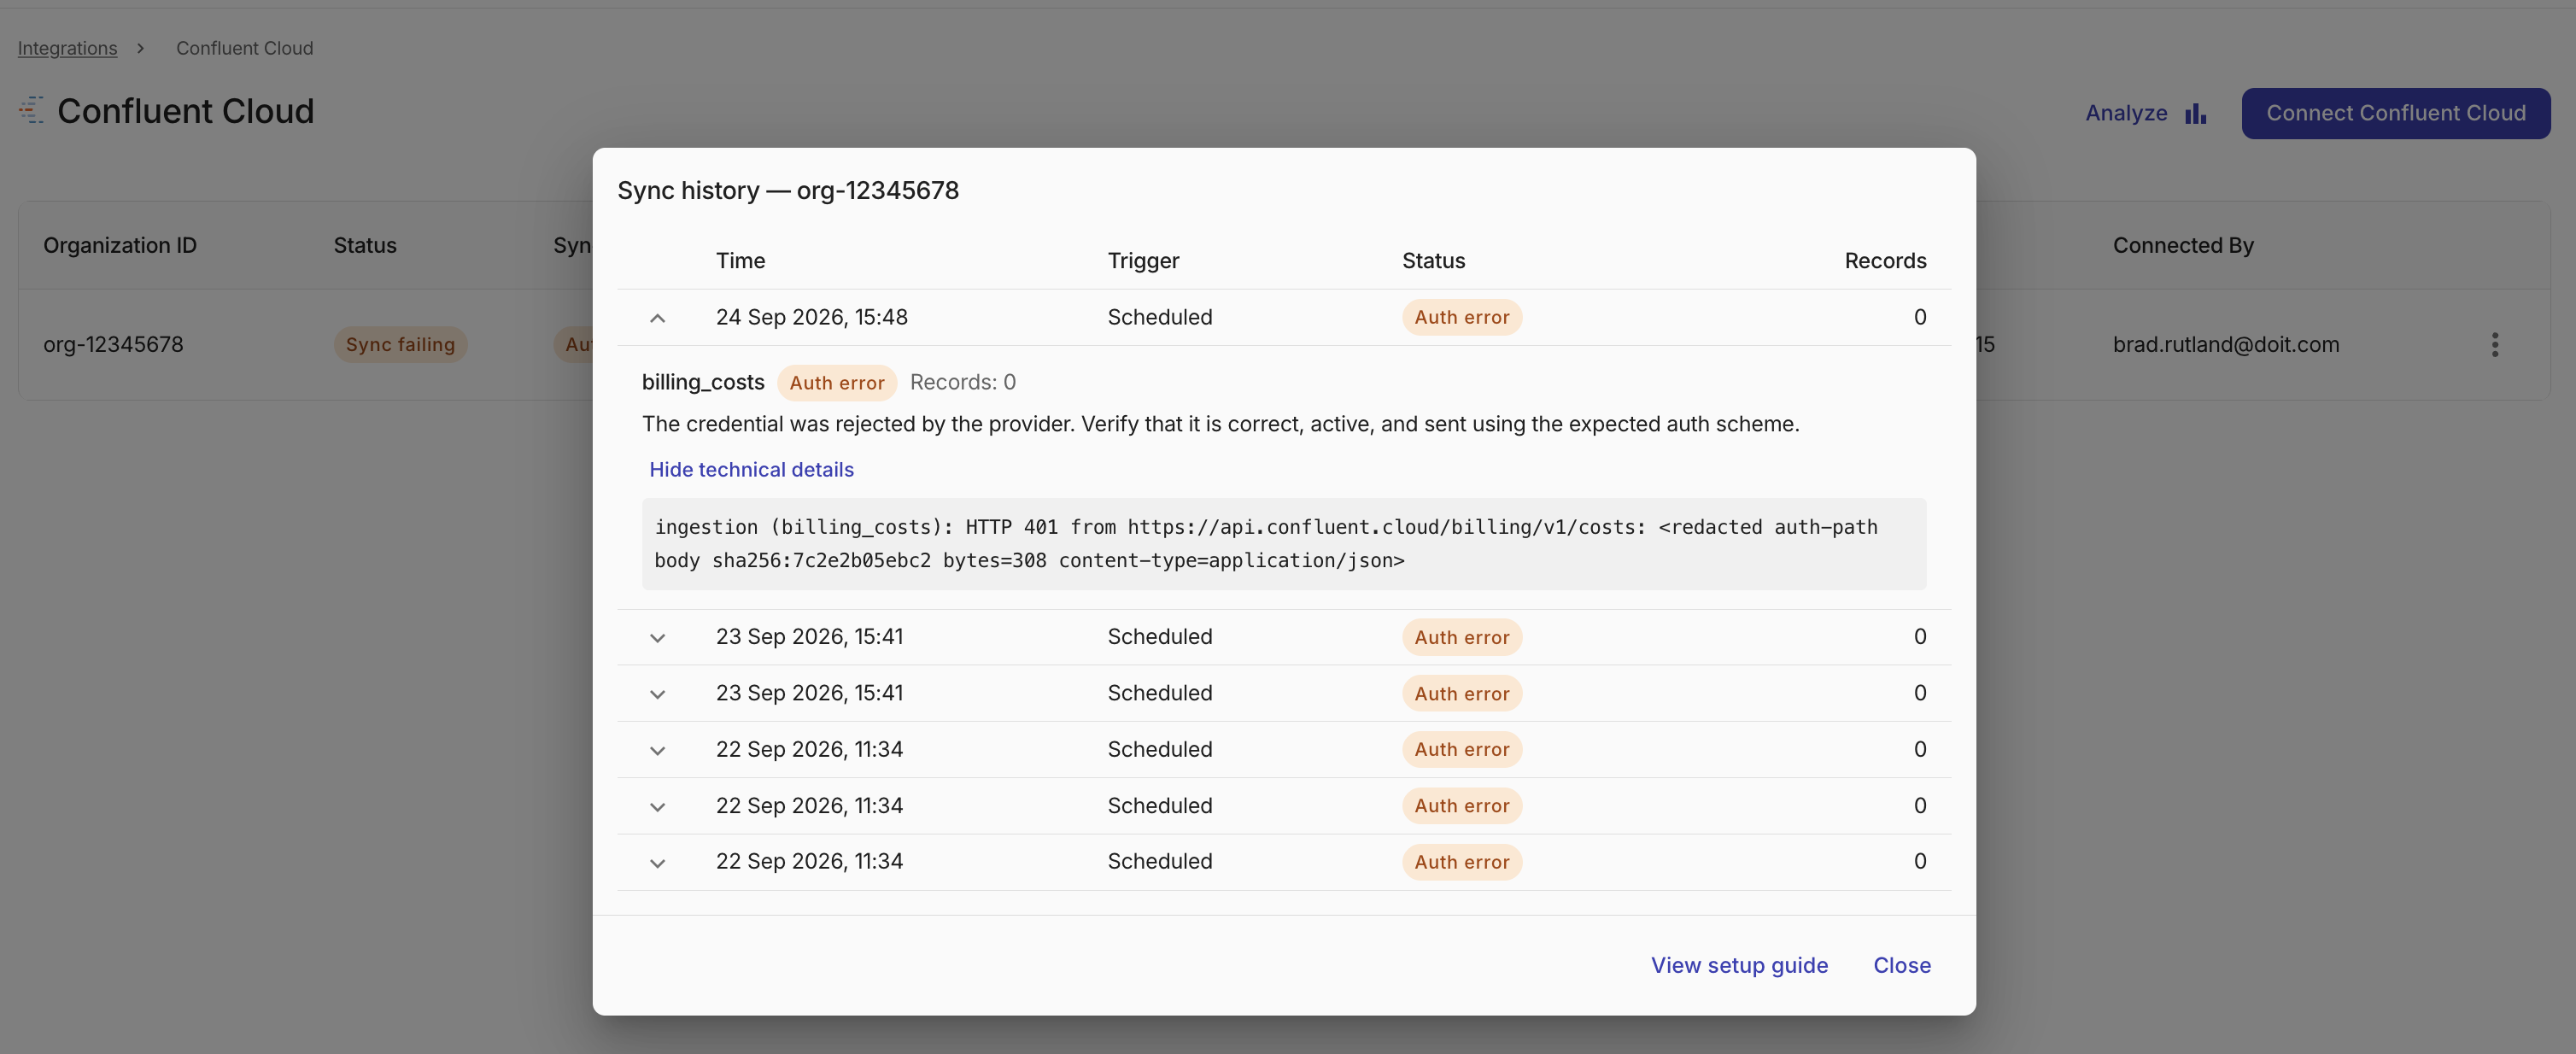
If you see an Auth error, your credentials may have expired or been revoked. Select View setup guide at the bottom of the dialog to verify the required credentials and permissions.
To resolve the error, either:
-
Reconnect the integration using the same identifier to overwrite the credentials.
-
Select Disconnect from the kebab menu (⋮), then reconnect.
Error categories
Failed endpoints display one of the following messages:
| Message | Description |
|---|---|
| The credential was rejected by the provider. Verify that it is correct, active, and sent using the expected auth scheme. | The provider returned an authentication error (HTTP 401). The API key or token is invalid, expired, or revoked. Reconnect the integration with a valid credential. |
| The credential reached the provider but is not allowed to access this endpoint. Verify roles, scopes, billing or account permissions, and whether this endpoint is available for the target account or plan. | The provider accepted the credential but denied the request (HTTP 403). The credential is missing a required role, scope, or permission, or the endpoint isn't included in your plan with the provider. |
| The endpoint or requested resource was not found. Verify the identifier, scope, and whether this endpoint is available for the target account. | The provider returned HTTP 404. The account, organization, or resource identifier used when connecting the integration doesn't exist or isn't visible to the credential. |
| The provider rate-limited the request. Ingestion retries automatically; no action is needed unless this persists. | The provider returned HTTP 429. DoiT retries the sync automatically. Contact support only if this error continues over several runs. |
| The provider could not be reached or returned an error of its own. Ingestion retries automatically; no action is needed unless this persists. | The provider timed out, was unreachable, or returned a server error (HTTP 5xx). DoiT retries the sync automatically. Contact support only if this error continues over several runs. |
| The sync failed for a reason we could not classify. Contact support with the technical details below. | The error didn't match any known category. Select Show technical details, copy the raw error, and include it when you contact support. |
Data retention
Run records are retained for 90 days. Older runs are removed automatically and no longer appear in the history.