Import data via DataHub API
Prerequisites
You should have already generated a DoiT API key. The API Key can be stored in GCP Secret Manager for security purposes.
This tutorial uses contrived data for demonstration purposes. In real-world scenarios, always sanitize your data, for example, mask personally identifiable information (PII), before sending it.
Objectives
In this tutorial, you'll learn how to:
-
Ingest multiple datasets into DoiT Cloud Analytics using JSON payload in the DataHub API.
-
Build Cloud Analytics reports to analyze organizational spending using the combination of cloud billing data and ingested data.
Step 1: Identify data sources
The organizational spending consists of the following:
-
Billing data of public clouds: The organization purchased services of Amazon Web Services and Google Cloud from DoiT. The cloud billing data is already available in DoiT Cloud Analytics.
-
Third-party charges: The organization uses NetSuite for business management and is billed monthly.
-
Operational costs: The organization has employees across three super regions: AMER, APAC, and EMEA. Each region has several functional teams. The employee cost data are stored in a CSV file.
Below are the example CSV files.
employees.csv
Employee ID,Employee Name,Territory,Team,Month,Cost
E1001,John Doe,AMER,Exec,2024-03-01,$75000
E1001,John Doe,AMER,Exec,2024-04-01,$75000
E1001,John Doe,AMER,Exec,2024-05-01,$75000
E1002,Jane Smith,AMER,Legal and Finance,2024-03-01,$60000
E1002,Jane Smith,AMER,Legal and Finance,2024-04-01,$60000
E1002,Jane Smith,AMER,Legal and Finance,2024-05-01,$60000
E1003,Emily Davis,AMER,R&D,2024-03-01,$116000
E1003,Emily Davis,AMER,R&D,2024-04-01,$116000
E1003,Emily Davis,AMER,R&D,2024-05-01,$116000
E1004,William Brown,AMER,HR and Support,2024-03-01,$56000
E1004,William Brown,AMER,HR and Support,2024-04-01,$56000
E1004,William Brown,AMER,HR and Support,2024-05-01,$56000
E1005,Xiao Ming,EMEA,R&D,2024-03-01,$61000
E1005,Xiao Ming,EMEA,R&D,2024-04-01,$61000
E1005,Xiao Ming,EMEA,R&D,2024-05-01,$61000
E1006,Ahmed Khan,APAC,R&D,2024-03-01,$58000
E1006,Ahmed Khan,APAC,R&D,2024-04-01,$58000
E1006,Ahmed Khan,APAC,R&D,2024-05-01,$58000
netsuite.csv
Territory,Month,Cost
AMER,2024-03-01,$70000
AMER,2024-04-01,$70000
AMER,2024-05-01,$70000
EMEA,2024-03-01,$7500
EMEA,2024-04-01,$7500
EMEA,2024-05-01,$7500
APAC,2024-03-01,$3700
APAC,2024-04-01,$3700
APAC,2024-05-01,$3700
Step 2: Define data granularity
To analyze the overall spending, you need to ingest the third-party charges and operational costs into DoiT Cloud Analytics and combine them with the cloud billing data:
-
Ingest NetSuite charges and employee costs separately, using
NetSuiteandEmployeesas the data source identifier (theproviderfield in the Events schema). -
For employee costs data, when constructing payload for the DataHub API request, add
Employee ID,Employee Name,TerritoryandTeamas custom dimensions (usinglabeltype dimensions).
Step 3: Prepare payload and send data
This step uses Flask and Werkzeug to set up a Python script that transforms the employee cost data and makes the API request. In reality, you can choose other tools to achieve the same goals.
Requirements file:
requirements.txt
google-cloud-secret-manager
Flask==2.2.5
Werkzeug==2.0.1
pytz
requests
python-dotenv
Python script:
main.py
from flask import request
import time
from pytz import timezone, utc
from google.cloud import secretmanager
import requests
import csv
from datetime import datetime

def access_secret(secret_id):
    """Accesses the specified secret from Secret Manager."""
    project_id = GCP_PROJECT # Automatically provided by Cloud Functions
    name = f"projects/{project_id}/secrets/{secret_id}/versions/latest"
    response = client.access_secret_version(name=name)
    return response.payload.data.decode('UTF-8')

def send_api_request(data,doit_api_key):
    url = f"https://api.doit.com/datahub/v1/events"  #prod

    headers = {
        "Content-Type": "application/json",
        "Authorization": f"Bearer {doit_api_key}"  # Add the Authorization header
    }
    response = requests.post(url, json=data, headers=headers)
    return response

def format_to_iso(date_str):
    # Parse the date string to a datetime object assuming the format is YYYY-MM-DD
    date = datetime.strptime(date_str, "%Y-%m-%d")

    # Format the datetime object to ISO 8601 format with time set to midnight
    formatted_date = date.strftime("%Y-%m-%dT%H:%M:%S.00Z")

    return formatted_date

def ingest(json_data, doit_api_key):
    """Process and send the JSON data to the API endpoint."""
    for item in json_data:
        employee_id = item.get("employee_id")
        employee_name = item.get("employee_name")
        territory = item.get("territory")
        team = item.get("team")
        month = format_to_iso(item.get("month"))
        cost = item.get("cost").replace("$", "").replace(",", "")  # Remove $ and commas

        api_request_data = {
            "events": [{
                "provider": "Employees",
                "id": f"{employee_id}_{month}",
                "dimensions": [
                    {"key": "Employee_ID", "type": "label", "value": employee_id},
                    {"key": "Employee_name", "type": "label", "value": employee_name},
                    {"key": "Territory", "type": "label", "value": territory},
                    {"key": "Team", "type": "label", "value": team}
                ],
                "time": month,
                "metrics": [
                    {"value": float(cost), "type": "cost"},
                    {"value": 180, "type": "usage"},  # Example monthly working hours
                    {"value": 0, "type": "savings"}  # Example savings (e.g., from benefits or discounts)
                ]
            }]
        }

        max_retries = 6
        retry_delay = 10  # seconds
        for attempt in range(max_retries + 1):
            response = send_api_request(api_request_data, doit_api_key)
            if response.status_code in [200, 201]:
                break
            elif response.status_code == 429:
                print(f"API request rate limited. Attempt {attempt + 1} of {max_retries}. Retrying in {retry_delay} seconds.")
                if attempt < max_retries:
                    time.sleep(retry_delay)
                else:
                    print("Maximum retries reached. Exiting.")
            else:
                print(f"API request failed with status code: {response.status_code} {response.text}")
                break

def access_secret(secret_id):
    """Accesses the specified secret from Secret Manager."""
    project_id = GCP_PROJECT
    name = f"projects/{project_id}/secrets/{secret_id}/versions/latest"
    response = client.access_secret_version(name=name)
    return response.payload.data.decode('UTF-8')

def ingest_employees(file_path, doit_api_key):
    """Read data from a CSV file and use the ingest function to ingest it."""
    with open(file_path, mode='r') as csv_file:
        csv_reader = csv.DictReader(csv_file)
        for row in csv_reader:
            json_data = [{
                "employee_id": row["Employee ID"],
                "employee_name": row["Employee Name"],
                "territory": row["Territory"],
                "team": row["Team"],
                "month": row["Month"],
                "cost": row["Cost"]
            }]
            ingest(json_data, doit_api_key)

def ingest_employee_cost(request):
    doit_api_key = access_secret('DOIT_API_KEY')
    print(f"ingesting employees cost from CSV")

    file_path = 'employees.csv'  # Path to your CSV file
    ingest_employees(file_path, doit_api_key)

    # Return the response
    return f'Done'

client = secretmanager.SecretManagerServiceClient()
GCP_PROJECT  = "your-gc-project"

if __name__ == "__main__":
    ingest_employee_cost("")
In case you ingested wrong data, you can DELETE the event 90 minutes after the ingestion.
Make another API request to ingest the NetSuite data.
Step 4: Perform costs analysis
If the API requests were successful, in about 15 minutes, you can proceed to analyze the costs using the combined dataset.
-
In the DoiT console, select Reporting and analytics from the top navigation mega menu, and then select Reports.
-
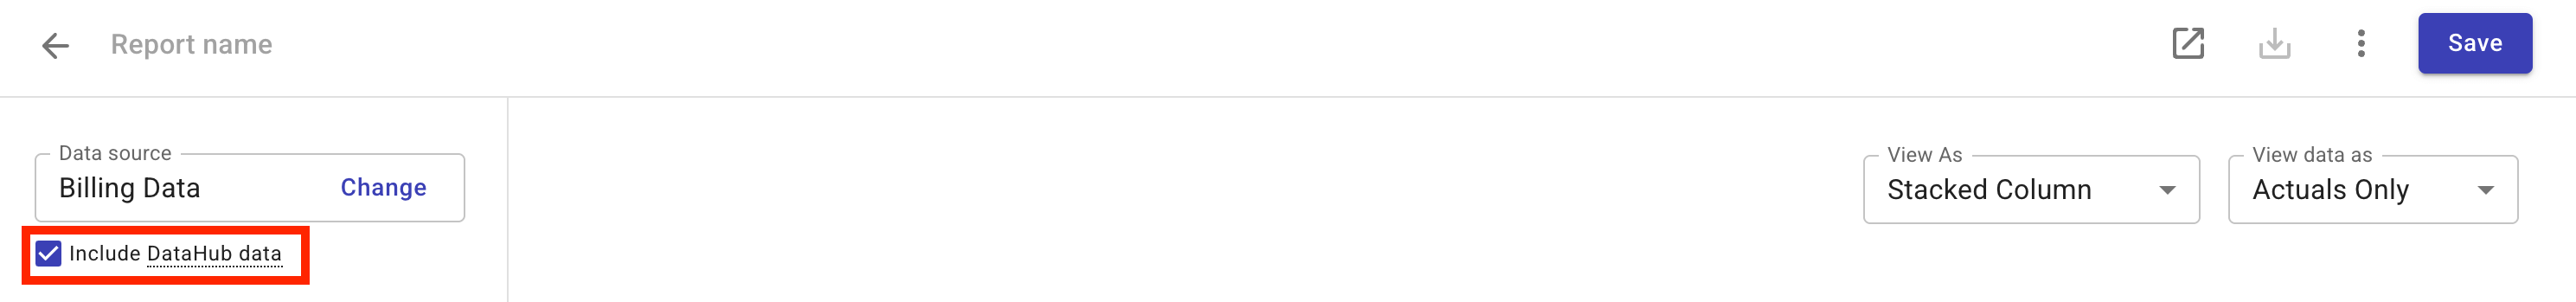
Create a new report. In the left-hand pane, select the Include DataHub data checkbox under the Data source.
The checkbox is greyed out until the ingested data is available.
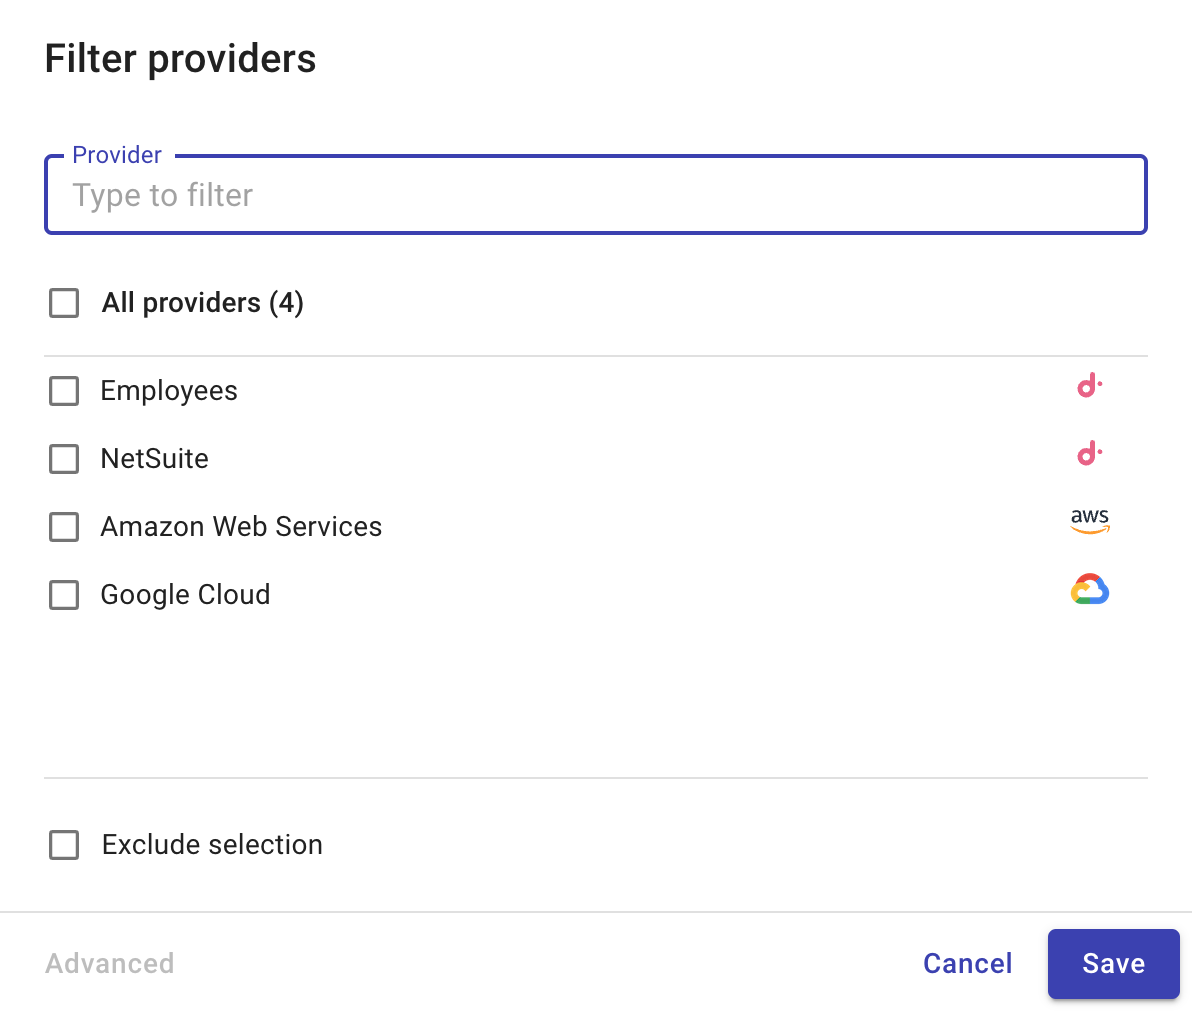
You can use the Filter providers option to see all the available datasets.
-
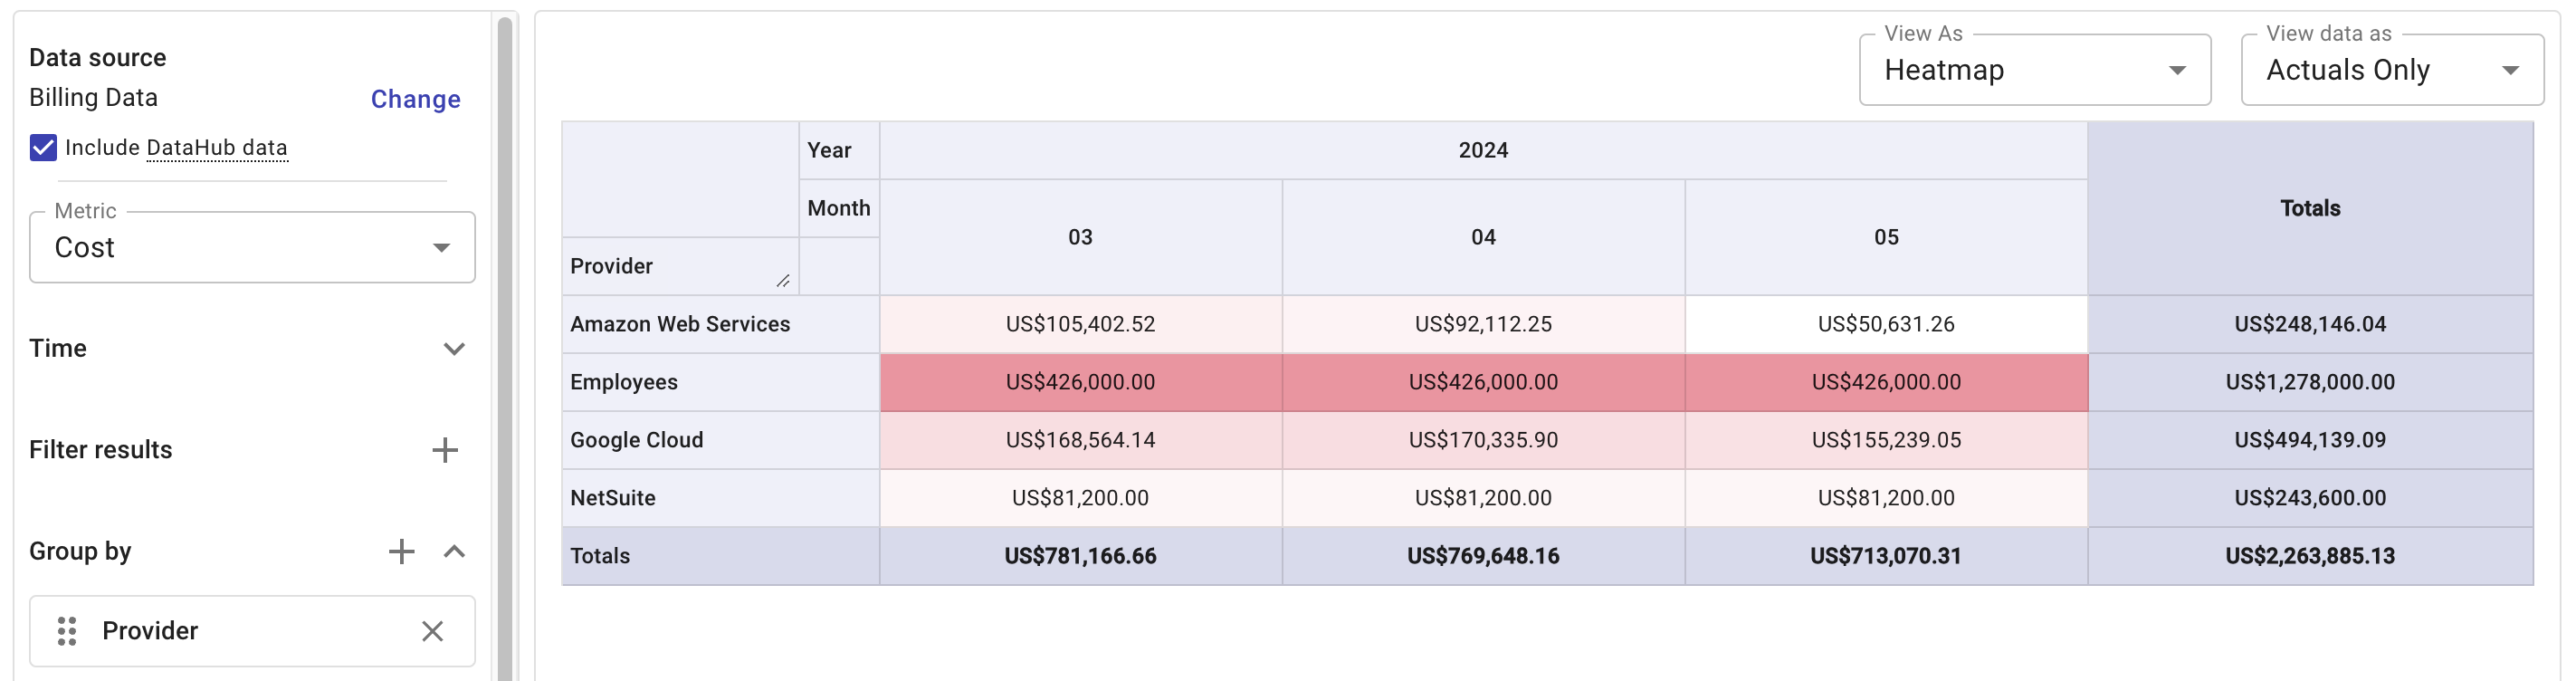
Specify dimensions and labels and run the report.
- This example report shows the monthly cost per dataset.
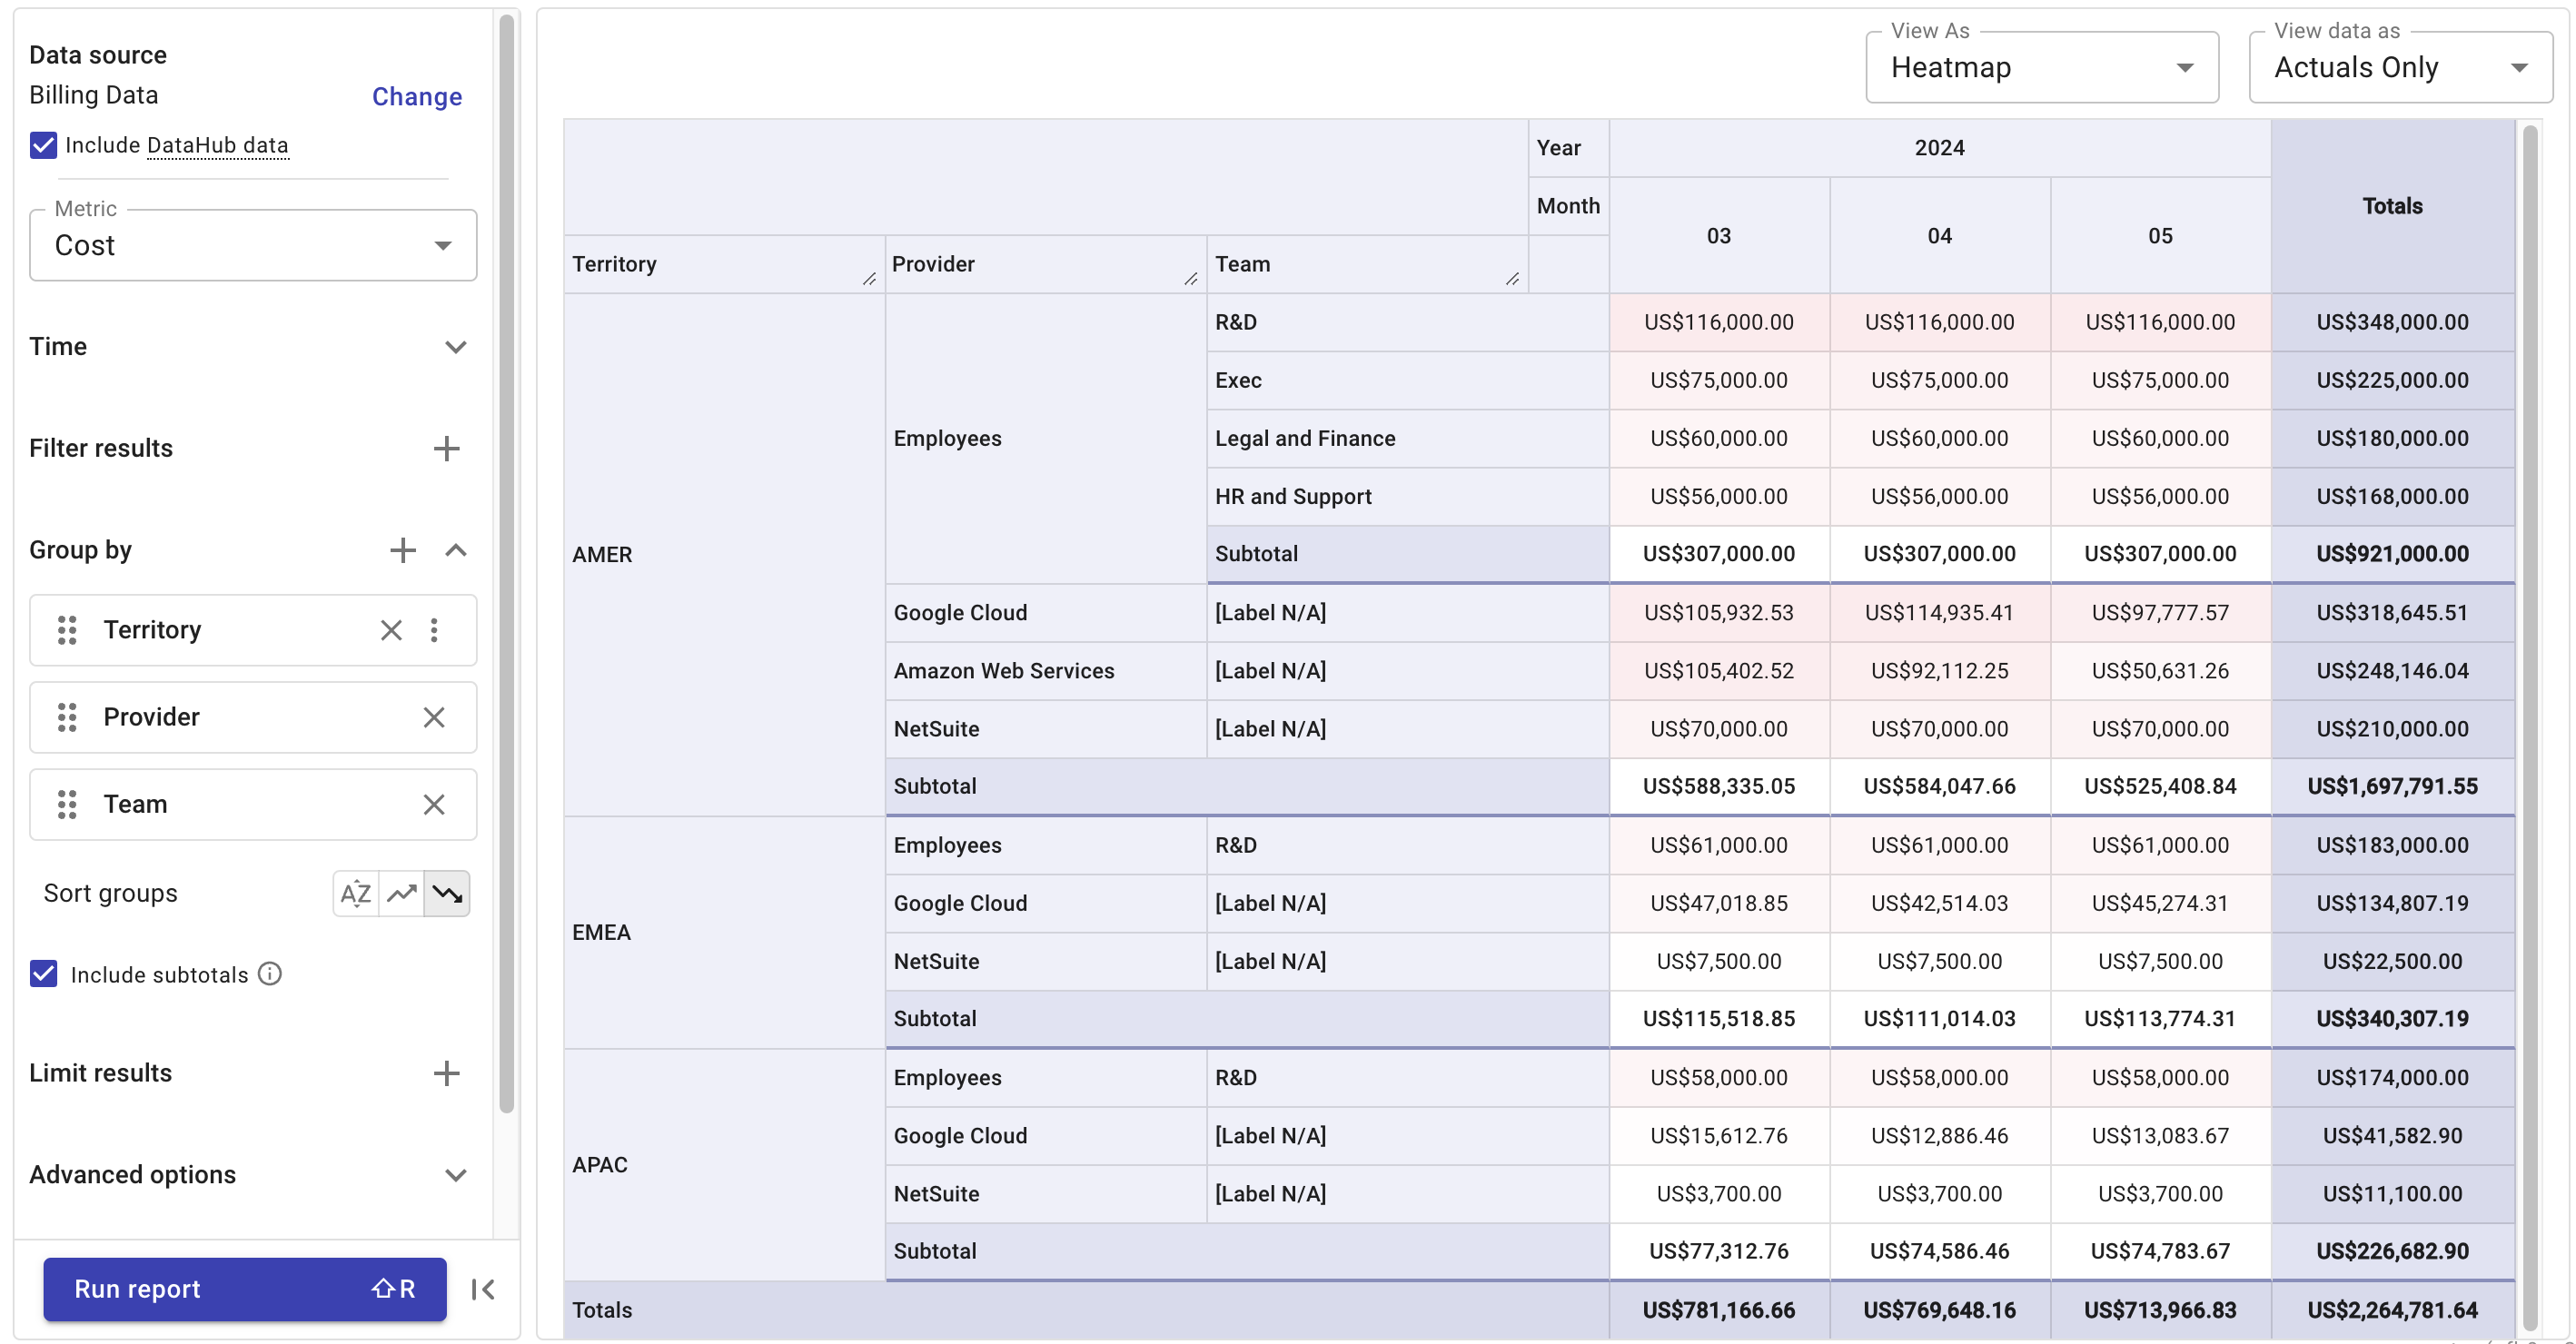
- If you've applied the
Territorylabel to all the datasets, you can break down the costs per super region.
Step 5 (optional): Configure dashboard
Once you have built one or more reports with the ingested data, you may want to add the reports to a customizable dashboard.