Databricks Intelligence
The Databricks Intelligence helps you identify and track your Databricks cost and usage and make decisions about how and when to optimize costs, monitor performance, and more.
Required permission
To access the Databricks Intelligence, your DoiT account needs the Cloud Analytics User permission.
Databricks Intelligence dashboard
The Databricks Intelligence dashboard consists of some preset report widgets that highlight various aspects of your Databricks spend and usage. It's automatically populated when your Databricks data has been imported into the DoiT console. See Connect Databricks.
To access the Databricks Intelligence dashboard, select Dashboards from the top navigation mega menu, and then select Databricks Intelligence.
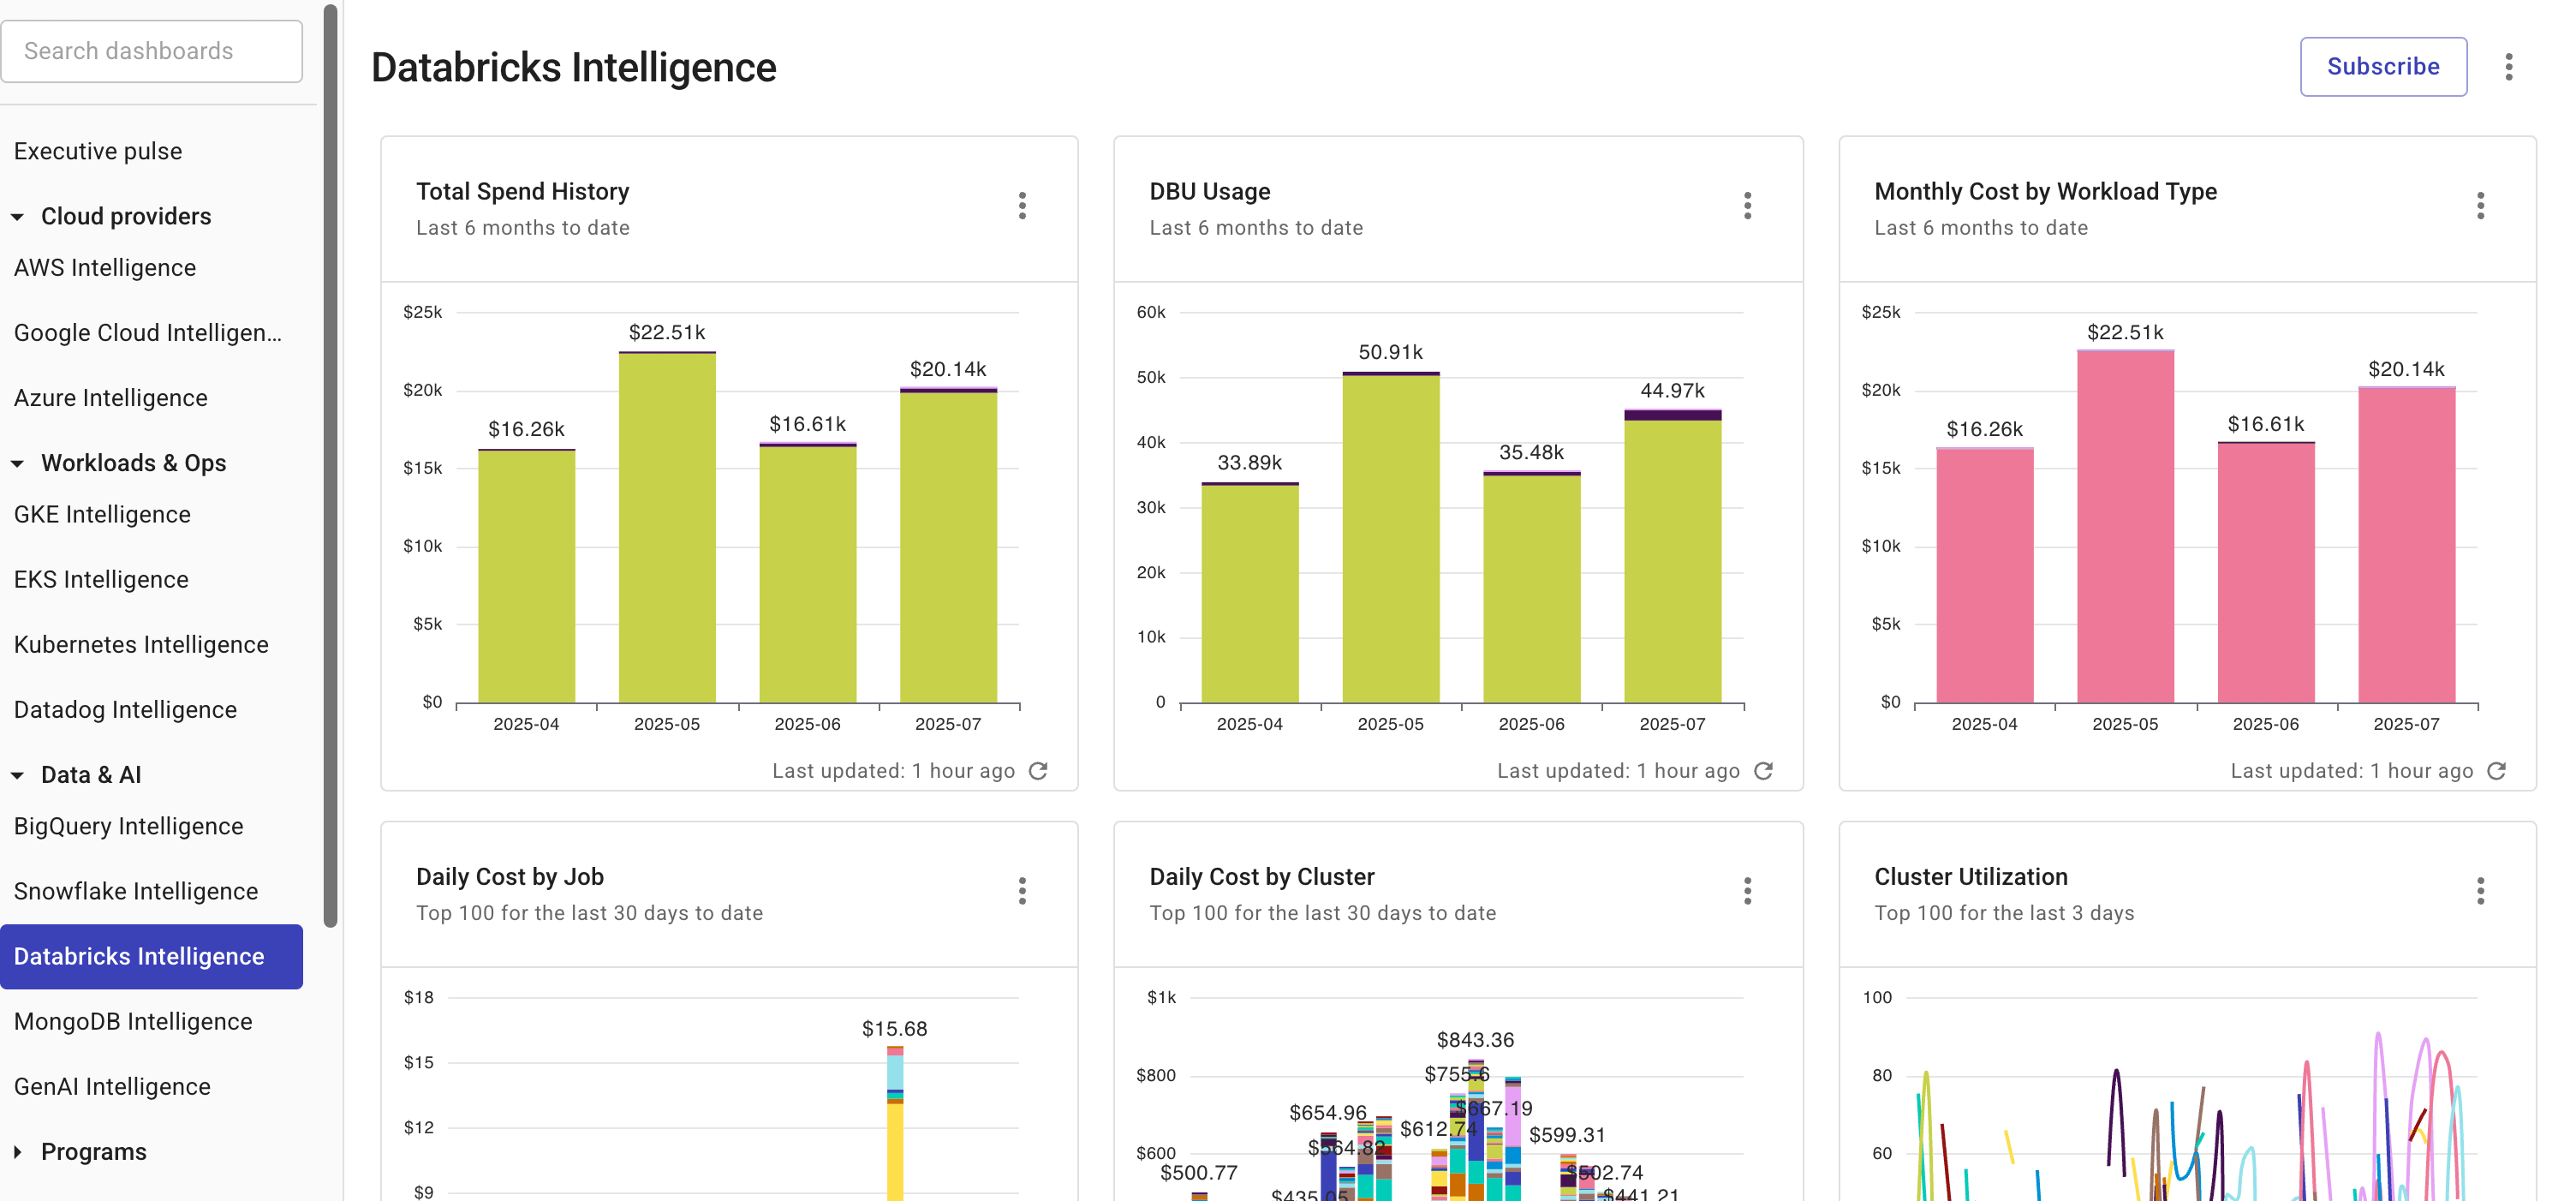
Widgets on the dashboard are updated independently of each other. See Refresh report data for more information.
You can Open full report to check the report configuration, or customize the preset report to create your own one.
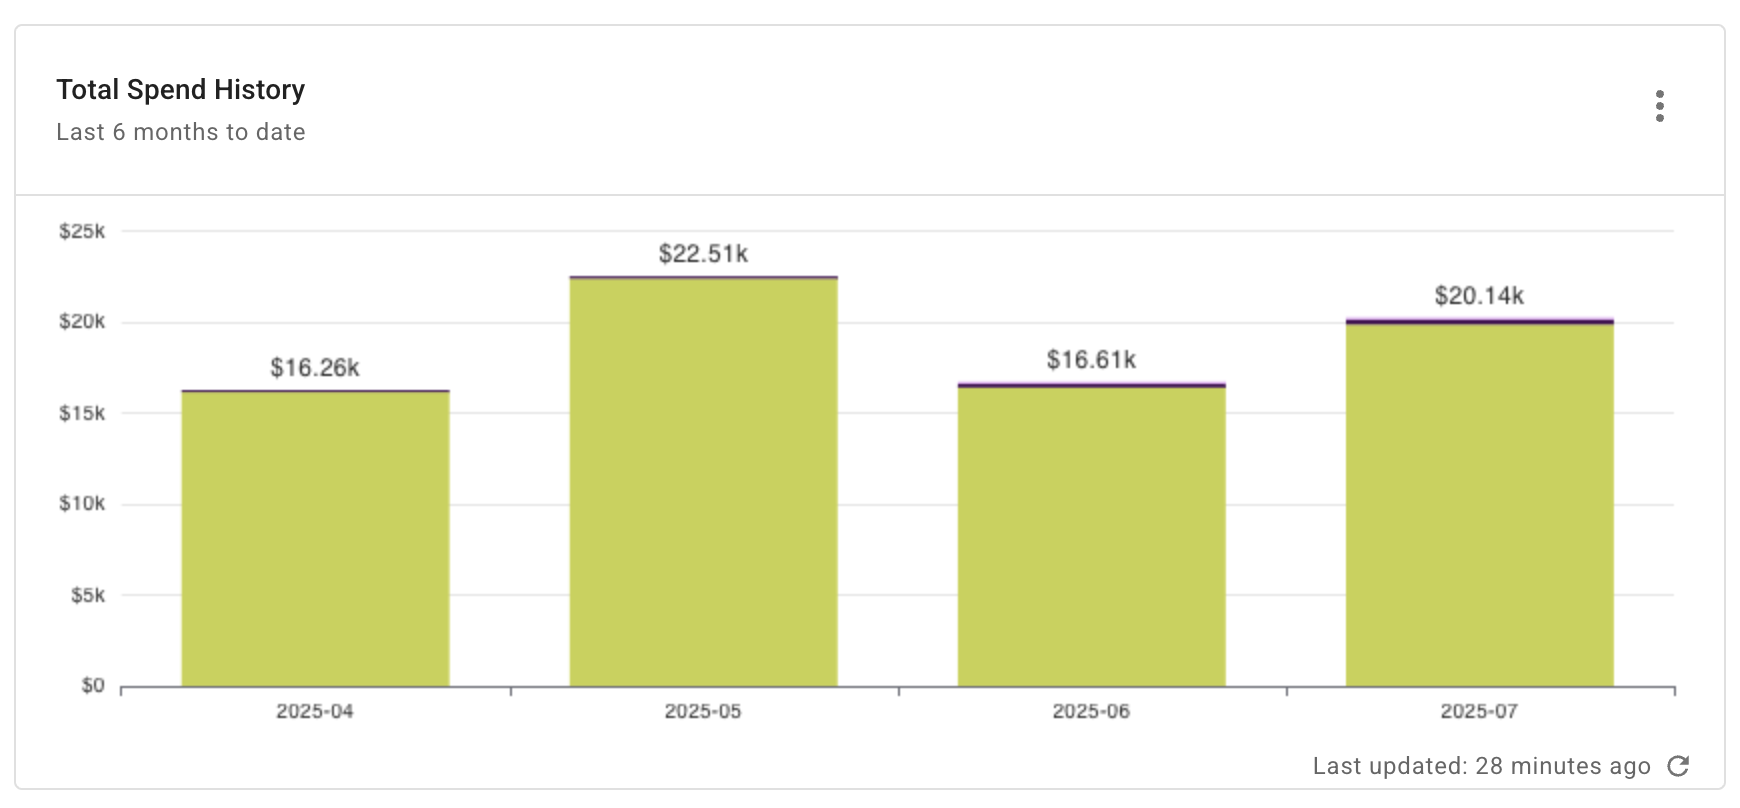
Total spend history
Shows your total monthly Databricks expenditure for the last 6 months. This is useful for understanding trends, allowing you to quickly identify increases, decreases, or spikes in consumption over time.
Report configuration:
- Metric: Cost
- Time Range: Last 6 months w. current
- Time Interval: Month
- Filters:
- Provider equals
databricks
- Provider equals
- Group by:
- Billing Account
- Project/Account name
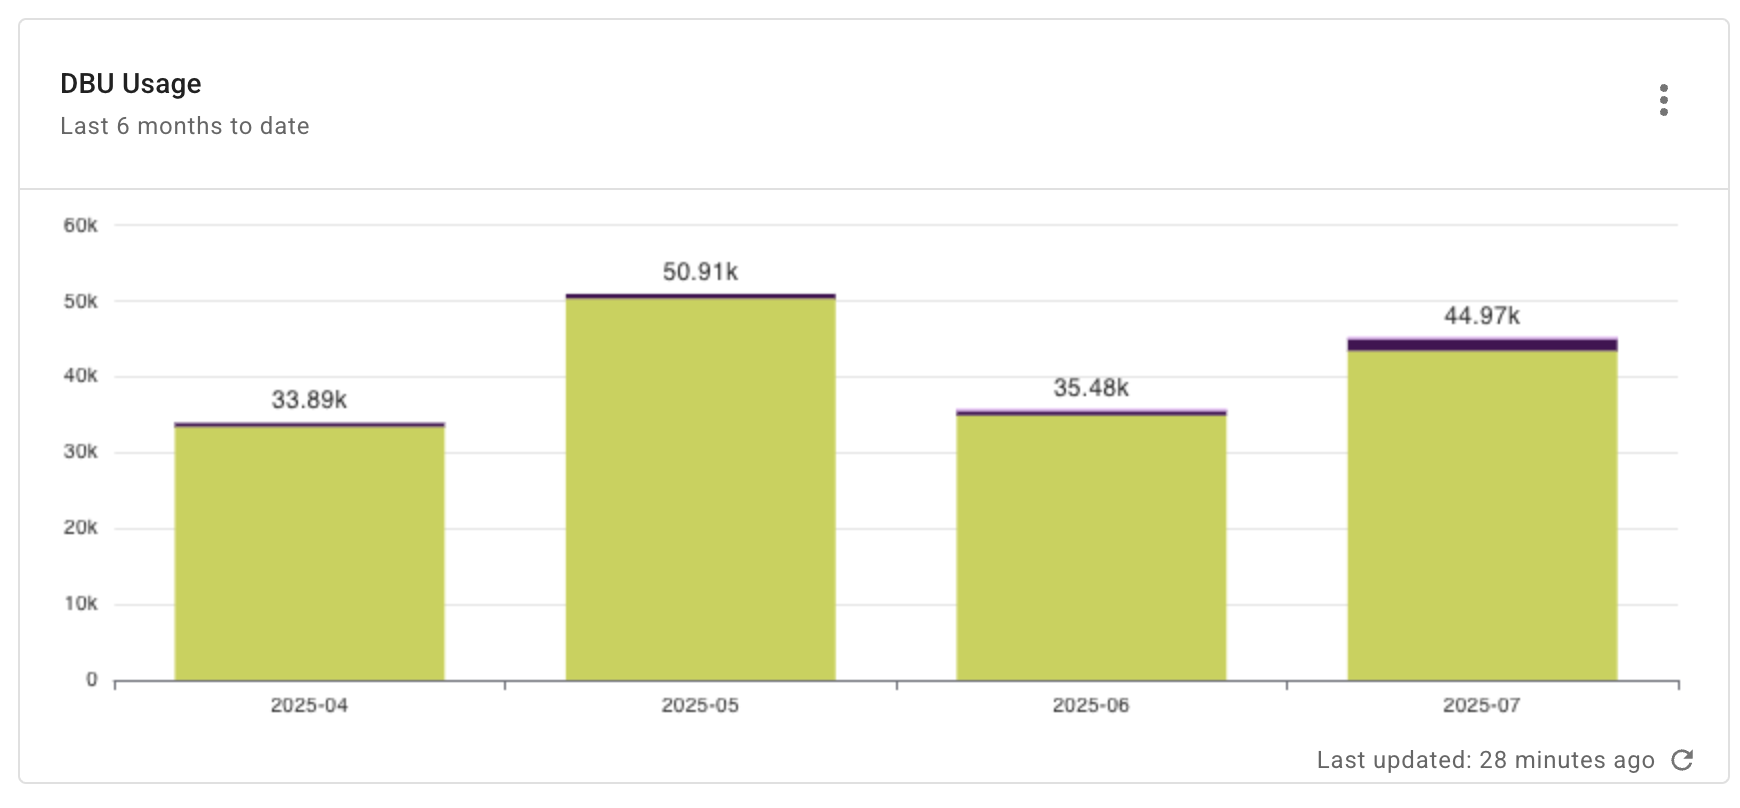
DBU usage
Shows your total monthly DBU usage for the last 6 months. This is useful for understanding the processing power consumed while your workloads are running, highlighting any increases, decreases, and spikes in your workloads over time.
Report configuration:
- Metric: Usage
- Time Range: Last 6 months w. current
- Time Interval: Month
- Filters:
- Provider equals
databricks
- Provider equals
- Group by:
- Billing Account
- Project/Account ID
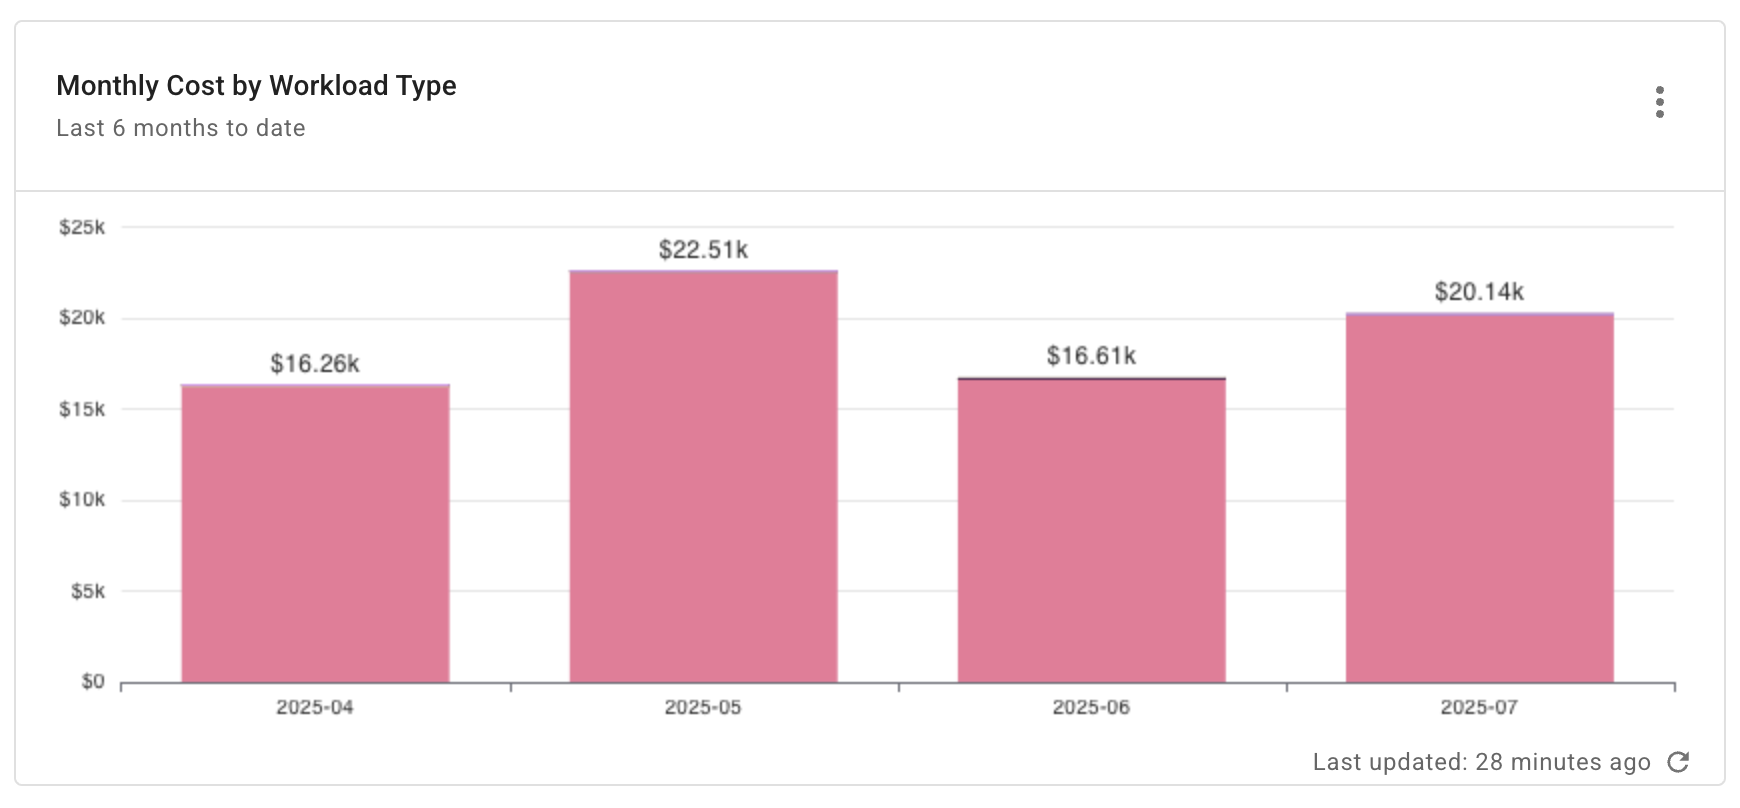
Monthly cost by workload type
Shows your total monthly Databricks expenditure by workload type for the last 6 months. This reveals trends in consumption across different DBU rates (like Interactive, Jobs, or SQL warehouses) allowing you to pinpoint which specific activities are driving costs. This helps you optimize workloads and align resources with actual usage.
Report configuration:
- Metric: Cost
- Time Range: Last 6 months w. current
- Time Interval: Month
- Filters:
- Provider equals
databricks
- Provider equals
- Group by:
- System label:
databricks/usage-type
- System label:
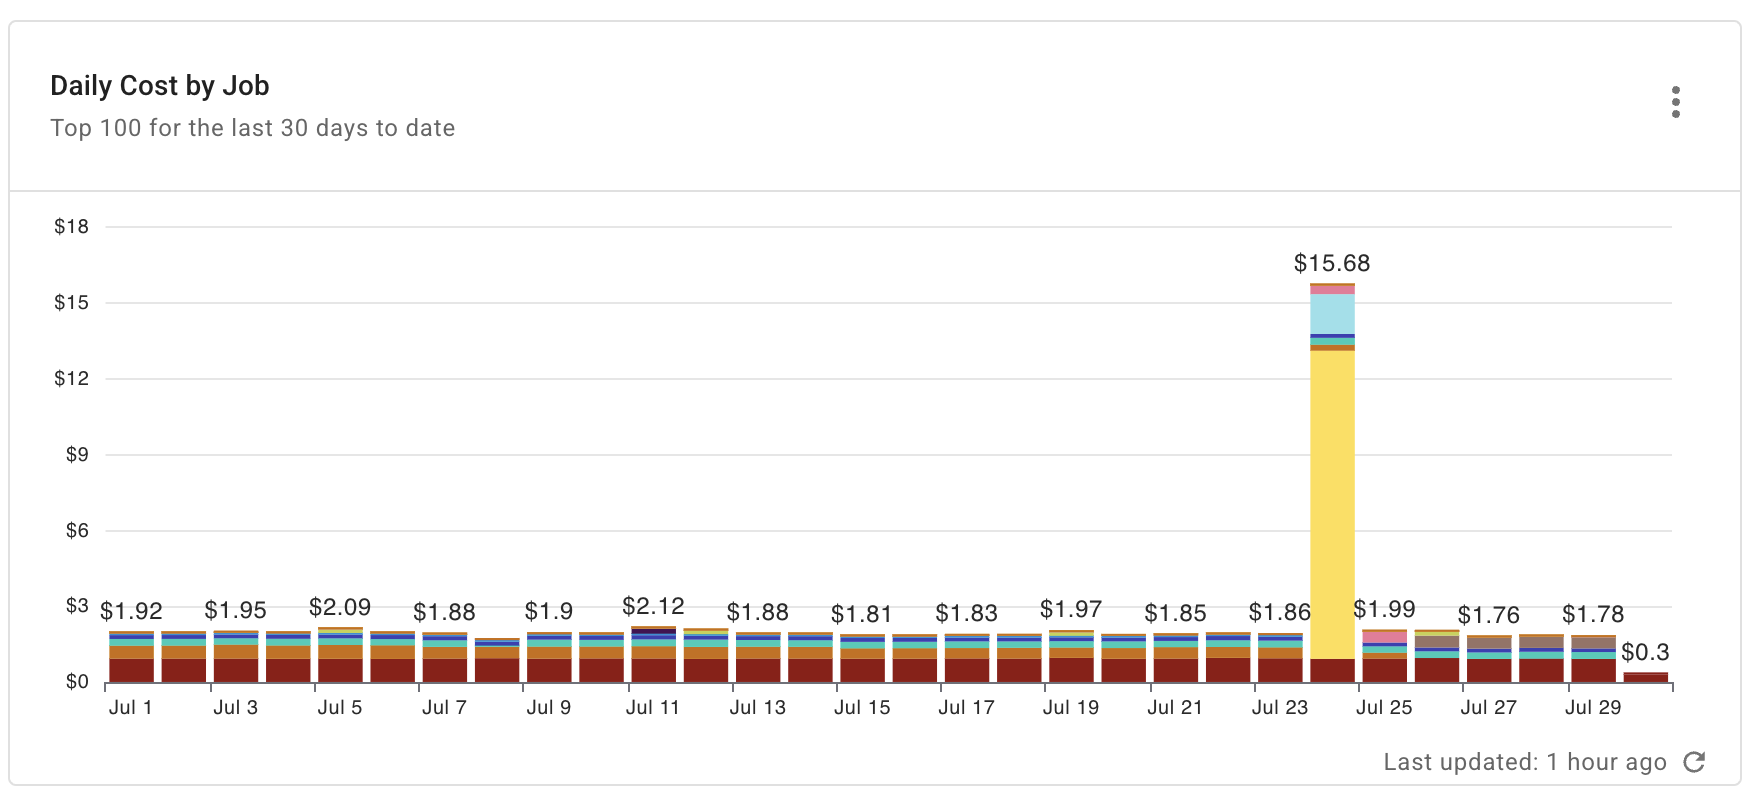
Daily cost by job
Shows the daily cost of your top 100 Databricks jobs for the last 30 days. This is useful for understanding granular cost optimization and operation efficiency. It allows you to identify the jobs that are most expensive, detect daily costs spikes or anomalies, and attribute spending to particular automated workloads.
Report configuration:
- Metric: Cost
- Time Range: Last 30 days w. current
- Time Interval: Day
- Filters:
- Provider equals
databricks
- Provider equals
- Group by:
- System label:
usage_metadata/job_name
- System label:
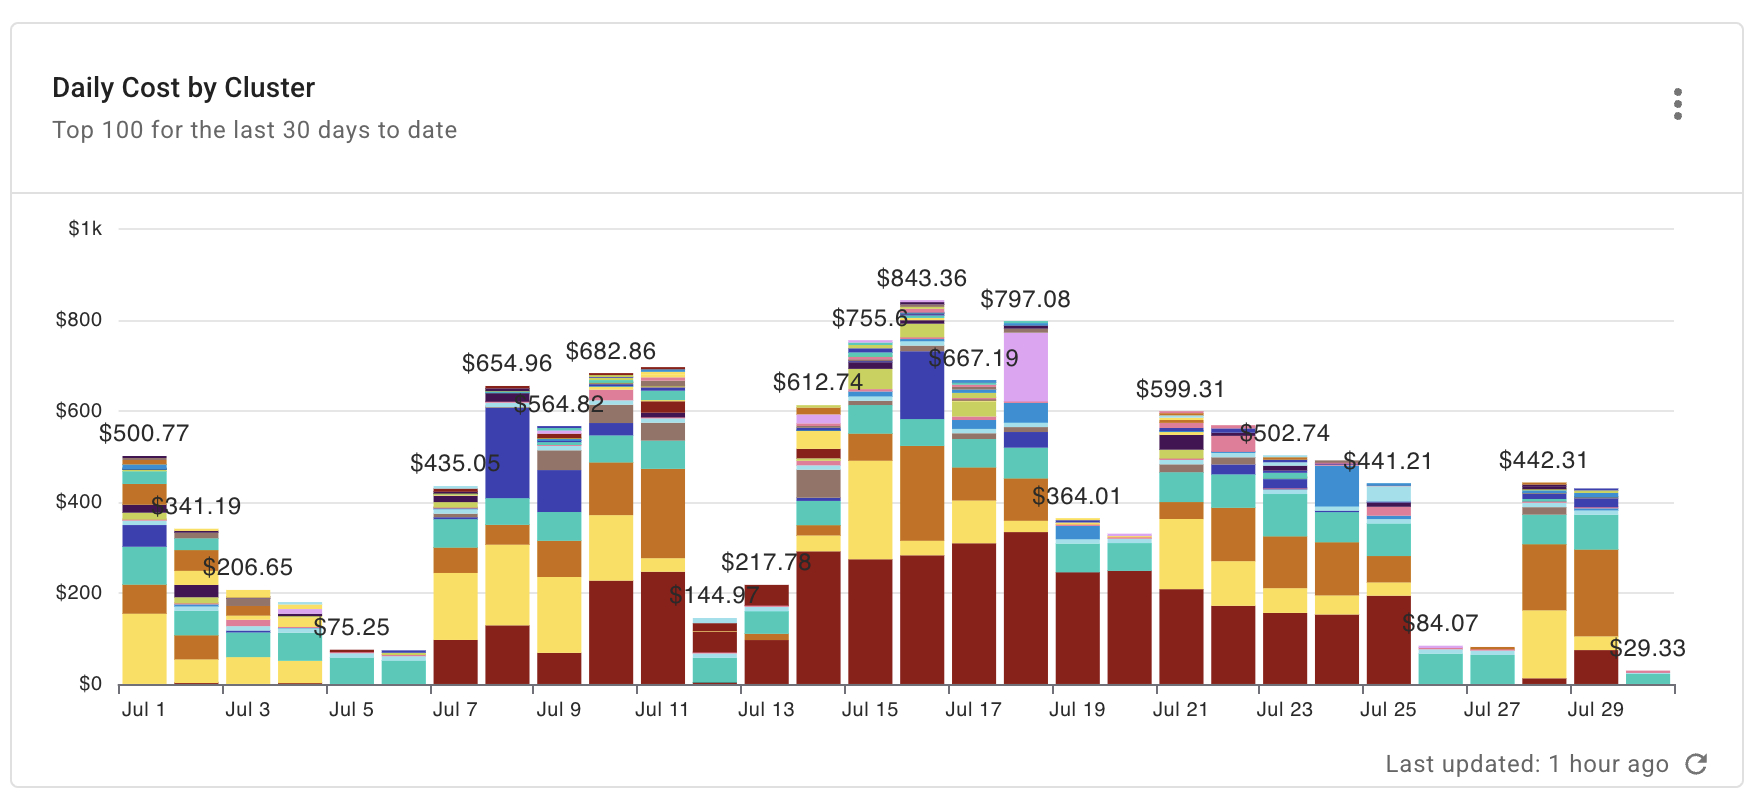
Daily cost by cluster
Shows the daily cost of your top 100 Databricks clusters for the last 30 days. This is useful for optimizing your compute resources and managing spending. This report allows you to pinpoint expensive or inefficient clusters, and understand how individual clusters contribute to your overall bill.
Report configuration:
- Metric: Cost
- Time Range: Last 30 days w. current
- Time Interval: Day
- Filters:
- Provider equals
databricks
- Provider equals
- Group by:
- System label:
databricks/cluster_name
- System label:
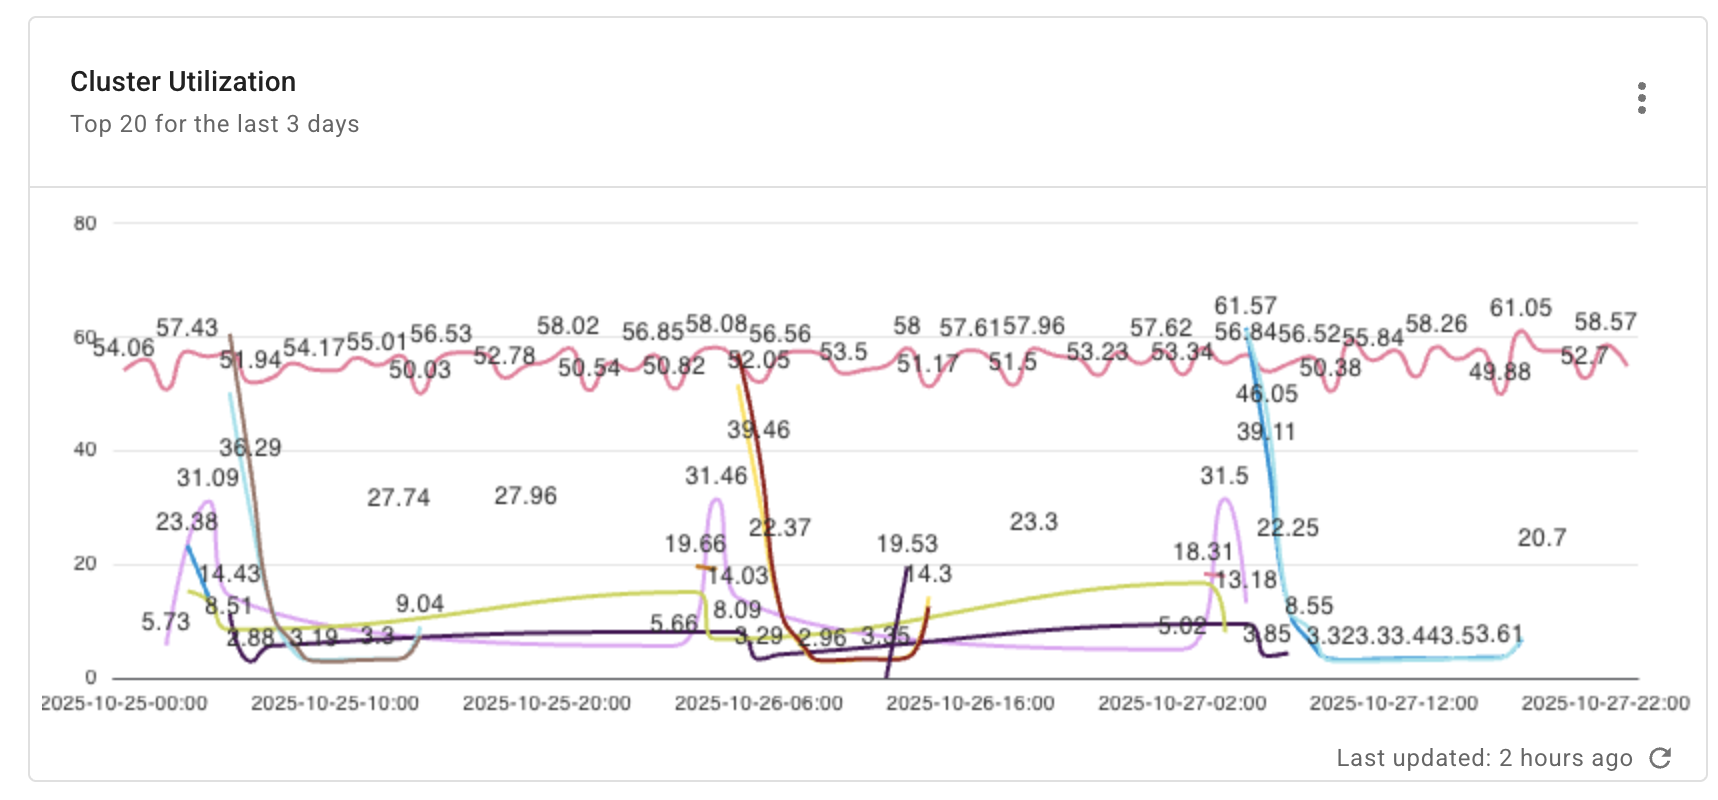
Cluster utilization
Shows the daily utilization of your top 100 Databricks clusters for the last 3 days. This report provides immediate operational insights and performance. It allows you to quickly identify recent resource bottlenecks, detect unexpected workload spikes, and make agile decisions about cluster scaling or job scheduling.
Report configuration:
- Metric: Cluster CPU Utilization
- Time Range: Last 3 days
- Time Interval: Day
- Filters:
- Provider equals
databricks
- Provider equals
- Group by:
- System label:
databricks/cluster_name
- System label: