MongoDB Intelligence
The MongoDB Intelligence helps you identify and track your MongoDB cost and usage and make decisions about how and when to optimize costs, monitor performance, and more.
Required permission
To access the MongoDB Intelligence, your DoiT account needs the Cloud Analytics User permission.
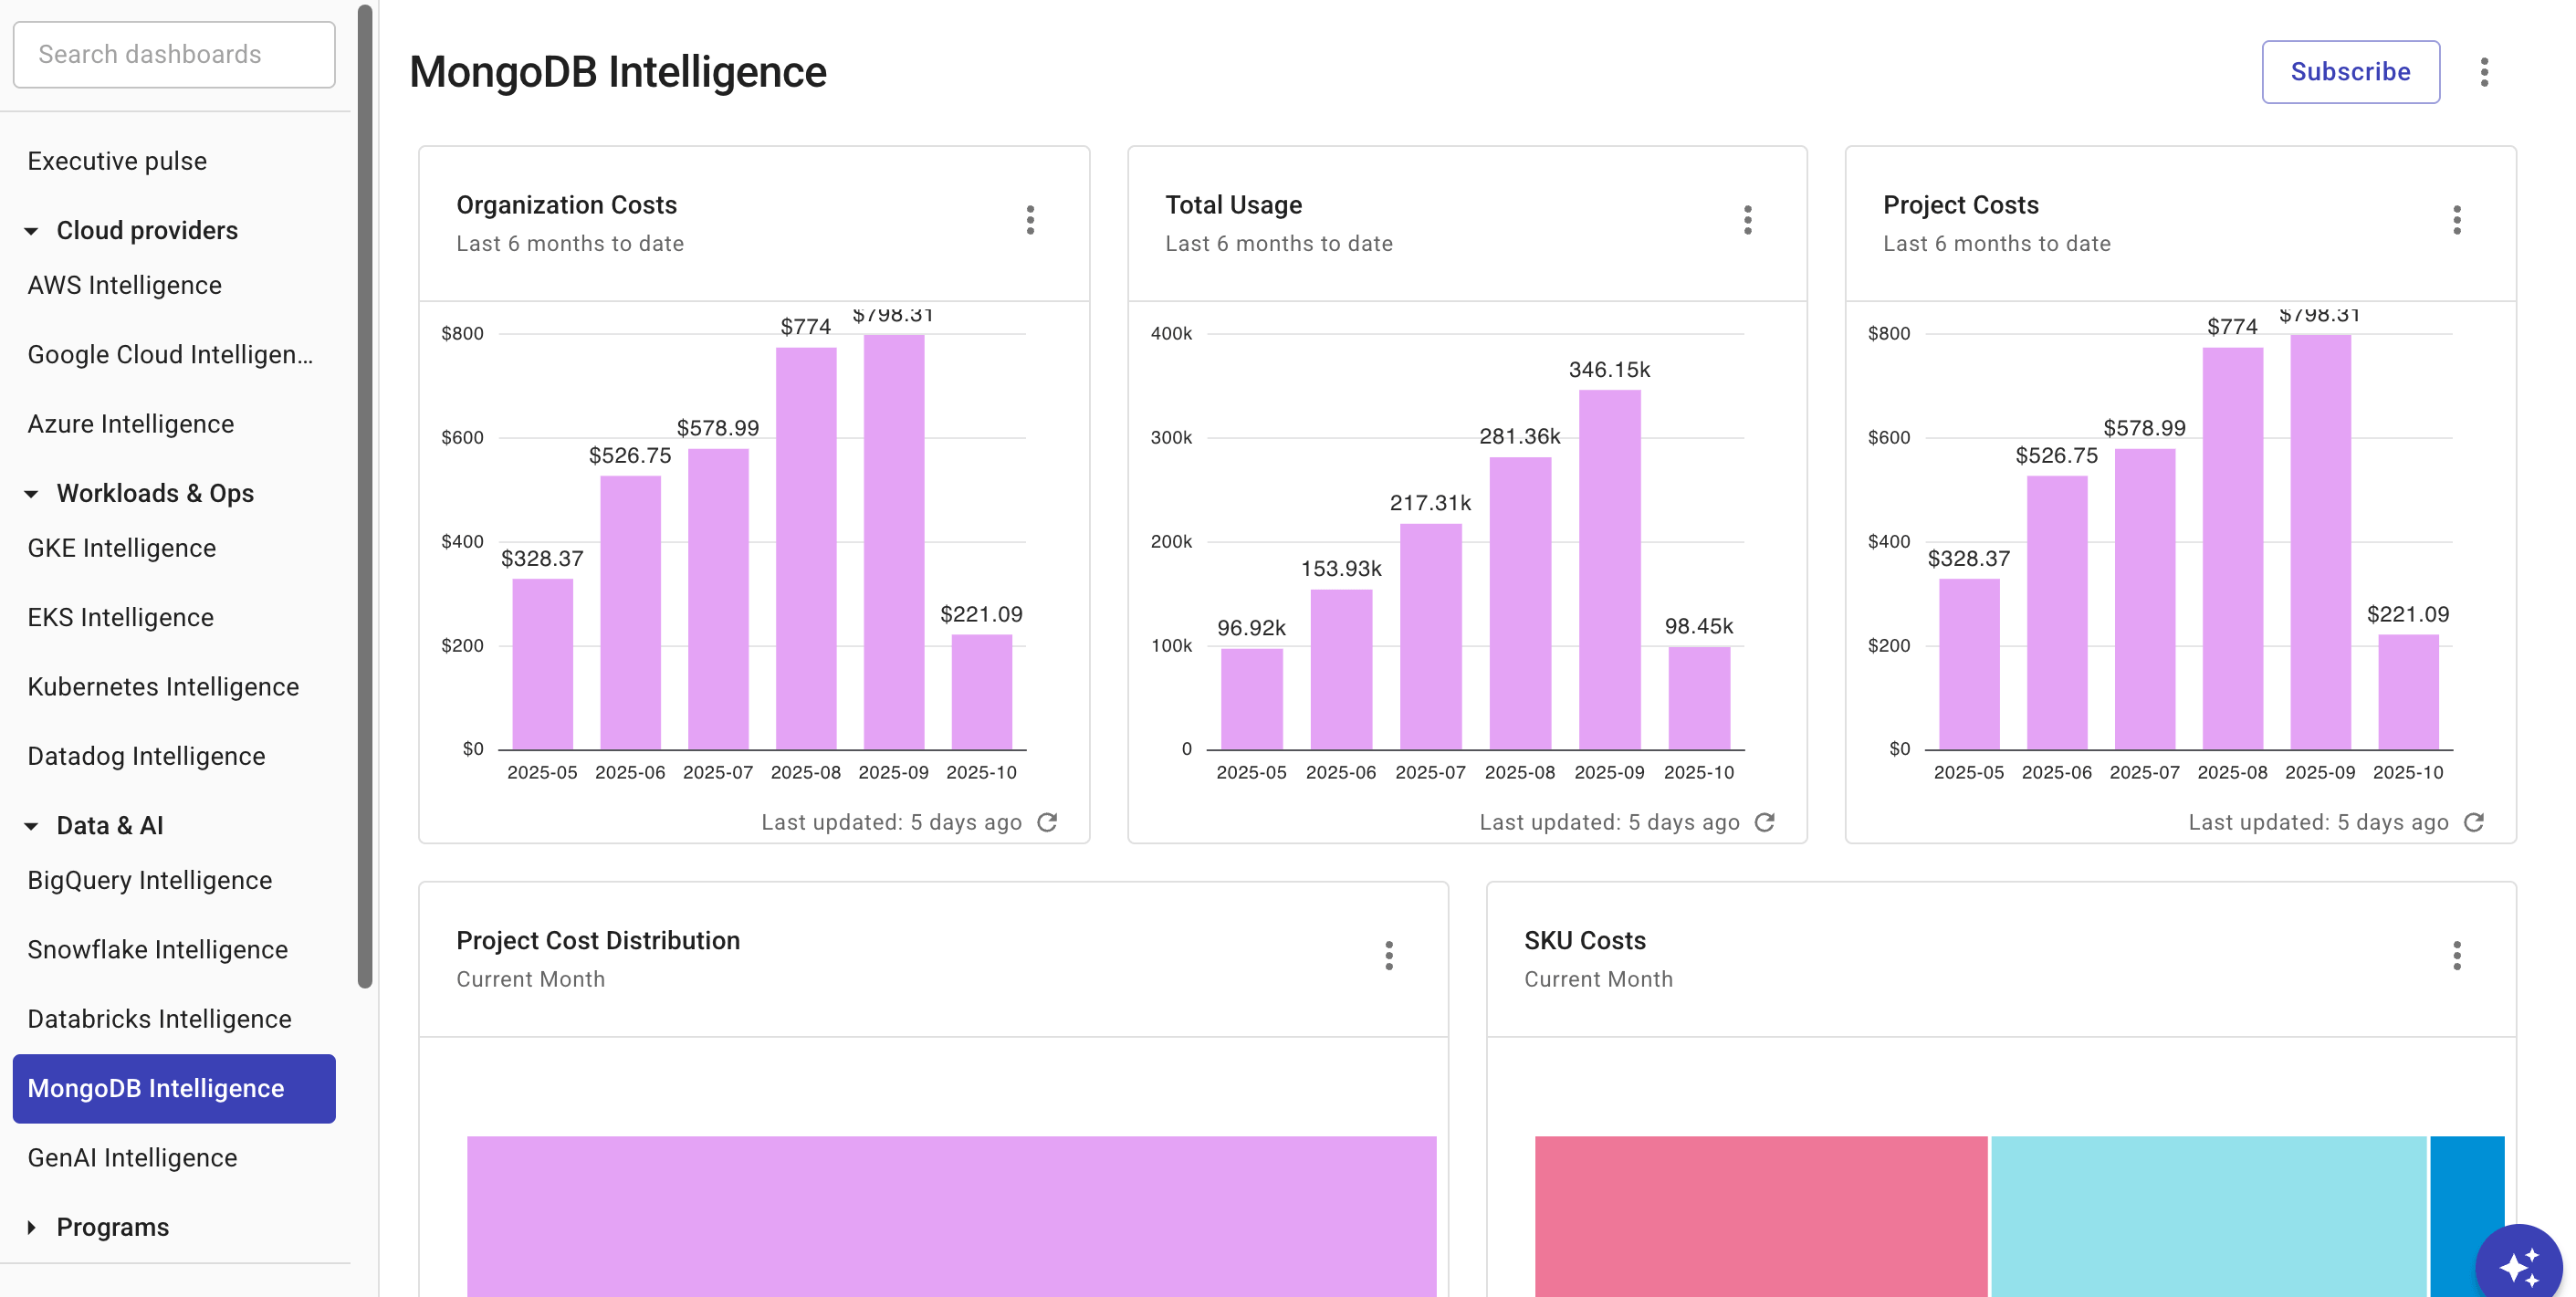
MongoDB Intelligence dashboard
The MongoDB Intelligence dashboard consists of some preset report widgets that highlight various aspects of your MongoDB spend and usage. It's automatically populated when your MongoDB data has been imported into the DoiT console. See Connect MongoDB.
To access the MongoDB Intelligence dashboard, select Dashboards from the top navigation mega menu, and then select MongoDB Intelligence.
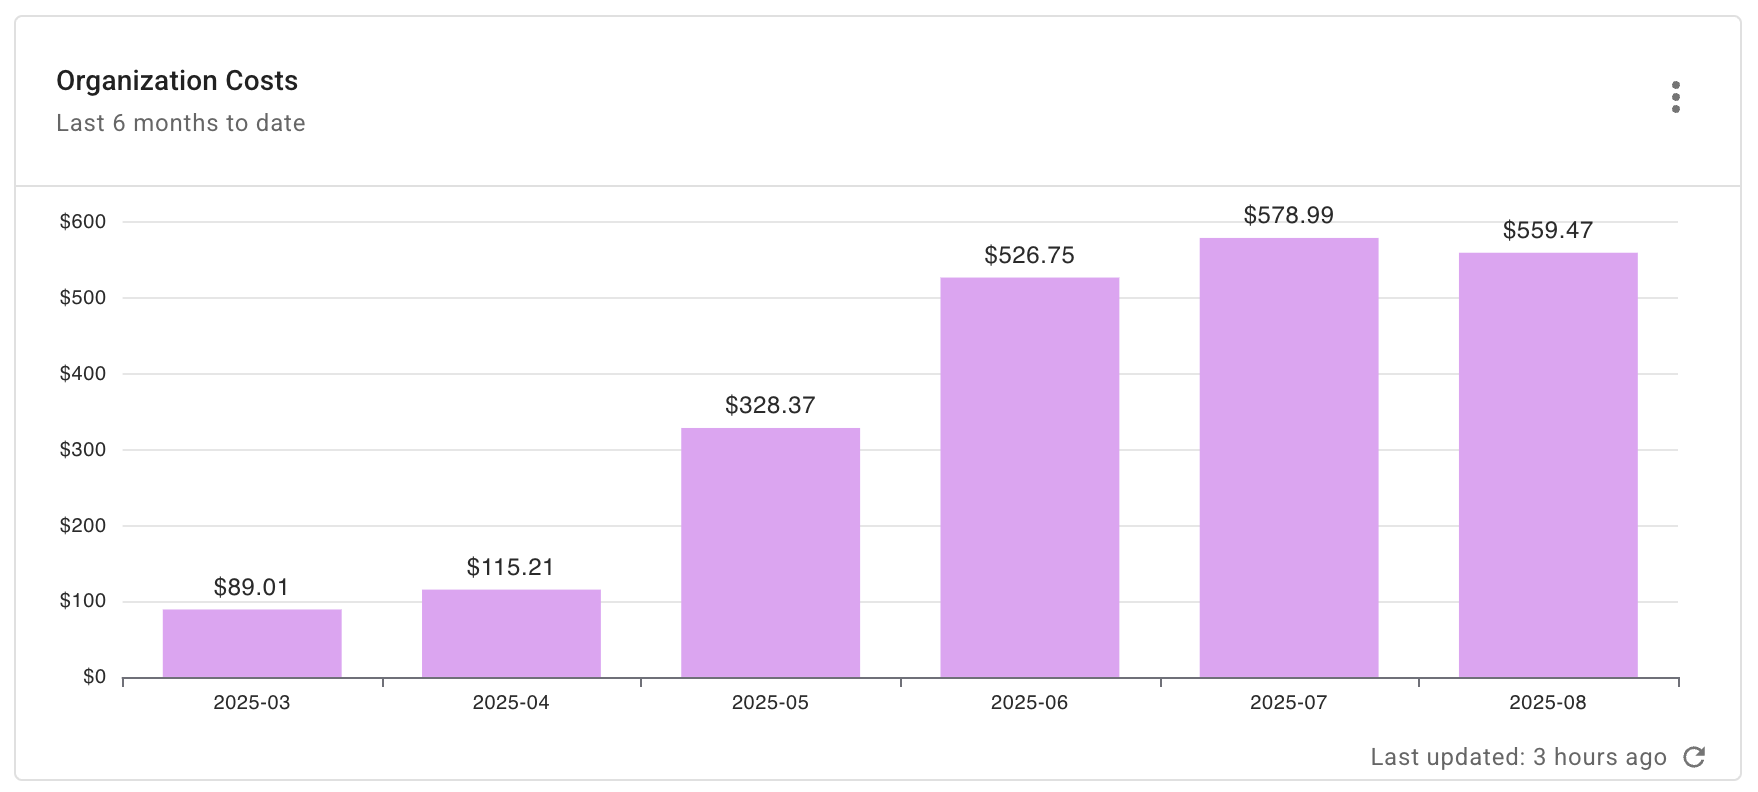
Organization costs
Shows the total MongoDB expenditure for the last 6 months for your organization. This is useful for understanding trends, allowing you to quickly identify increases, decreases, or spikes in consumption over time.
Report configuration:
- Metric: Cost
- Time Range: Last 6 months w. current
- Time Interval: Month
- Filters:
- Provider equals
MongoDB - Publisher equals
MongoDB
- Provider equals
- Group by:
- Organization name
- Project/account ID
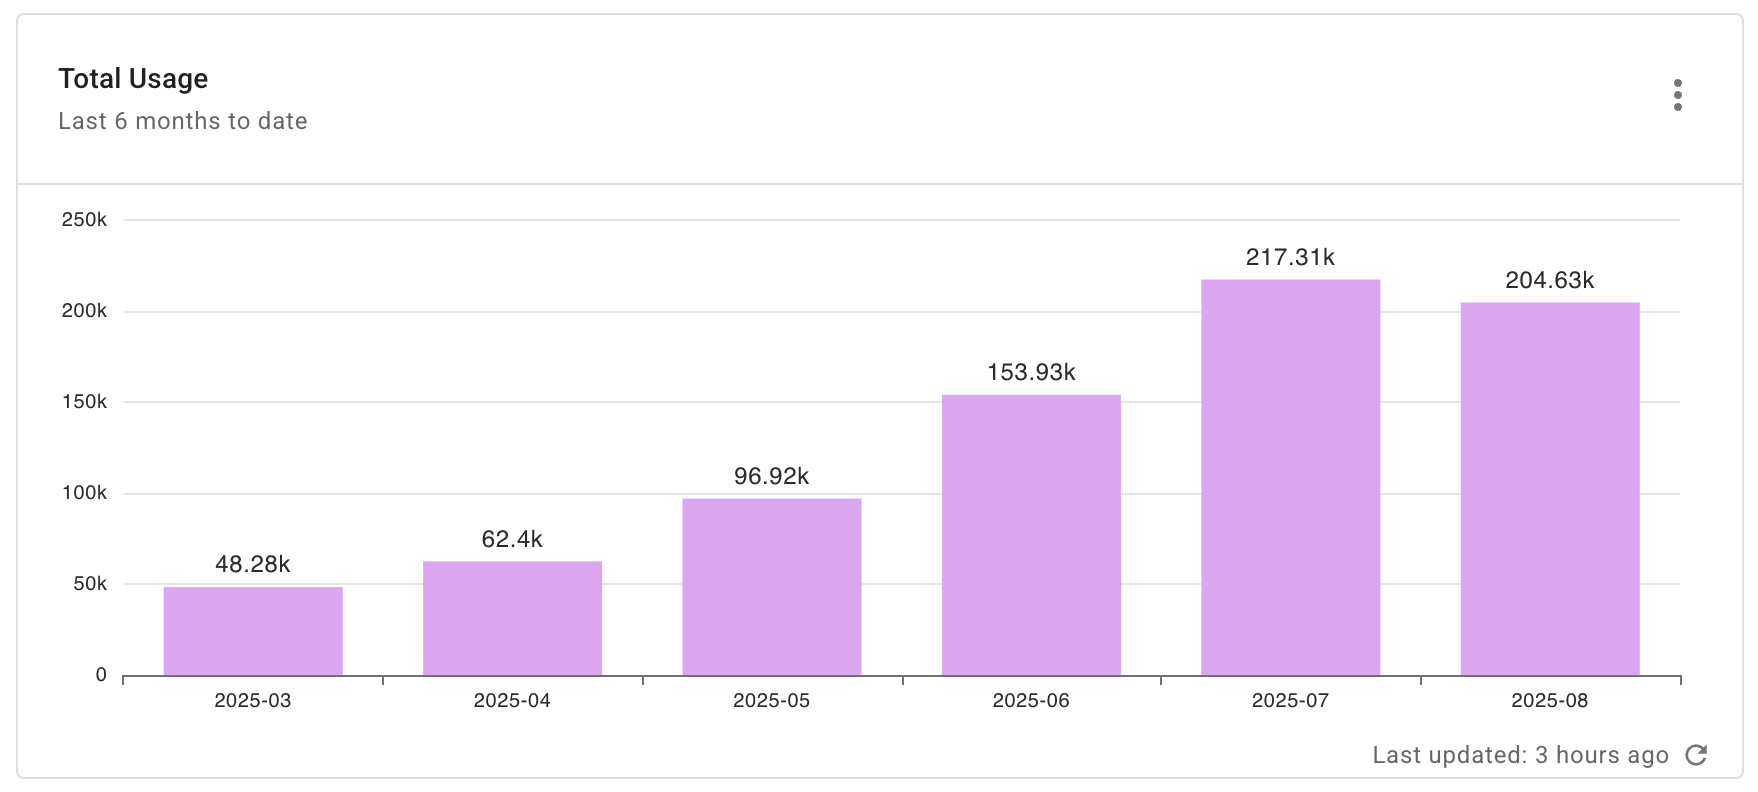
Total usage
Shows your total monthly usage for the last 6 months. This is useful for understanding trends and patterns that are not visible in real-time monitoring, leading to improvements in performance, cost, and overall system health.
Report configuration:
- Metric: Usage
- Time Range: Last 6 months w. current
- Time Interval: Month
- Filters:
- Provider equals
MongoDB - Publisher equals
MongoDB
- Provider equals
- Group by:
- Billing Account
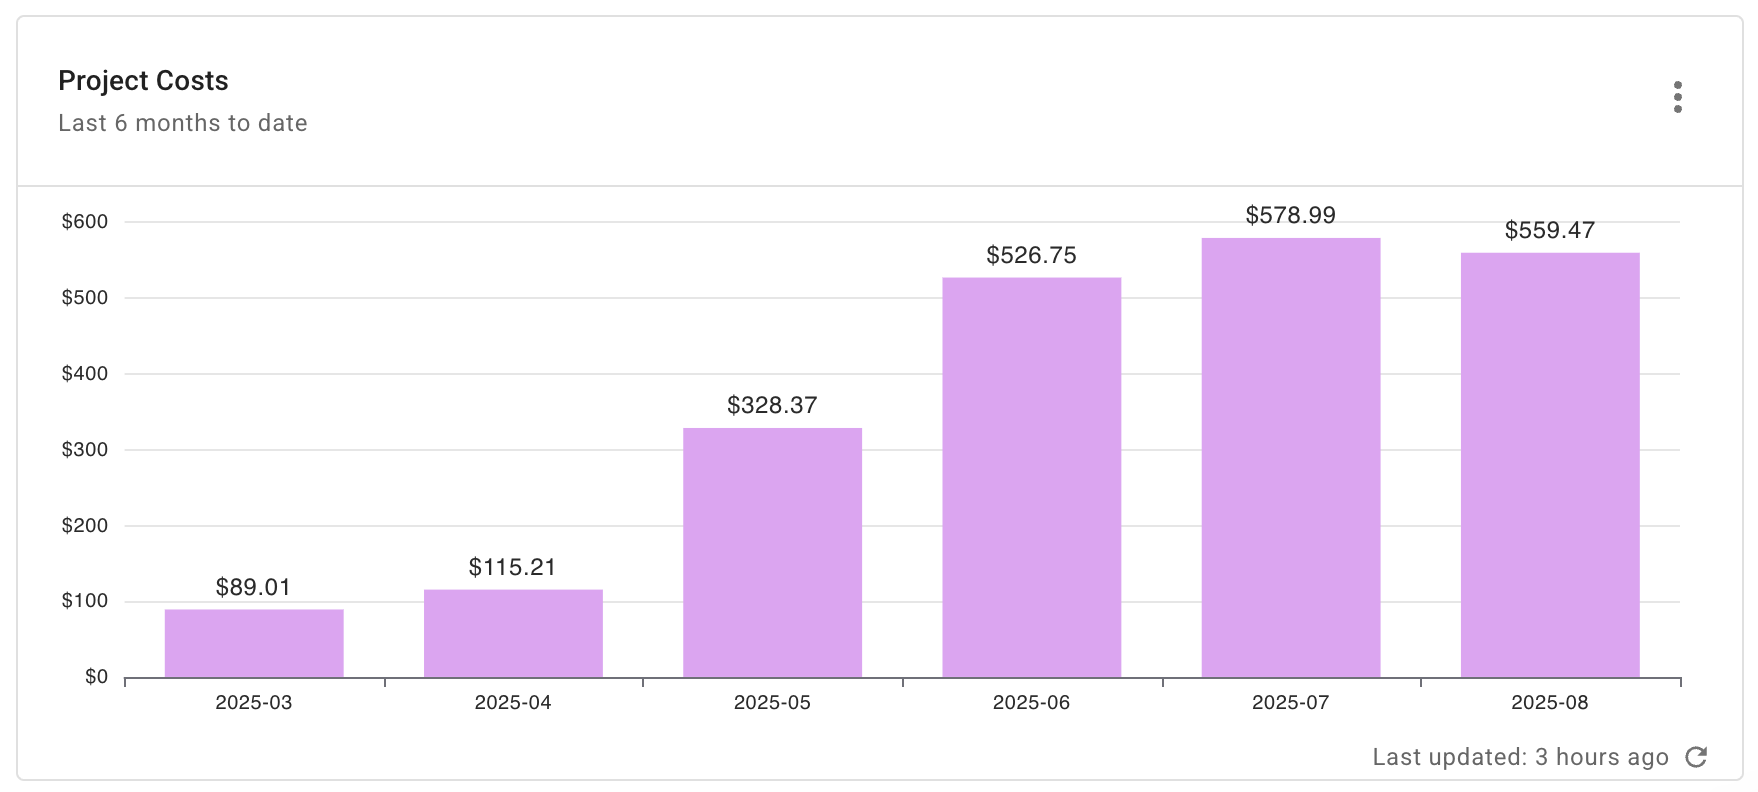
Project costs
Shows your monthly project costs for the last 6 months. This is useful for strategic planning, identifying trends, and making optimizations.
Report configuration:
- Metric: Cost
- Time Range: Last 6 months w. current
- Time Interval: Month
- Filters:
- Provider equals
MongoDB - Publisher equals
MongoDB
- Provider equals
- Group by: Project/account name
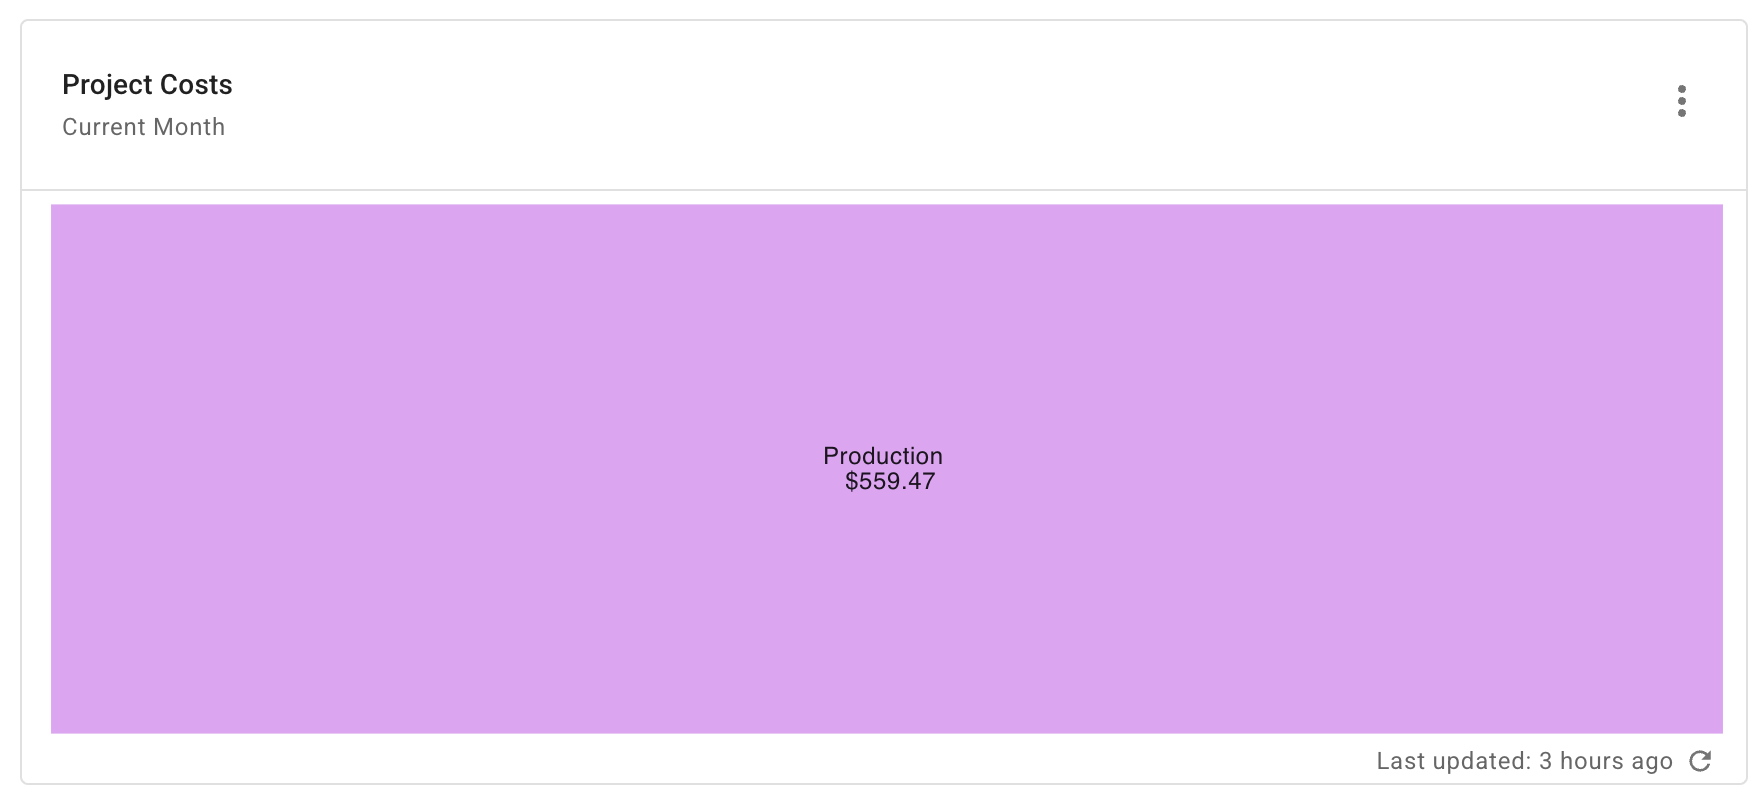
Project cost distribution
Shows your project costs for the current month. This provides immediate, actionable insights that allow you to make timely decisions, prevent overspending, and ensure your resources are being used efficiently.
Report configuration:
- Metric: Cost
- Time Range: Current month
- Time Interval: Month
- Filters:
- Provider equals
MongoDB - Publisher equals
MongoDB
- Provider equals
- Group by: Project/account name
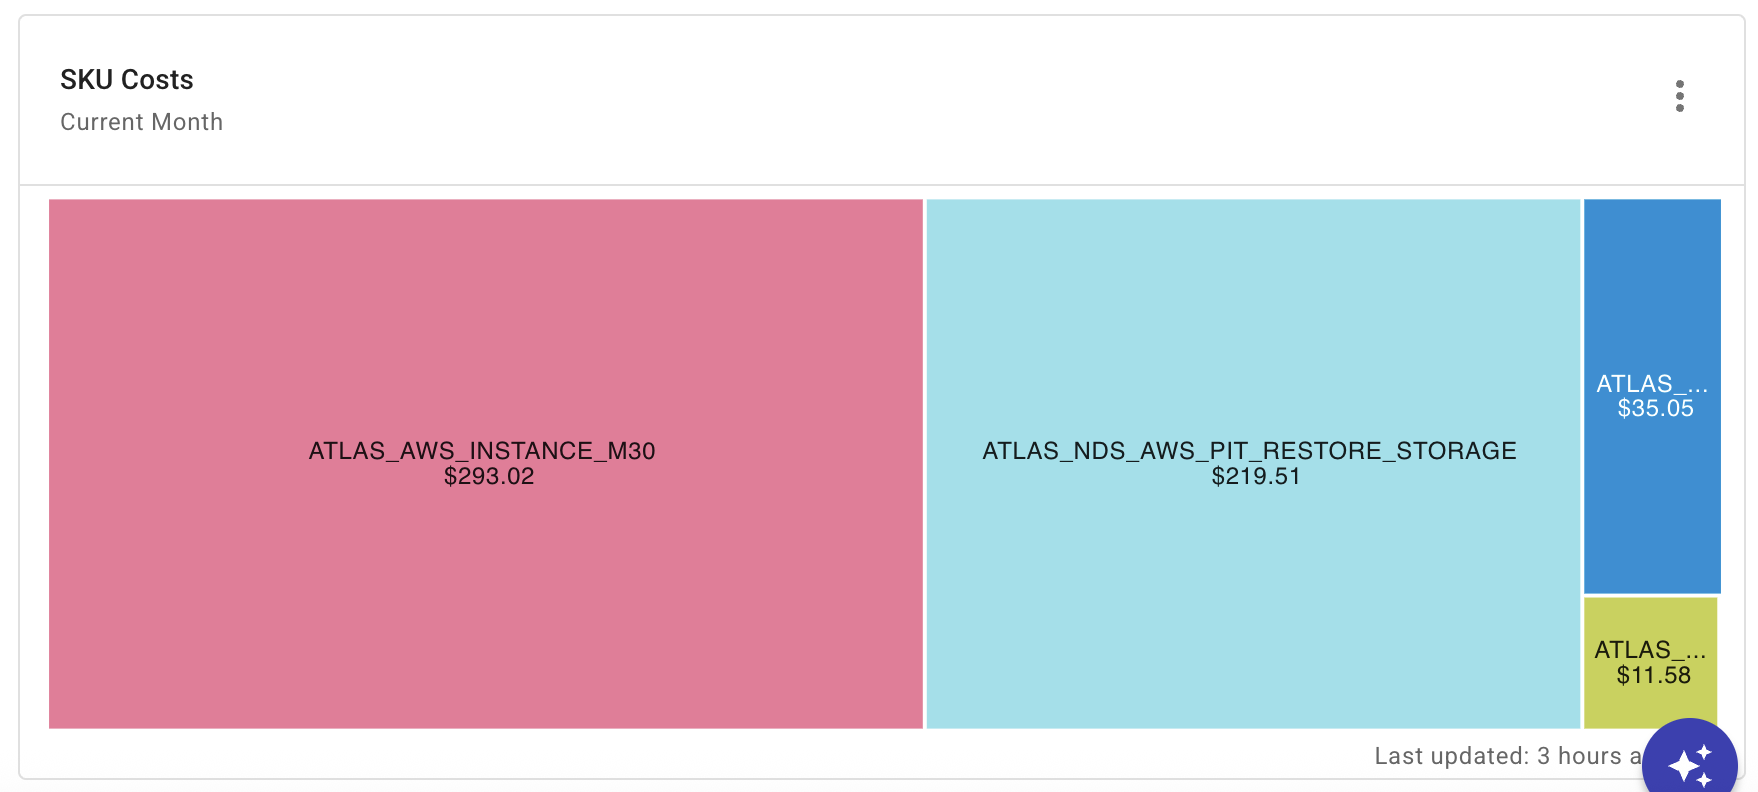
SKU costs
Shows your SKU costs for the current month. This report provides a granular breakdown of costs by SKU so you can see the resources that are contributing most to your bill. This report enables you to spot suddent, unexplained spikes in a specific SKU, enabling you to make adjustments quickly.
Report configuration:
- Metric: Cost
- Time Range: w. current
- Time Interval: Month
- Filters:
- Provider equals
MongoDB - Publisher equals
MongoDB
- Provider equals
- Group by: SKU