Dashboards
Dashboards aggregate reports and visualizations for key perspectives, such as revenue, usage, margin, and operational health, providing visibility into financial and operational data.
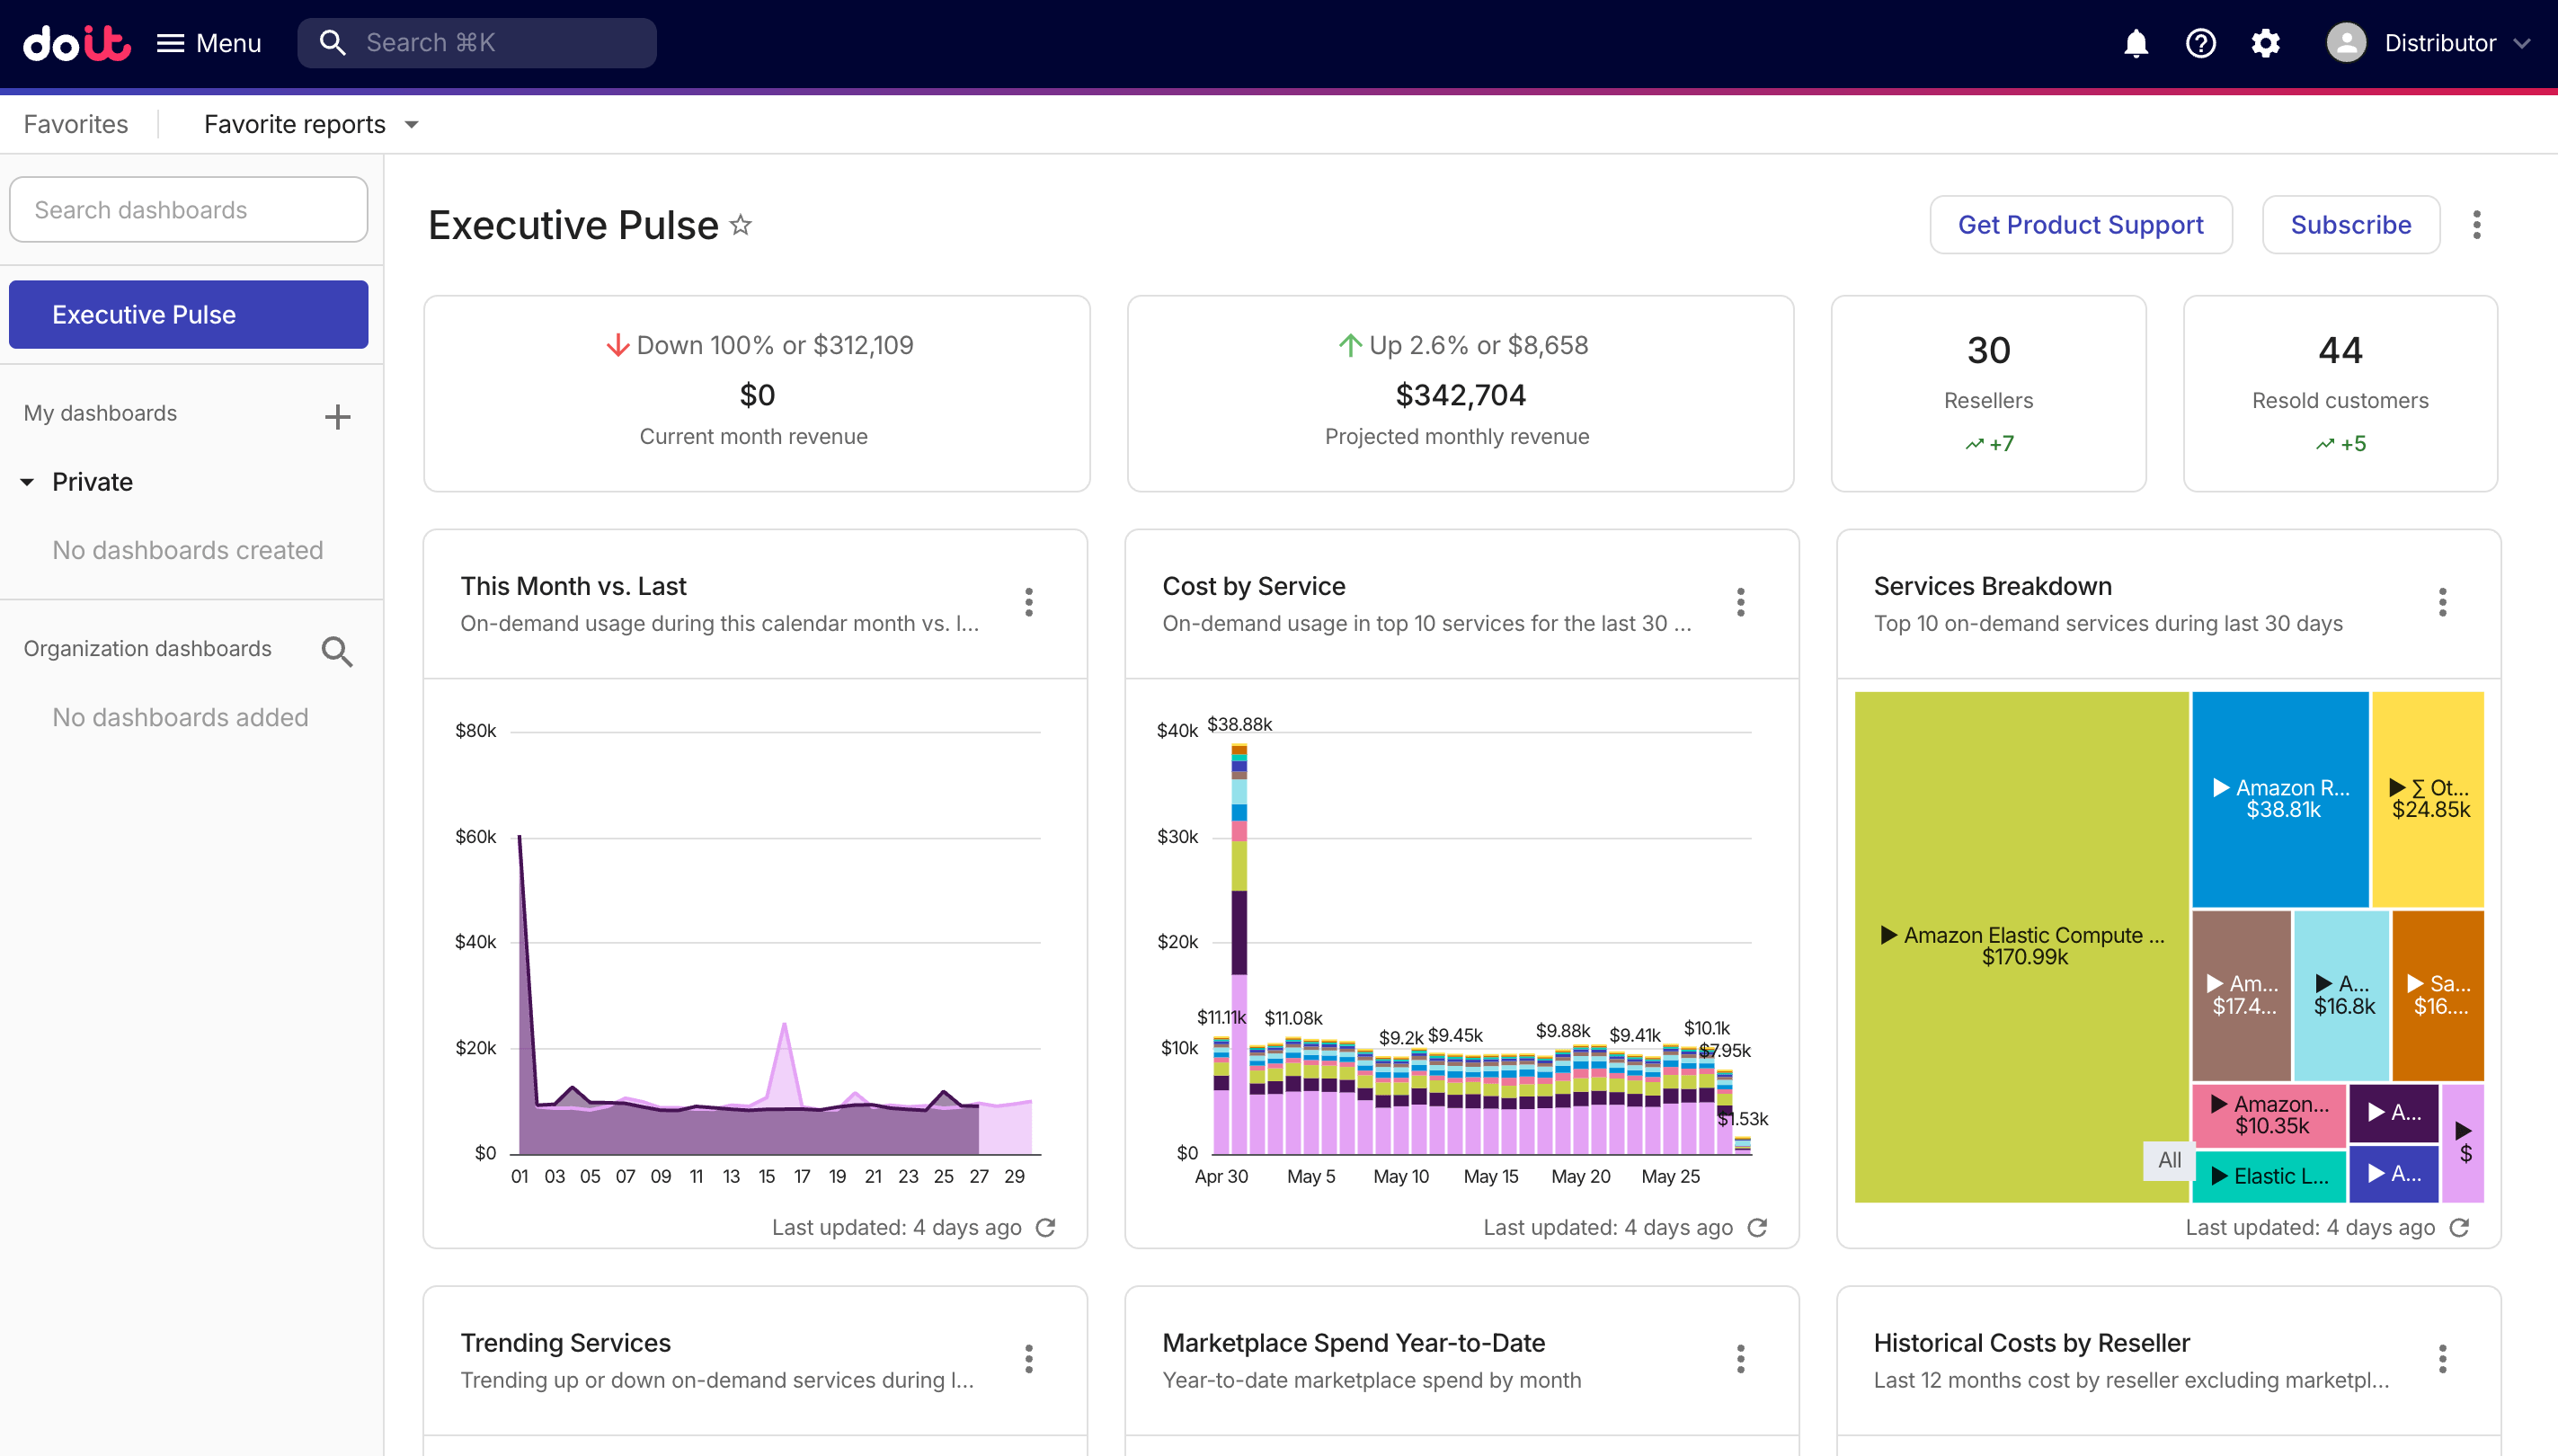
Executive Pulse
To access the Executive Pulse dashboard, select Dashboards from the top navigation mega menu.
-
The dashboard contains two parts: summary cards and preset report widgets.
-
The Get Product Support option is available only at the distributor level.
Summary cards
The summary cards show high-level revenue patterns, including the amount of revenue and the trend, and the total number of customers in the last 30 days.
| Item | Current month revenue | Projected monthly revenue |
|---|---|---|
| Revenue amount | Total revenue of the current calendar month. | The ML forecast for your revenue by the end of the current calendar month. |
| Trend | How the revenue of the current month compares with that of the same period in the previous month. | How the forecast for the current month's revenue compares with that for the next month. |
In normal circumstances, the summary cards are updated every 12 hours.
You can select the figure on a summary card for more information:
-
Selecting the amount of Current month revenue will open a report that shows your revenue in the last 30 days.
-
Selecting the amount of Projected monthly revenue will open a report that shows a forecast for the next 12 months.
-
Selecting the figure on the customer card will open the Customers page.
Preset report widgets
This Month vs. Last
The This Month vs. Last widget shows an area chart of the on-demand usage during this calendar month versus last month.

Report configuration:
- Metrics: Cost
- Time Range: Last 2 months (include current month)
- Time Interval: Day
- Exclude partial intervals: Yes
- Filter results:
- Cost Type is not
CreditorCredit Adjustment - Credit not matches regexp
^GFS Cloud
- Cost Type is not
- Group by: Year, Month
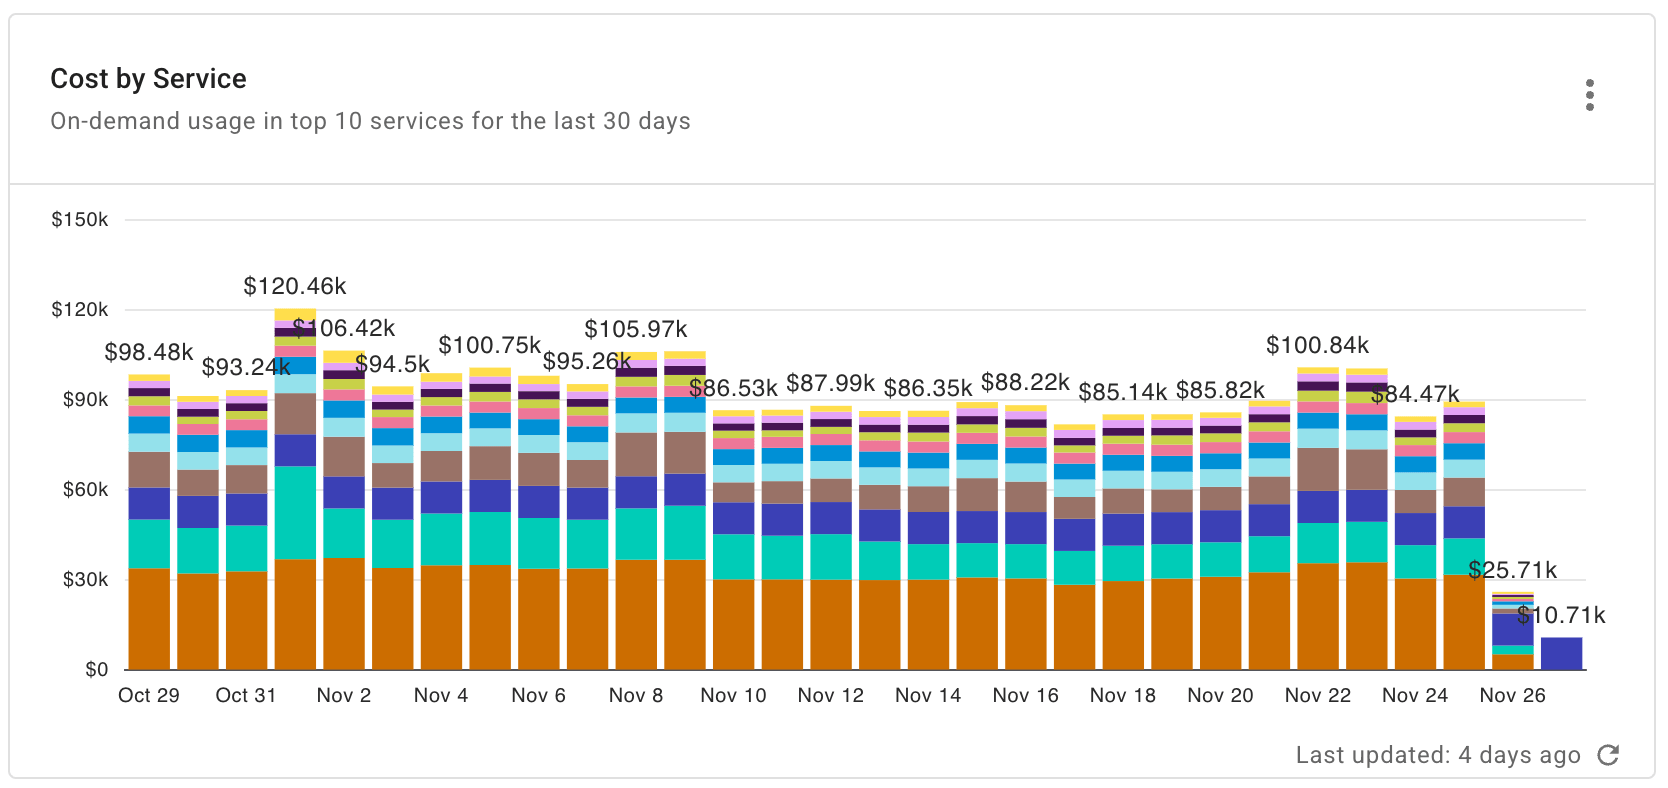
Cost by Service
The Cost by Service widget shows the on-demand usage in top 10 services for the last 30 days.
Report configuration:
- Metrics: Cost
- Time Range: Last 30 days (include current day)
- Time Interval: Day
- Filter results:
- Allocation rule is not
AWS RIs, SPsorAWS Support - Cost Type is not
CreditorCredit Adjustment - Service is not
Invoice
- Allocation rule is not
- Group by: Service
- Limit results:
- Limit by value: Cost not between -$1.00 AND U$1.00
- Limit by top/bottom: Service—Limit to top 10 by cost
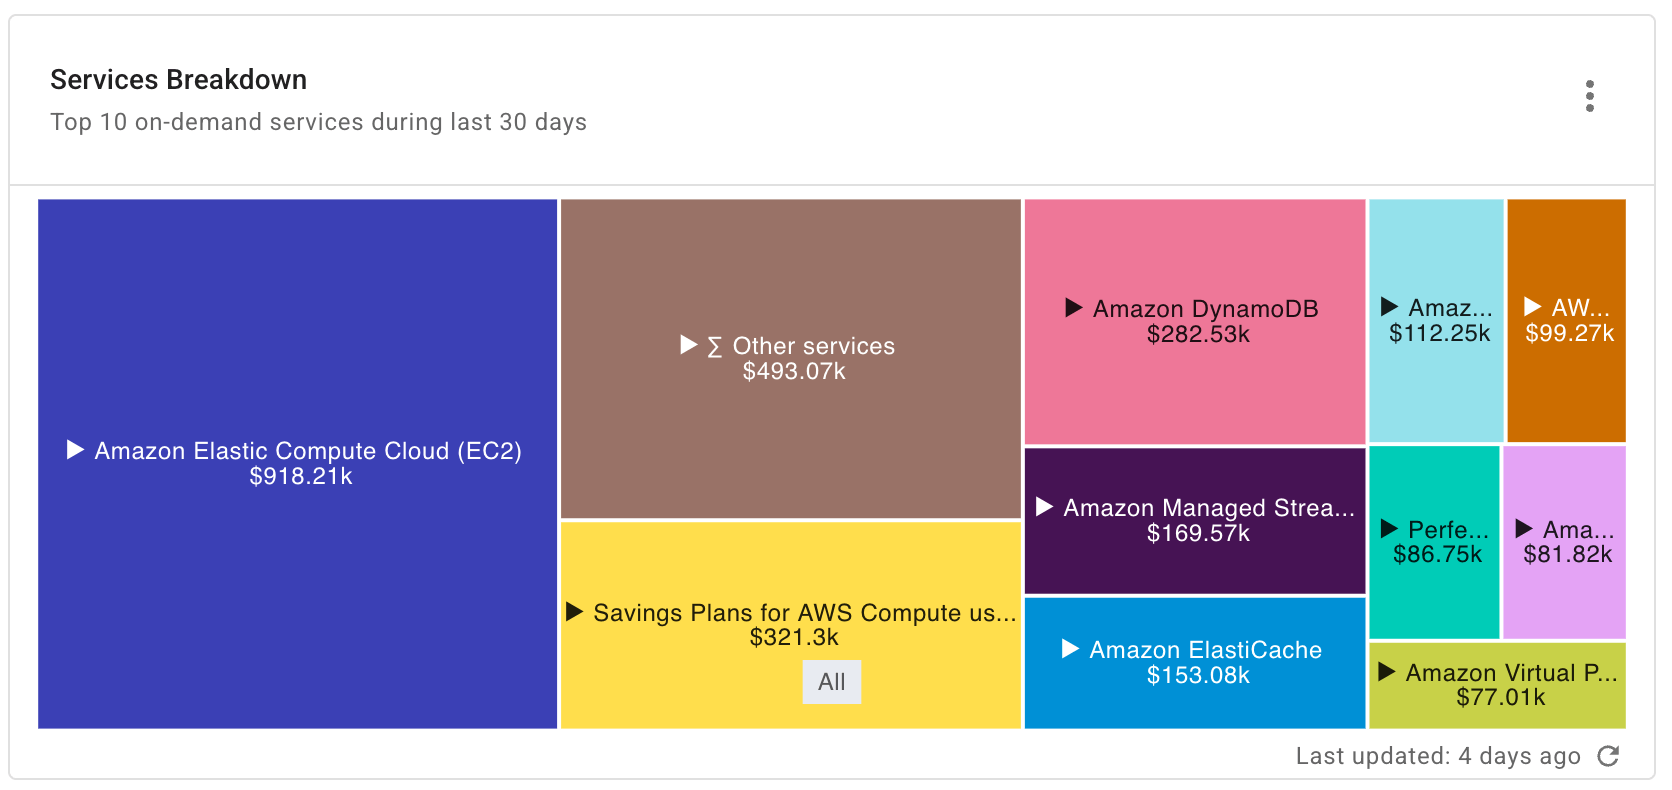
Services Breakdown
The Services Breakdown widget shows a treemap of the top 10 on-demand services during the last 30 days.
Report configuration:
- Metrics: Cost
- Time Range: Last 30 days (include current day)
- Time Interval: Day
- Filter results:
- Cost Type is not
CreditorCredit Adjustment - Credit not matches regexp
^GFS Cloud - Service is not
Invoice
- Cost Type is not
- Group by: Service, SKU
- Limit results:
- Limit by value: Cost not between -$1.00 AND $1.00
- Limit by top/bottom: Service—Limit to top 10 by cost; SKU—Limit to top 10 by cost
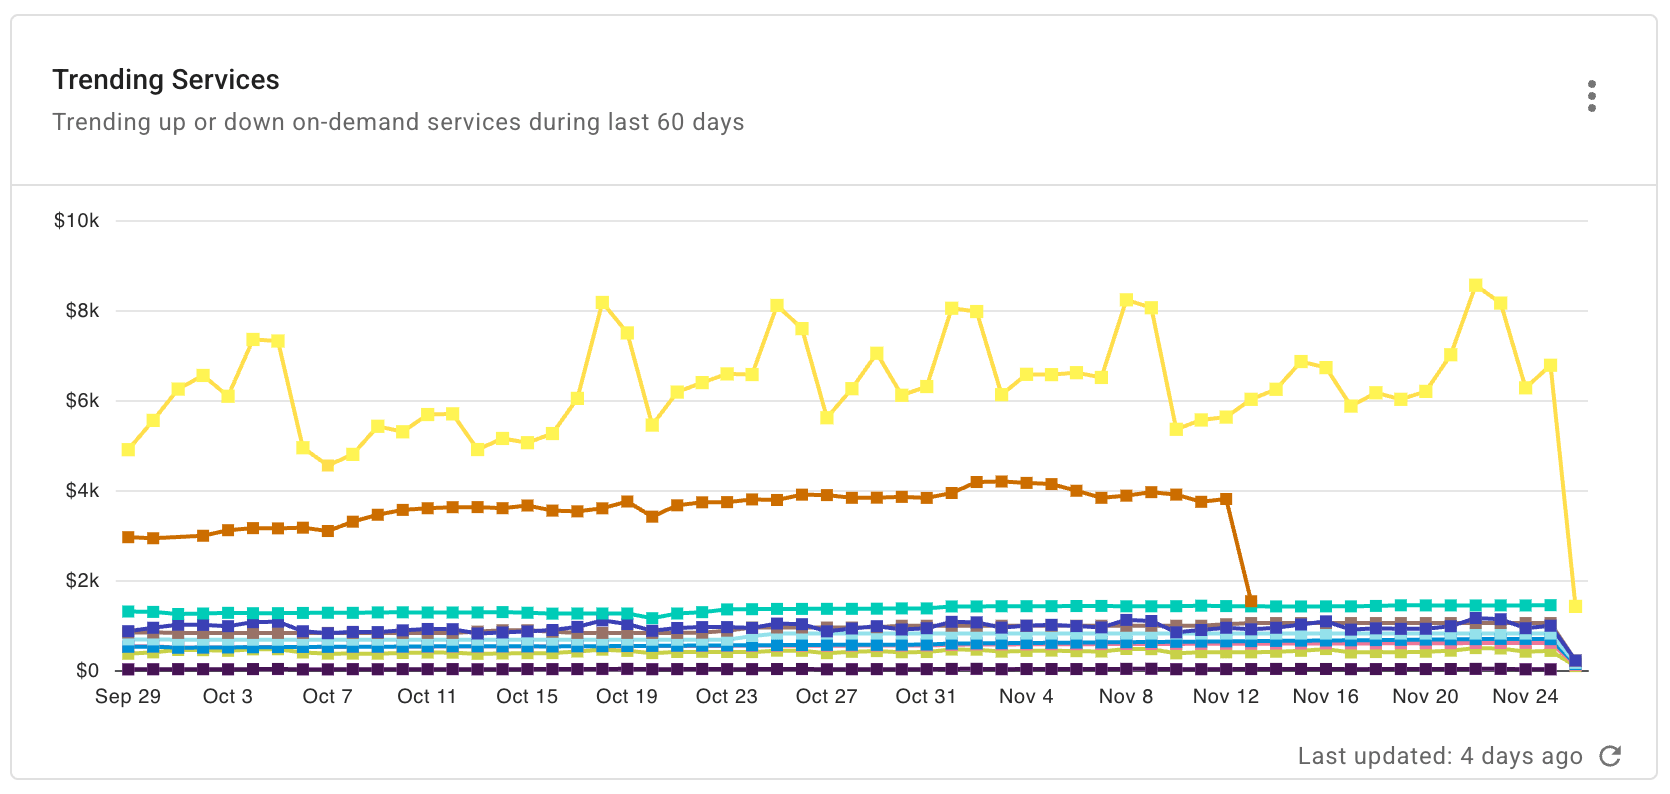
Trending Services
The Trending Services widget shows the trending up or down on-demand services during the last 60 days.
Report configuration:
- Metrics: Cost
- Time Range: Last 60 days (include current day)
- Time Interval: Day
- Exclude partial intervals: Yes
- Filter results:
- Allocation rule is not
AWS RIs, SPsorAWS Support - Cost Type is not
CreditorCredit Adjustment
- Allocation rule is not
- Group by: SKU, Service
- Limit results:
- Limit by value: Cost > $10.00
- Limit by top/bottom: SKU—Limit to top 10 by cost
- Advanced Options:
- Advanced Analysis: Trending Up
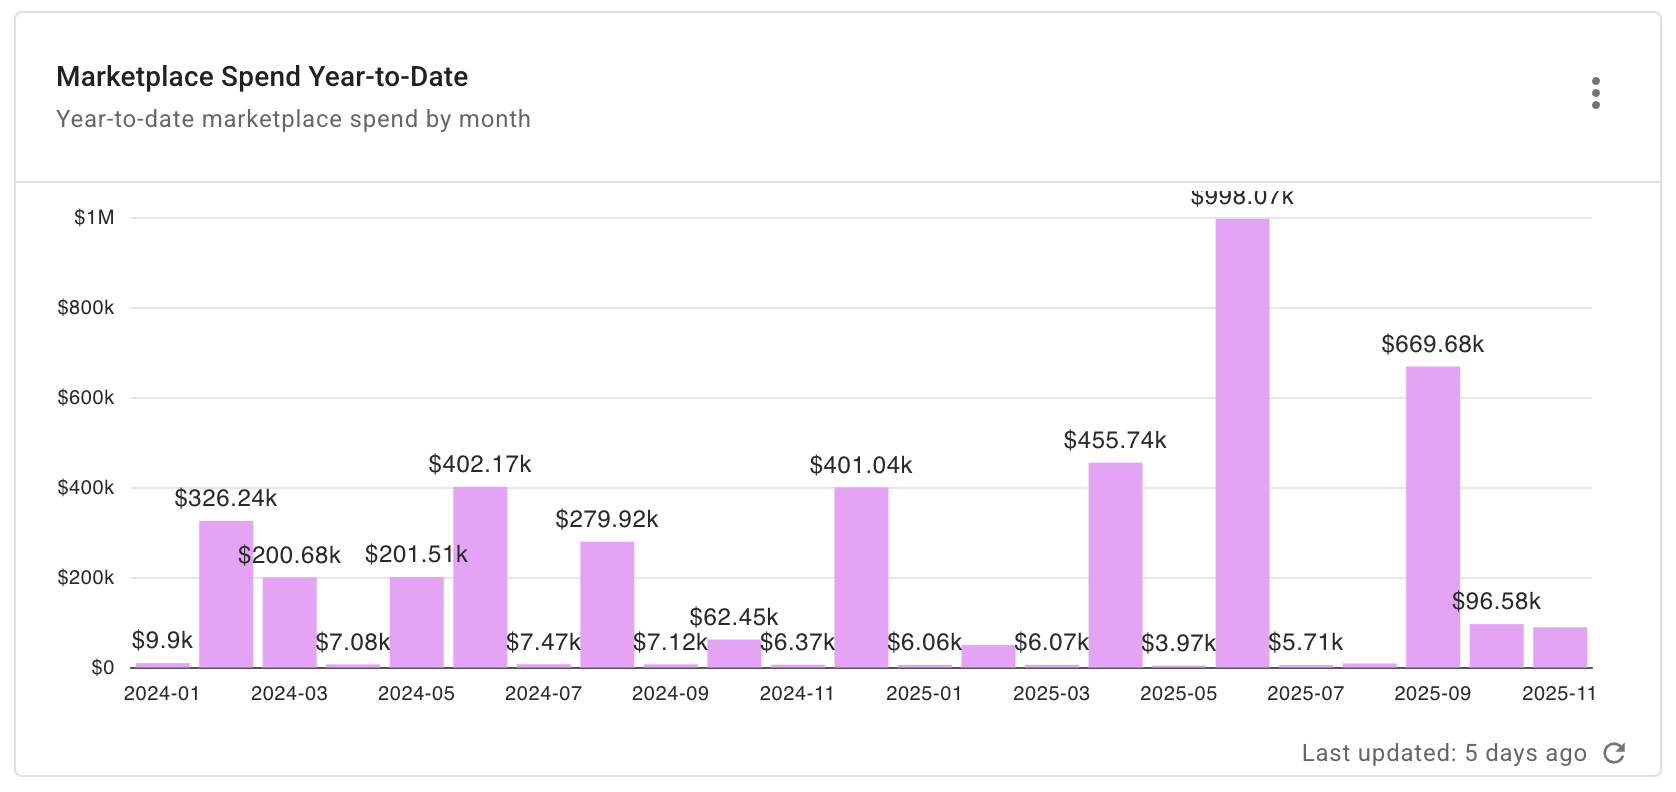
Marketplace Spend Year-to-Date
The Marketplace Spend Year-to-Date widget shows a stacked column chart of the year-to-date marketplace spend by month.
Report configuration:
- Metrics: Cost
- Time Range: Last 2 years (include current year)
- Time Interval: Month
- Filter results:
- Marketplace is
true
- Marketplace is
- Group by: Provider, Service
- Limit results:
- Limit by value: Cost not between -US$0.10 AND US$0.10
- Limit by top/bottom: Service—Limit to top 10 by cost
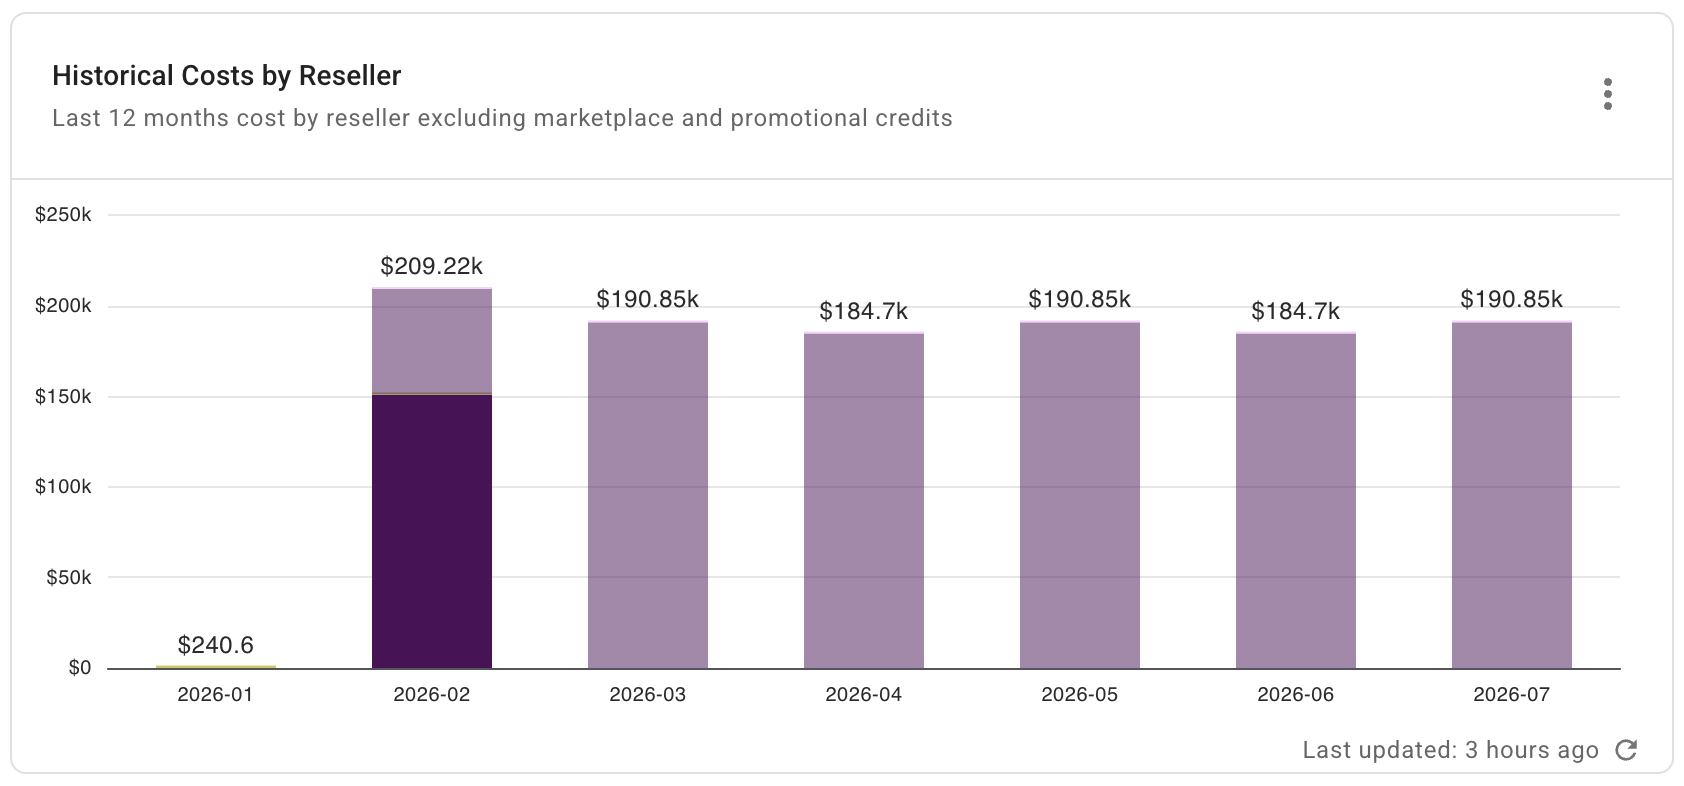
Historical Costs by Reseller (Distributor only)
The Historical Costs by Reseller widget shows cost by reseller in the last 12 months, excluding marketplace and promotional credits.
Report configuration:
- Metric: Cost
- Time Range: Last 12 months (include current month)
- Time Interval: Month
- Filter results:
- Cost Type is not
CreditorCredit Adjustment - Marketplace is
false
- Cost Type is not
- Group by: Reseller Name
- Limit results:
- Limit by value: Cost not between -$0.10 AND $0.10
Historical Costs by Customer (Reseller only)
The Historical Costs by Customer widget shows cost by customer in the last 12 months, excluding marketplace and promotional credits.

Report configuration:
- Metrics: Cost
- Time Range: Last 12 months (include current month)
- Time Interval: Month
- Filter results:
- Cost Type is not
CreditorCredit Adjustment - Marketplace is
false
- Cost Type is not
- Group by: Customer Name
- Limit results:
- Limit by value: Cost not between -$0.10 AND $0.10
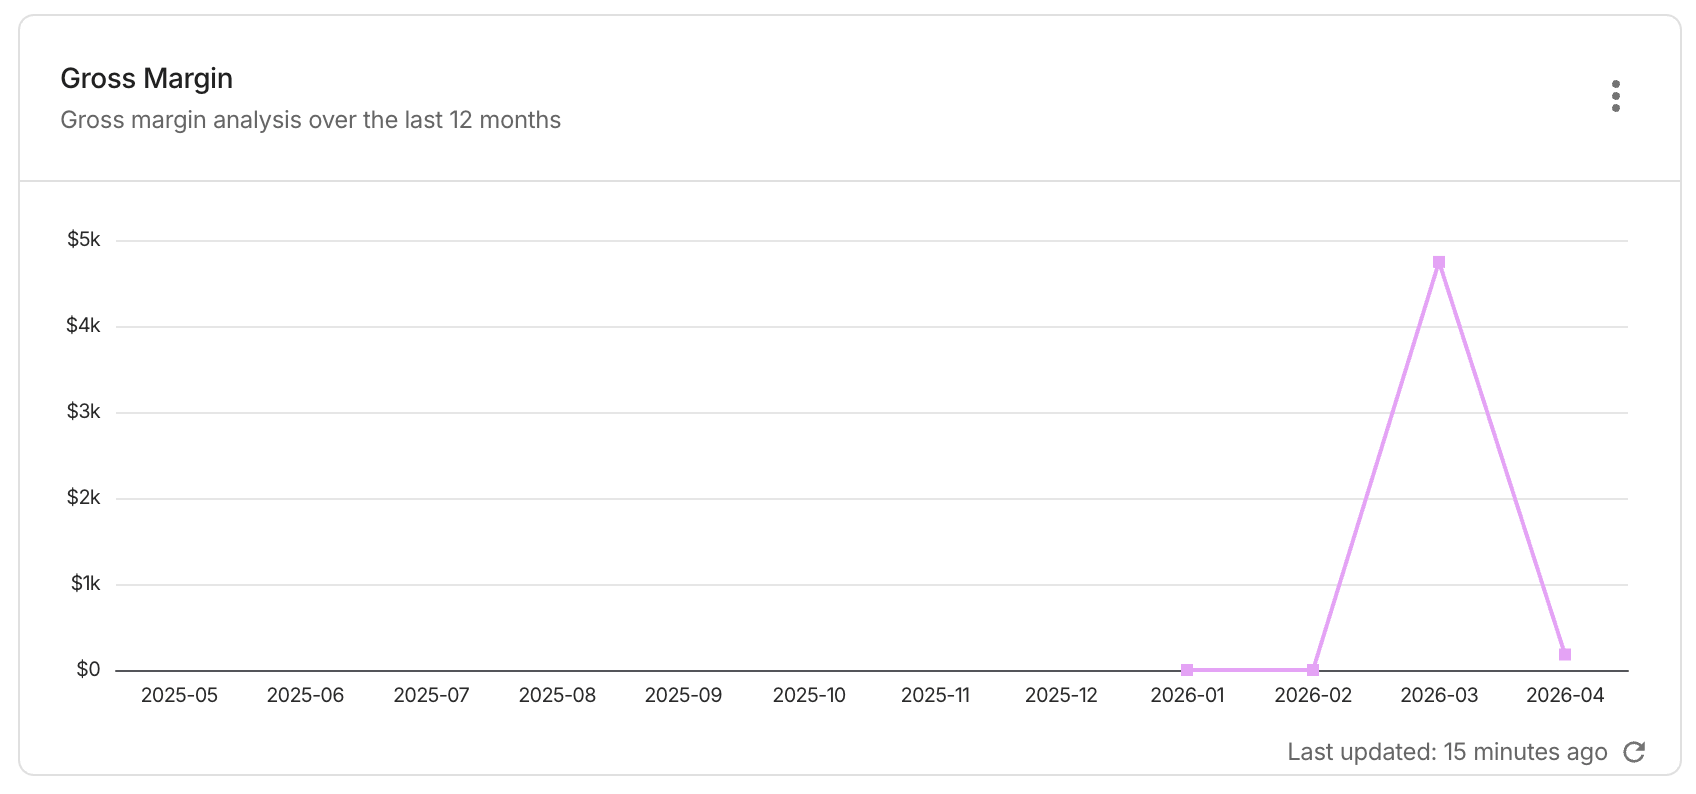
Gross Margin
The Gross Margin widget shows the margin analysis over the last 12 months.
Report configuration:
- Metrics: Margin
- Time Range: Last 12 months (include current month)
- Time Interval: Month